| Param | Original file | Final file |
|---|---|---|
| Filename | modeM0/AS1G05_009T01_9000000482_03702cztM0_level2.evt | modeM0/AS1G05_009T01_9000000482_03702cztM0_level2_quad_clean.evt |
| Size (bytes) | 644,368,320 | 63,933,120 |
| Size | 614.5 MB | 61.0 MB |
| Events in quadrant A | 7,752,362 | 306,285 |
| Events in quadrant B | 3,711,373 | 392,593 |
| Events in quadrant C | 3,218,638 | 386,815 |
| Events in quadrant D | 4,362,826 | 366,784 |
| Mode M9 | |||
|---|---|---|---|
| Quadrant | BADHDUFLAG | Total packets | Discarded packets |
| A | 0 | 20 | 0 |
| B | 0 | 20 | 0 |
| C | 0 | 20 | 0 |
| D | 0 | 20 | 0 |
| Mode SS | |||
|---|---|---|---|
| Quadrant | BADHDUFLAG | Total packets | Discarded packets |
| A | 0 | 144 | 0 |
| B | 0 | 144 | 0 |
| C | 0 | 144 | 0 |
| D | 0 | 144 | 0 |
| Mode M0 | |||
|---|---|---|---|
| Quadrant | BADHDUFLAG | Total packets | Discarded packets |
| A | 0 | 27723 | 3 |
| B | 0 | 15466 | 2 |
| C | 0 | 14261 | 2 |
| D | 0 | 17891 | 2 |
| Quadrant | Total seconds | Saturated seconds | Saturation percentage |
|---|---|---|---|
| A | 6922 | 1971 | 28.474429% |
| B | 6922 | 80 | 1.155735% |
| C | 6922 | 33 | 0.476741% |
| D | 6922 | 266 | 3.842820% |
Noise dominated data is calculated using 1-second bins in cleaned event files. If a bin has >2000 counts, and if more than 50% of those come from <1% of pixels, then it is considered to be noise-dominated and hence unusable.
| Quadrant | # 1 sec bins | Bins with >0 counts | Bins with >2000 counts | High rate bins dominated by noise | Noise dominated (total time) | Noise dominated (detector-on time) | Marked lightcurve |
|---|---|---|---|---|---|---|---|
| A | 8956 | 6922 | 1797 | 1797 | 20.06% | 25.96% |  |
| B | 8957 | 6924 | 5 | 5 | 0.06% | 0.07% | 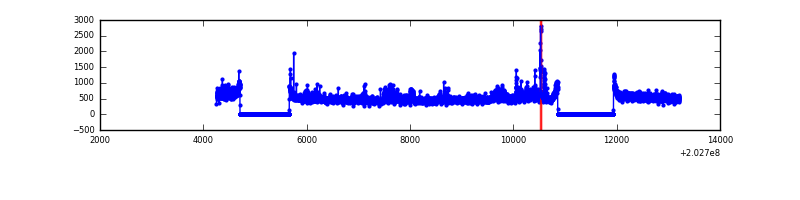 |
| C | 8957 | 6924 | 1 | 1 | 0.01% | 0.01% | 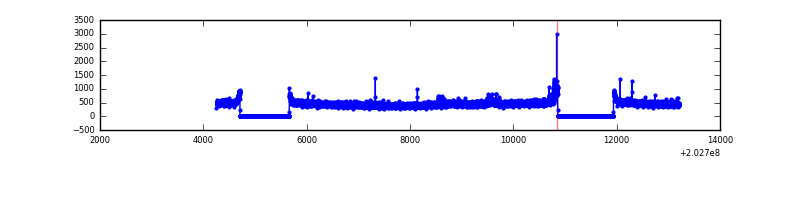 |
| D | 8957 | 6924 | 225 | 225 | 2.51% | 3.25% | 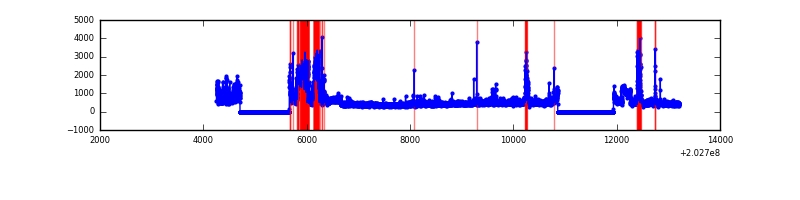 |
Top three noisy pixels from each quadrant. If the there are fewer than three noisy pixels in the level2.evt file, extra rows are filled as -1
| Pixel properties | Quadrant properties | ||||||
|---|---|---|---|---|---|---|---|
| Quadrant | DetID | PixID | Counts | Sigma | Mean | Median | Sigma |
| A | 13 | 251 | 5081591 | 37205.8 | 670 | 656 | 136.6 |
| A | 13 | 164 | 62203 | 450.69 | 670 | 656 | 136.6 |
| A | 0 | 50 | 10898 | 75.0 | 670 | 656 | 136.6 |
| B | 15 | 204 | 304886 | 1885.47 | 837 | 816 | 161.3 |
| B | 5 | 70 | 63773 | 390.38 | 837 | 816 | 161.3 |
| B | 14 | 167 | 54061 | 330.16 | 837 | 816 | 161.3 |
| C | 2 | 53 | 76104 | 402.79 | 801 | 806 | 186.9 |
| C | 13 | 61 | 6821 | 32.18 | 801 | 806 | 186.9 |
| C | 9 | 247 | 6351 | 29.66 | 801 | 806 | 186.9 |
| D | 9 | 35 | 812100 | 4279.14 | 786 | 764 | 189.6 |
| D | 1 | 84 | 156860 | 823.28 | 786 | 764 | 189.6 |
| D | 13 | 223 | 111689 | 585.04 | 786 | 764 | 189.6 |
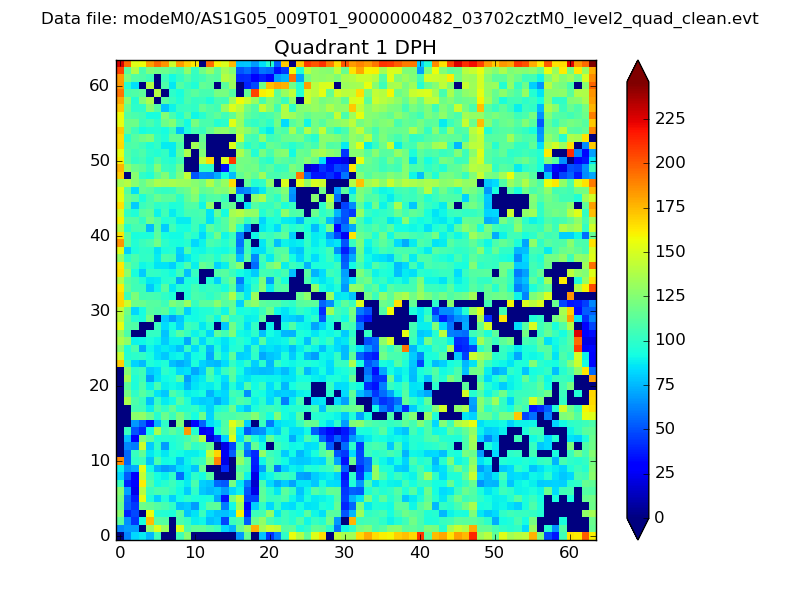
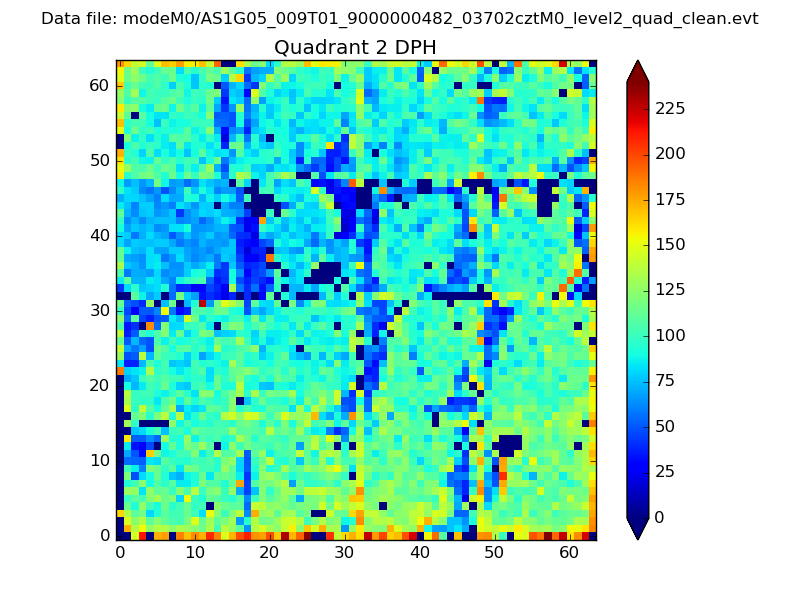
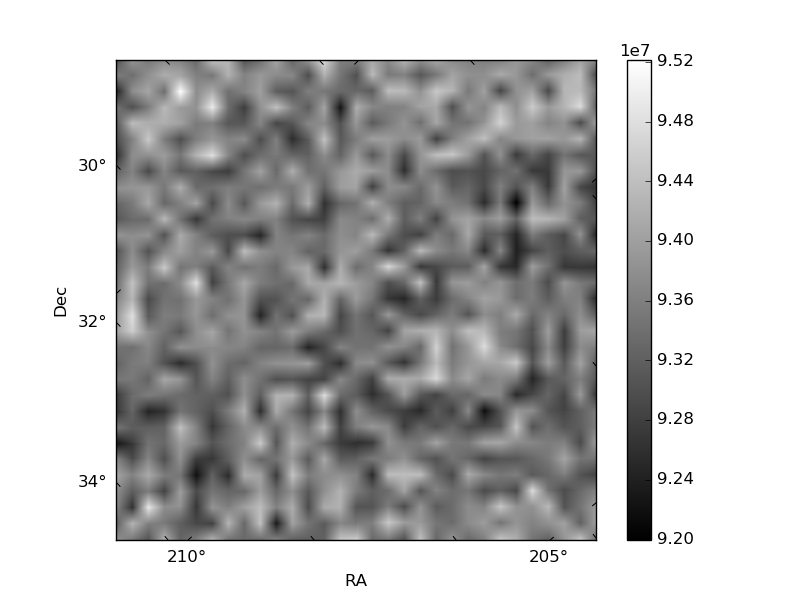
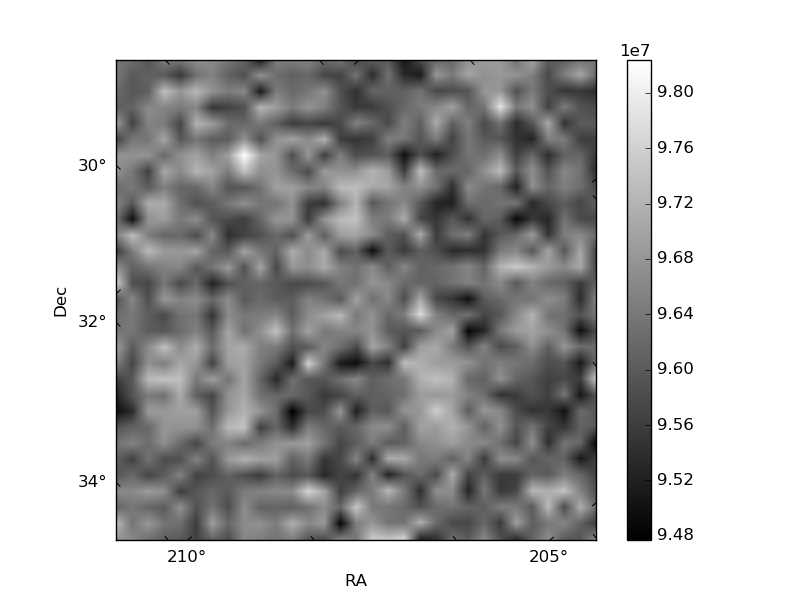
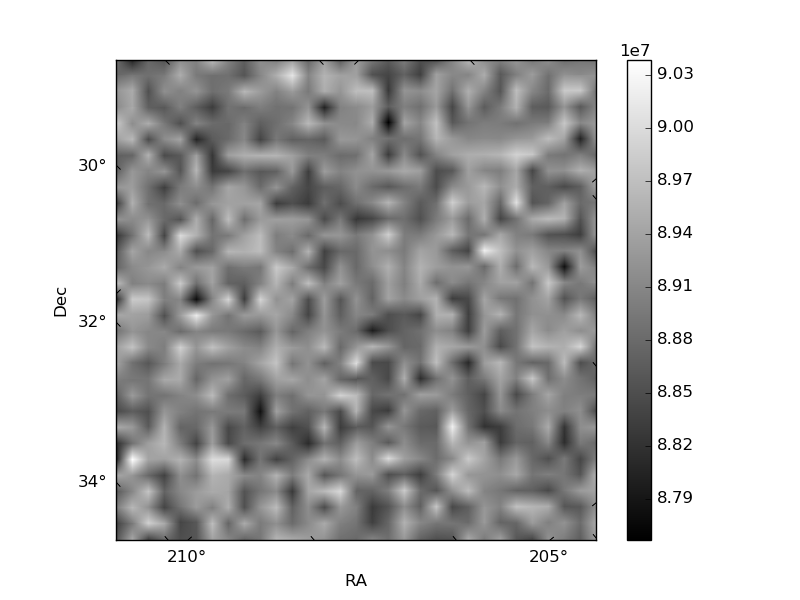
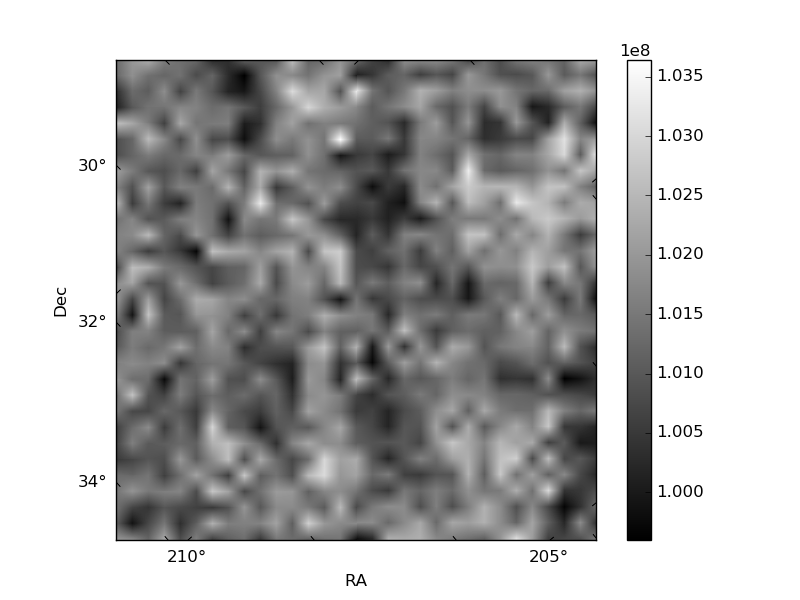
Histogram calculated using DETX and DETY for each event in the final _common_clean file
| Quadrant A | 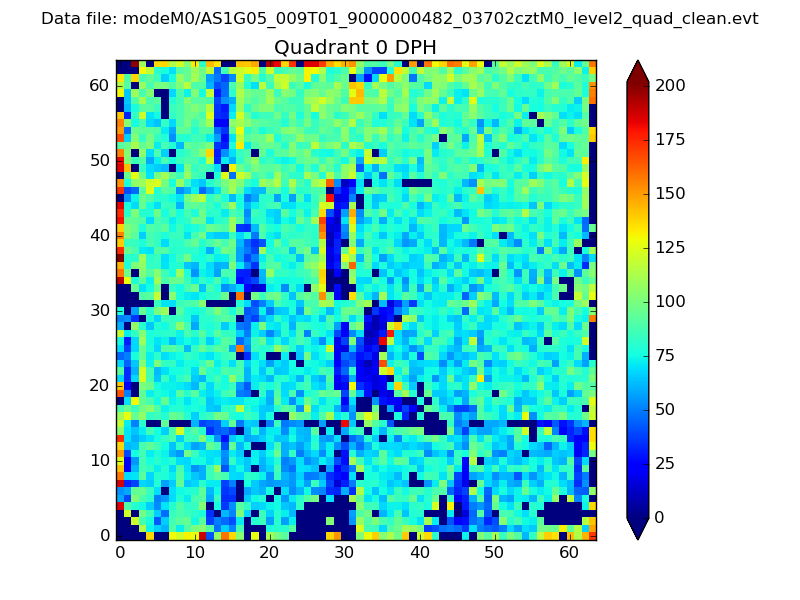 |
 |
Quadrant B |
|---|---|---|---|
| Quadrant D | 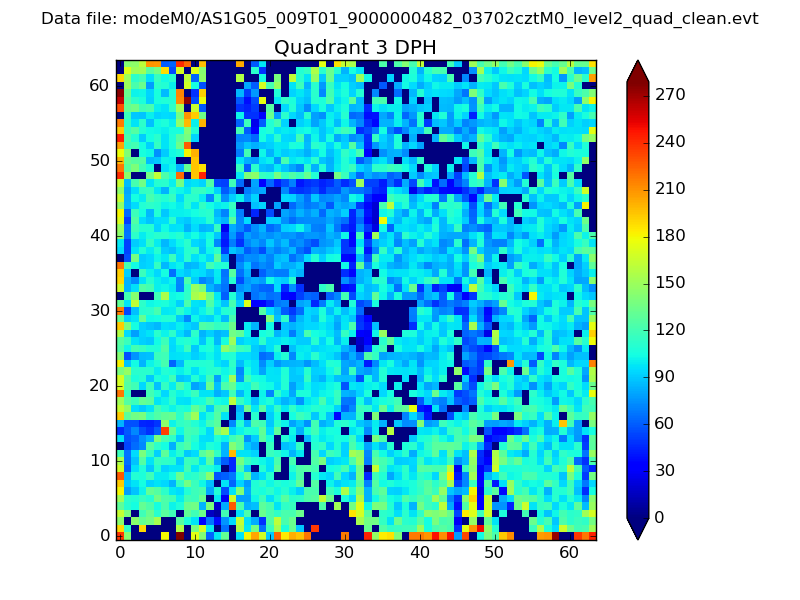 |
 |
Quadrant C |
| Plot type | Count rate plots | Images |
|---|---|---|
| Comparison with Poisson distribution Blue bars denote a histogram of data divided into 1 sec bins. Red curve is a Poisson curve with rate = median count rate of data. |
 |
 |
| Quadrant-wise count rates Data is divided into 100 sec bins |
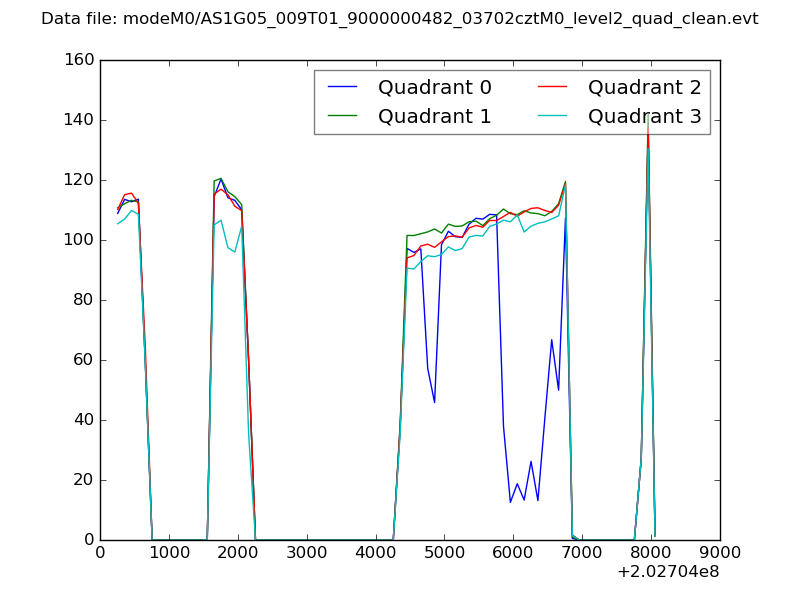 |
|
| Module-wise count rates for Quadrant A Data is divided into 100 sec bins |
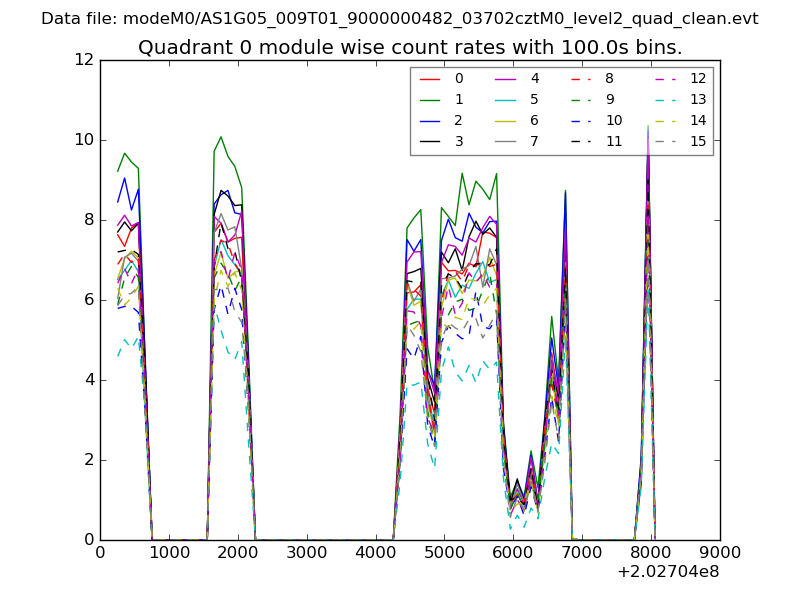 |
 |
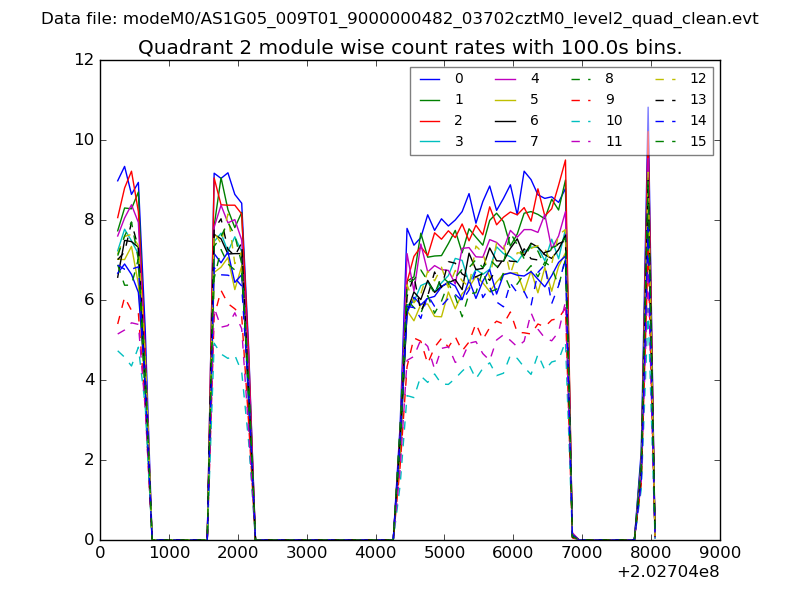
| Module-wise count rates for Quadrant B Data is divided into 100 sec bins |
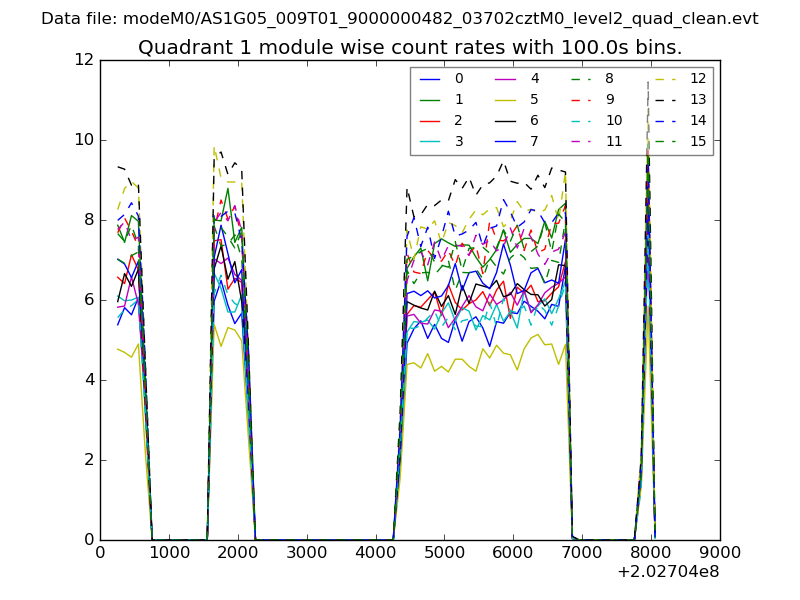 |
 |
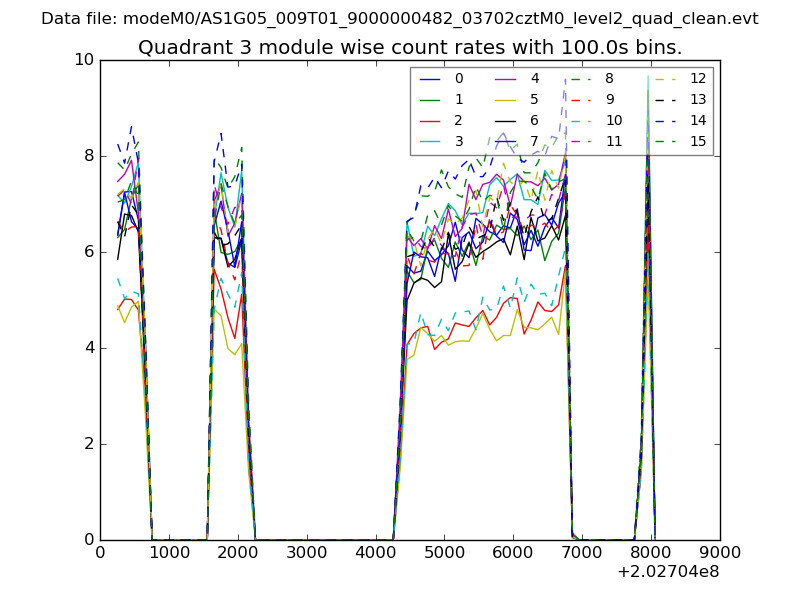
| Module-wise count rates for Quadrant C Data is divided into 100 sec bins |
 |
 |
| Module-wise count rates for Quadrant D Data is divided into 100 sec bins |
 |
 |
| Parameter | Plot |
|---|---|
| CZT HV Monitor | 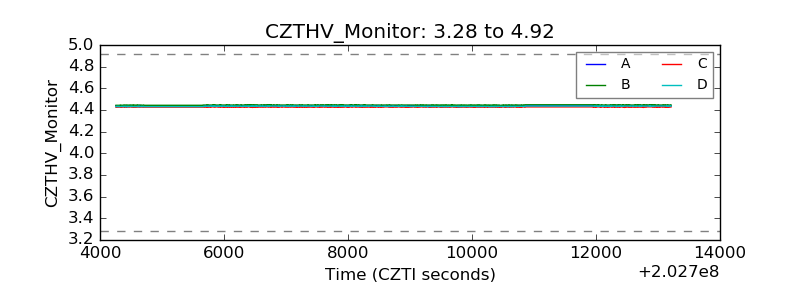 |
| D_VDD | 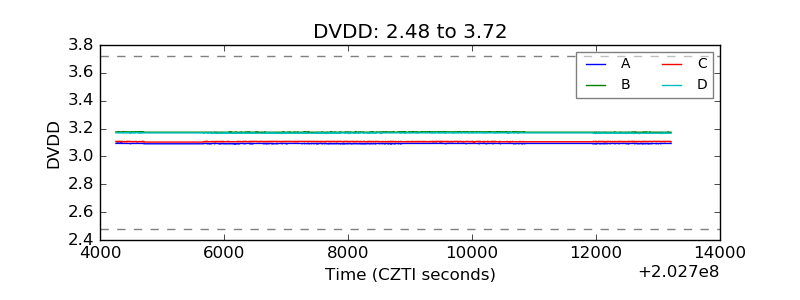 |
| Temperature 1 | 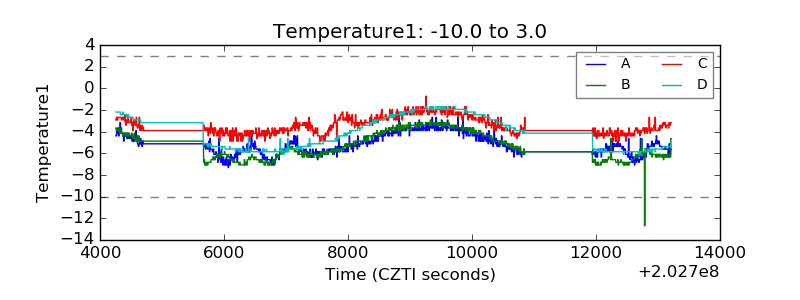 |
| Veto HV Monitor | 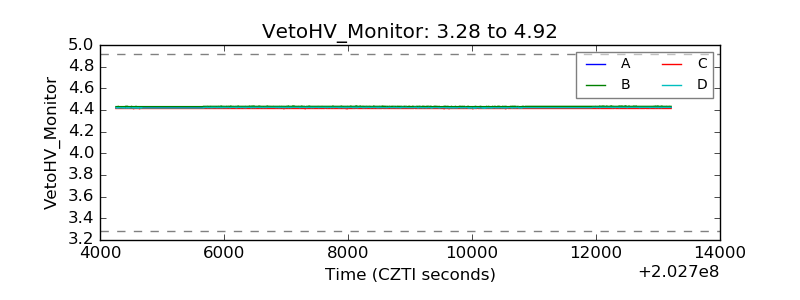 |
| Veto LLD | 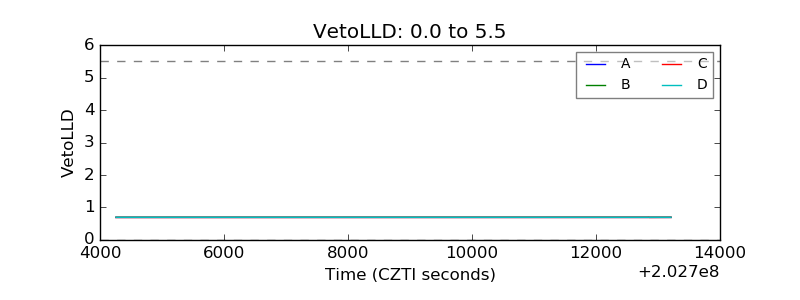 |
| Alpha Counter | 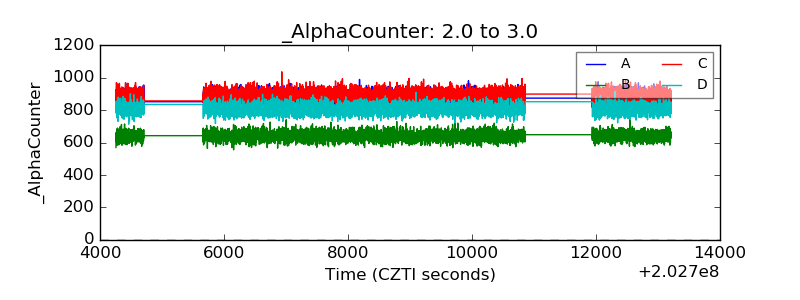 |
| _CPM_Rate | 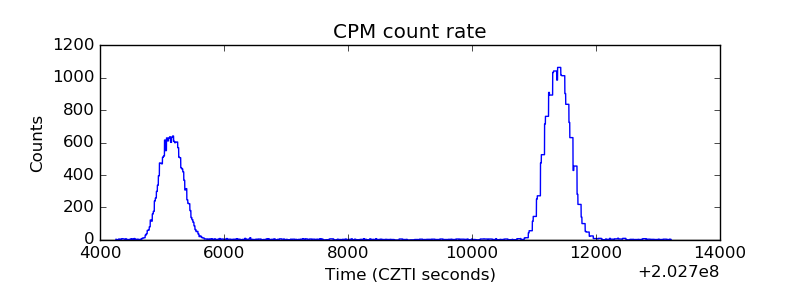 |
| CZT Counter | 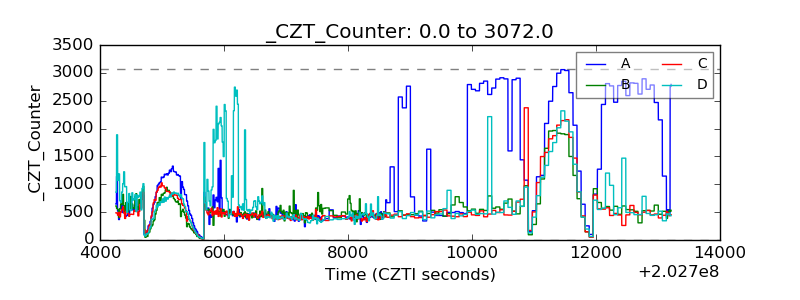 |
| +2.5 Volts monitor |  |
| +5 Volts monitor |  |
| Veto Counter | 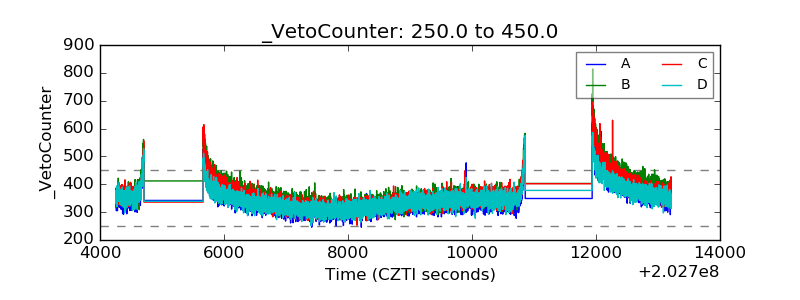 |