| Param | Original file | Final file |
|---|---|---|
| Filename | modeM0/AS1G05_009T01_9000000482_03703cztM0_level2.evt | modeM0/AS1G05_009T01_9000000482_03703cztM0_level2_quad_clean.evt |
| Size (bytes) | 564,600,960 | 55,298,880 |
| Size | 538.4 MB | 52.7 MB |
| Events in quadrant A | 6,282,054 | 309,241 |
| Events in quadrant B | 3,861,042 | 312,212 |
| Events in quadrant C | 3,107,191 | 307,830 |
| Events in quadrant D | 3,414,465 | 298,054 |
| Mode M9 | |||
|---|---|---|---|
| Quadrant | BADHDUFLAG | Total packets | Discarded packets |
| A | 0 | 20 | 0 |
| B | 0 | 20 | 0 |
| C | 0 | 20 | 0 |
| D | 0 | 21 | 0 |
| Mode SS | |||
|---|---|---|---|
| Quadrant | BADHDUFLAG | Total packets | Discarded packets |
| A | 0 | 132 | 0 |
| B | 0 | 132 | 0 |
| C | 0 | 132 | 0 |
| D | 0 | 132 | 0 |
| Mode M0 | |||
|---|---|---|---|
| Quadrant | BADHDUFLAG | Total packets | Discarded packets |
| A | 0 | 22791 | 3 |
| B | 0 | 15376 | 2 |
| C | 0 | 13504 | 2 |
| D | 0 | 14358 | 2 |
| Quadrant | Total seconds | Saturated seconds | Saturation percentage |
|---|---|---|---|
| A | 6394 | 1380 | 21.582734% |
| B | 6394 | 141 | 2.205192% |
| C | 6394 | 64 | 1.000938% |
| D | 6394 | 66 | 1.032218% |
Noise dominated data is calculated using 1-second bins in cleaned event files. If a bin has >2000 counts, and if more than 50% of those come from <1% of pixels, then it is considered to be noise-dominated and hence unusable.
| Quadrant | # 1 sec bins | Bins with >0 counts | Bins with >2000 counts | High rate bins dominated by noise | Noise dominated (total time) | Noise dominated (detector-on time) | Marked lightcurve |
|---|---|---|---|---|---|---|---|
| A | 7574 | 6395 | 1229 | 1229 | 16.23% | 19.22% | 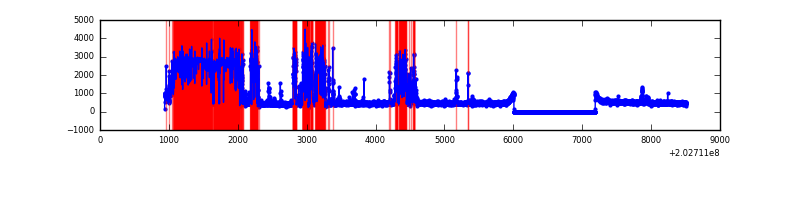 |
| B | 7574 | 6395 | 60 | 60 | 0.79% | 0.94% | 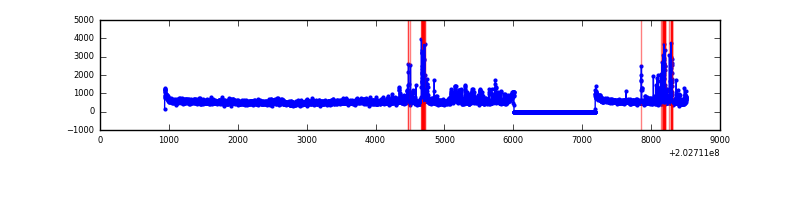 |
| C | 7574 | 6395 | 18 | 18 | 0.24% | 0.28% | 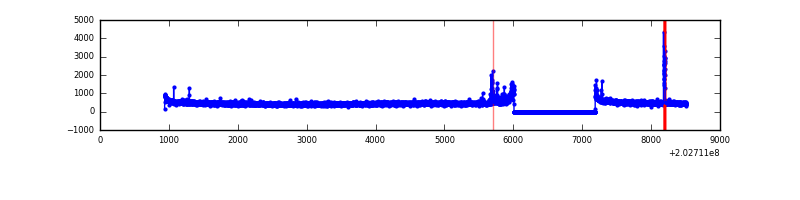 |
| D | 7574 | 6395 | 43 | 43 | 0.57% | 0.67% | 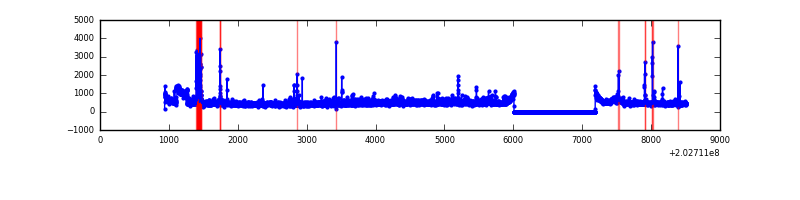 |
Top three noisy pixels from each quadrant. If the there are fewer than three noisy pixels in the level2.evt file, extra rows are filled as -1
| Pixel properties | Quadrant properties | ||||||
|---|---|---|---|---|---|---|---|
| Quadrant | DetID | PixID | Counts | Sigma | Mean | Median | Sigma |
| A | 13 | 251 | 3615774 | 25565.39 | 690 | 676 | 141.4 |
| A | 0 | 226 | 7187 | 46.04 | 690 | 676 | 141.4 |
| A | 12 | 194 | 7077 | 45.27 | 690 | 676 | 141.4 |
| B | 14 | 167 | 292605 | 1903.04 | 794 | 775 | 153.3 |
| B | 15 | 204 | 184094 | 1195.43 | 794 | 775 | 153.3 |
| B | 5 | 70 | 183613 | 1192.29 | 794 | 775 | 153.3 |
| C | 9 | 247 | 41133 | 230.25 | 755 | 761 | 175.3 |
| C | 8 | 208 | 39863 | 223.01 | 755 | 761 | 175.3 |
| C | 7 | 239 | 23644 | 130.51 | 755 | 761 | 175.3 |
| D | 1 | 84 | 150426 | 826.86 | 749 | 726 | 181.0 |
| D | 13 | 223 | 130103 | 714.61 | 749 | 726 | 181.0 |
| D | 10 | 187 | 99382 | 544.92 | 749 | 726 | 181.0 |
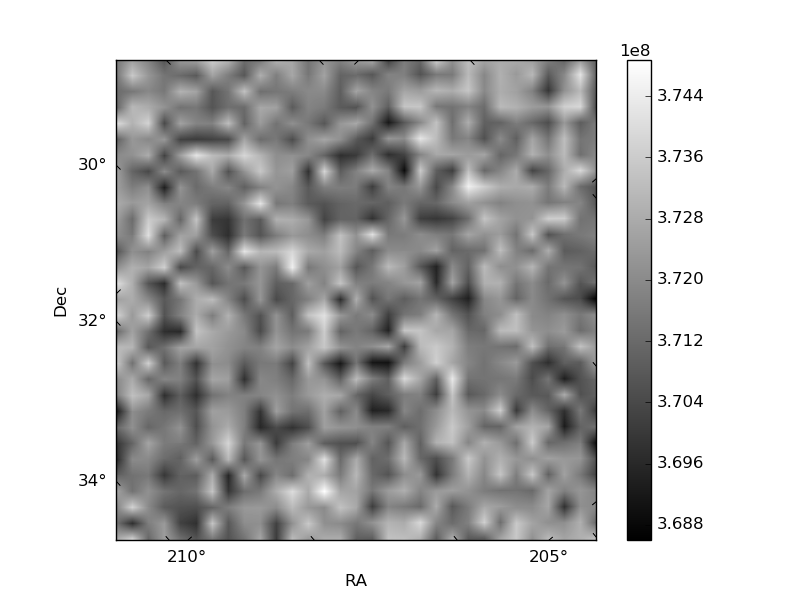
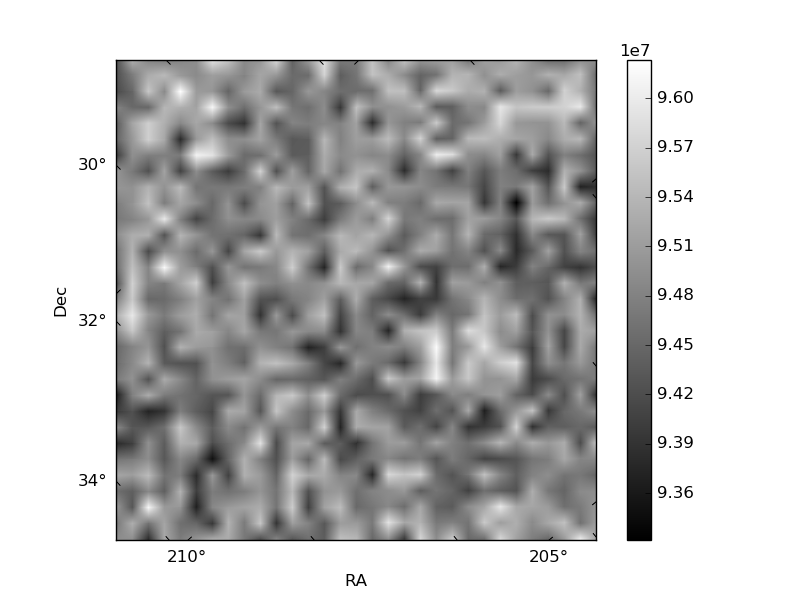
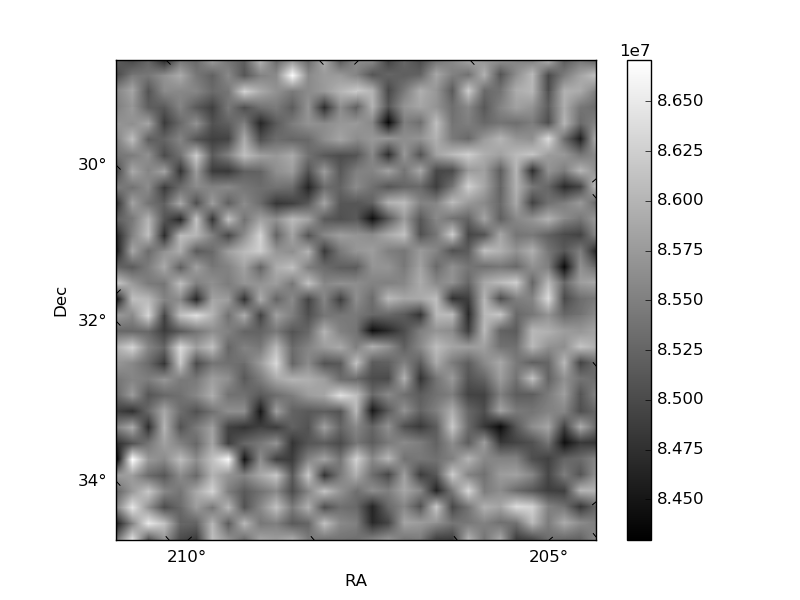
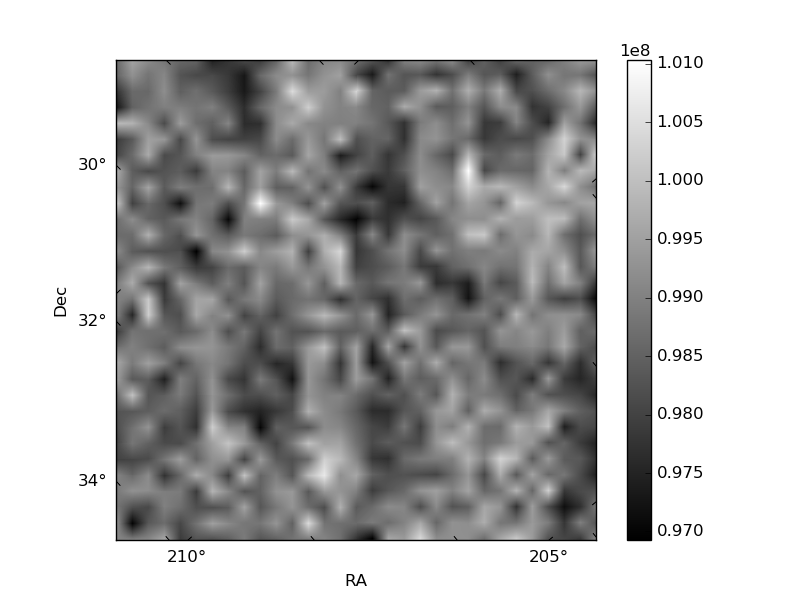
Histogram calculated using DETX and DETY for each event in the final _common_clean file
| Quadrant A | 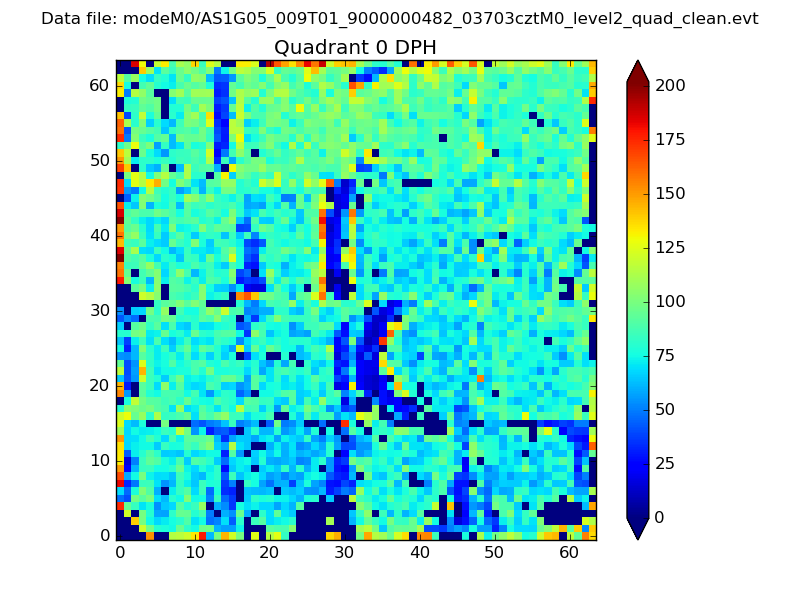 |
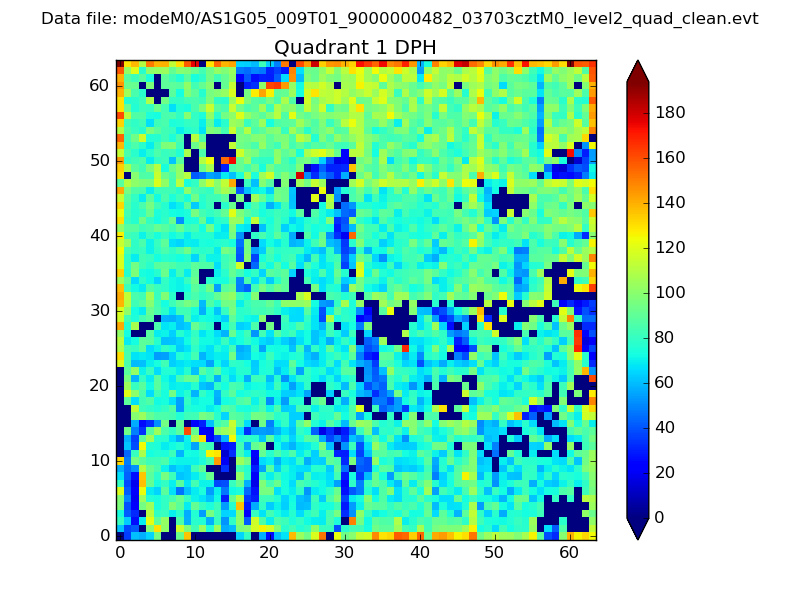 |
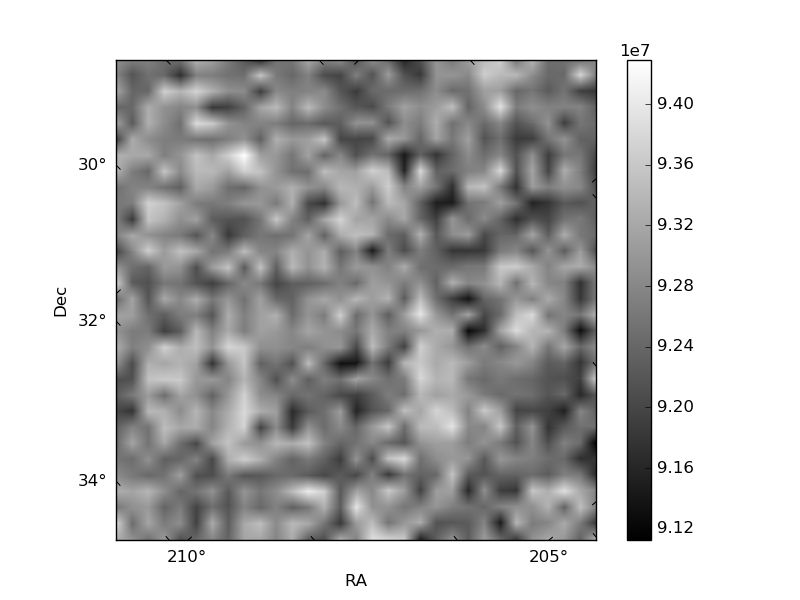
Quadrant B |
|---|---|---|---|
| Quadrant D | 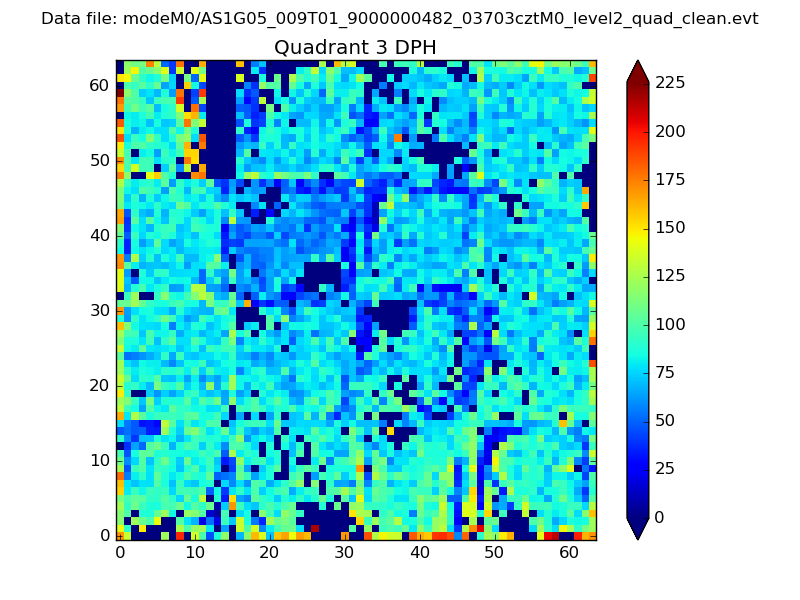 |
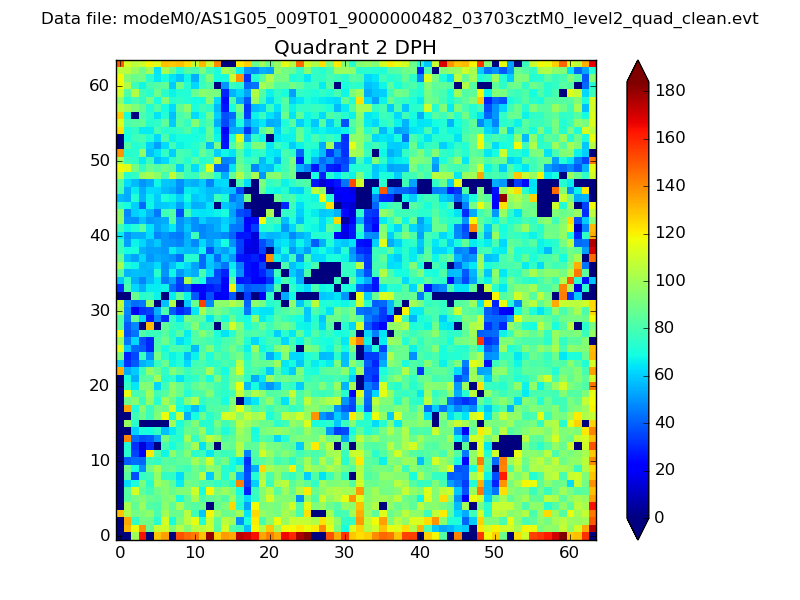 |
Quadrant C |
| Plot type | Count rate plots | Images |
|---|---|---|
| Comparison with Poisson distribution Blue bars denote a histogram of data divided into 1 sec bins. Red curve is a Poisson curve with rate = median count rate of data. |
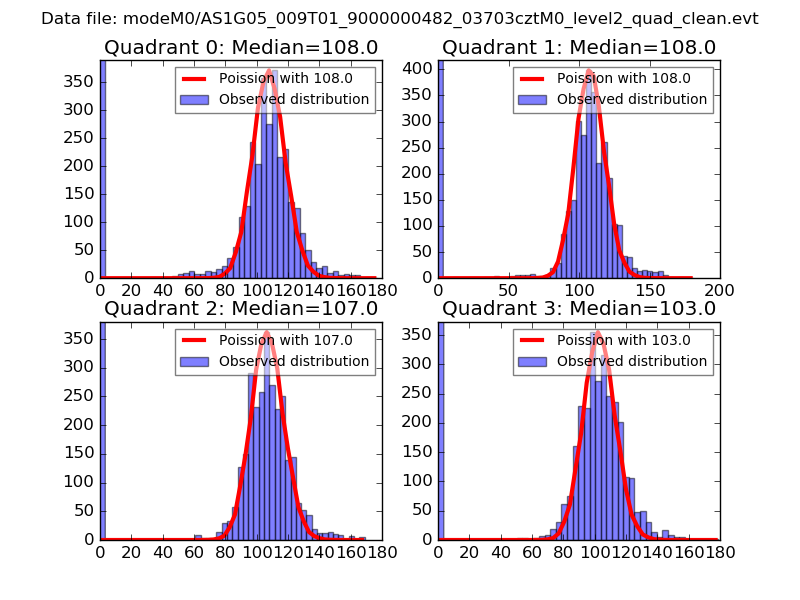 |
 |
| Quadrant-wise count rates Data is divided into 100 sec bins |
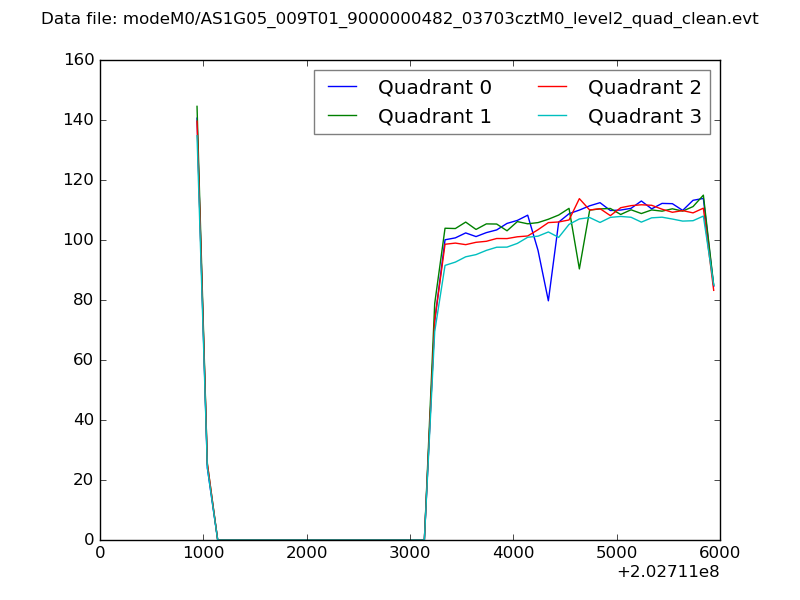 |
|
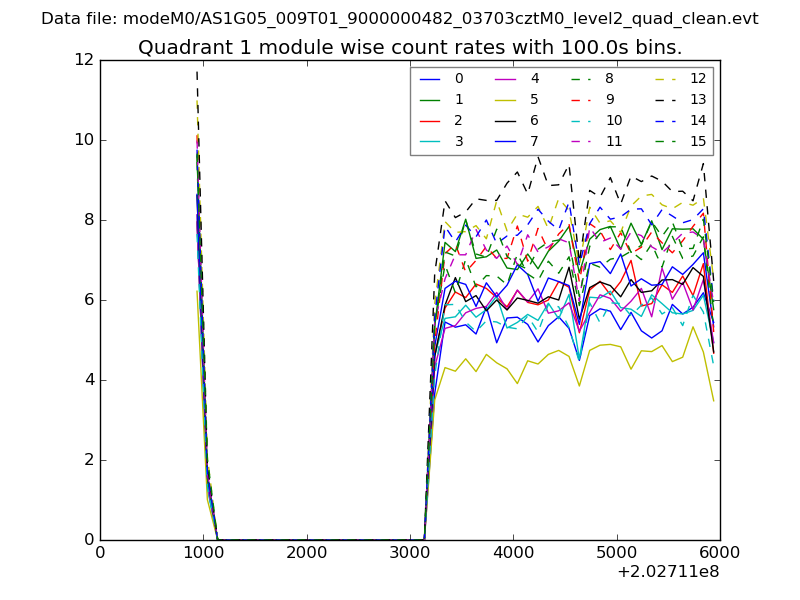
| Module-wise count rates for Quadrant A Data is divided into 100 sec bins |
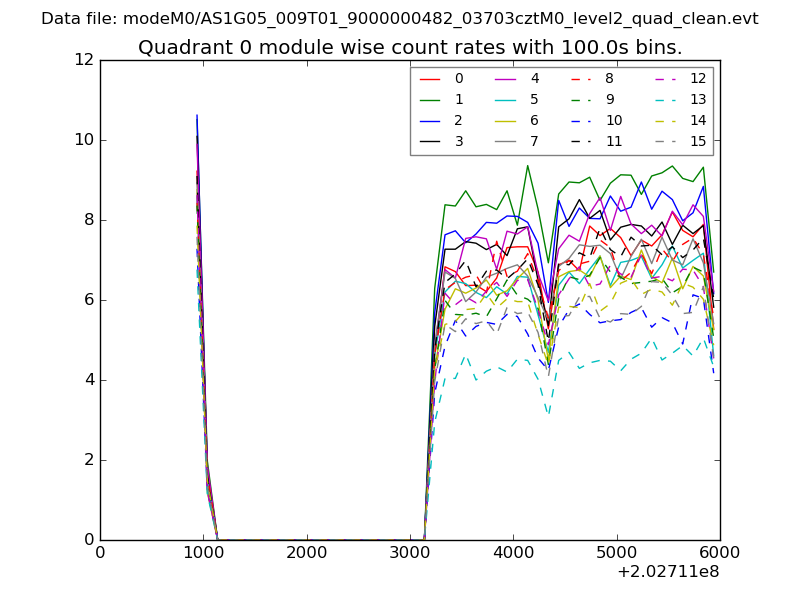 |
 |
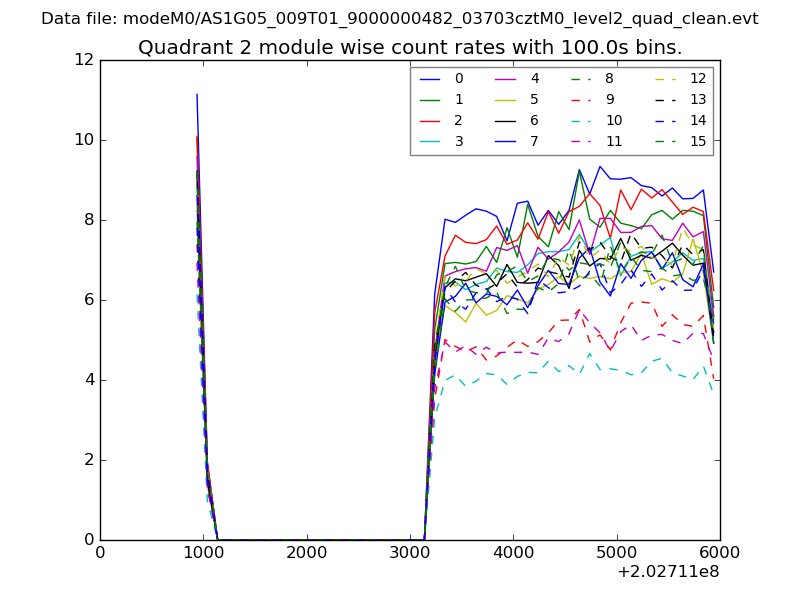
| Module-wise count rates for Quadrant B Data is divided into 100 sec bins |
 |
 |
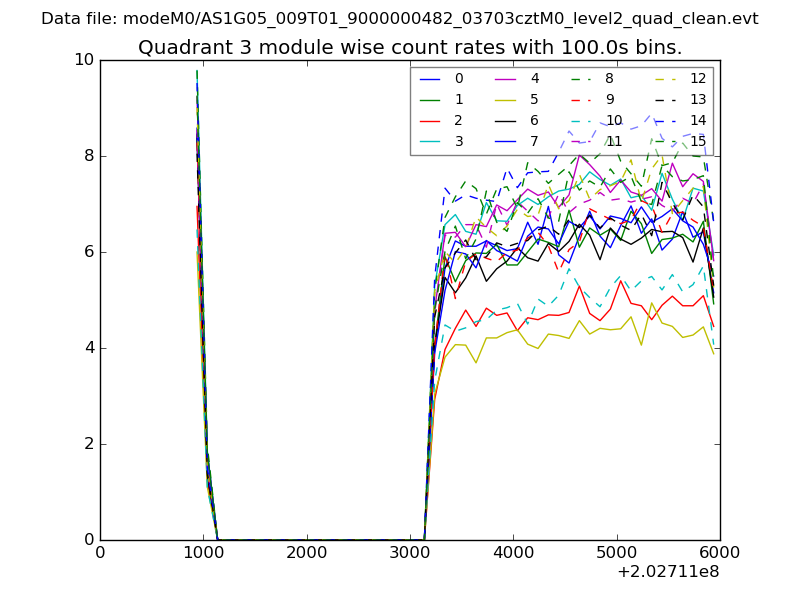
| Module-wise count rates for Quadrant C Data is divided into 100 sec bins |
 |
 |
| Module-wise count rates for Quadrant D Data is divided into 100 sec bins |
 |
 |
| Parameter | Plot |
|---|---|
| CZT HV Monitor | 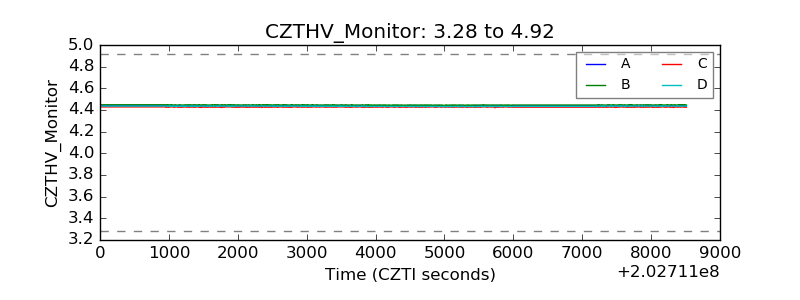 |
| D_VDD | 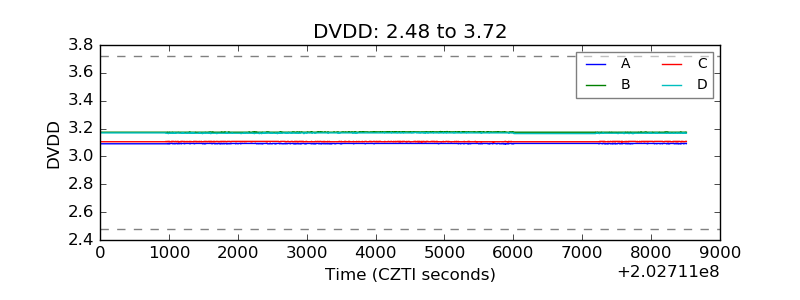 |
| Temperature 1 | 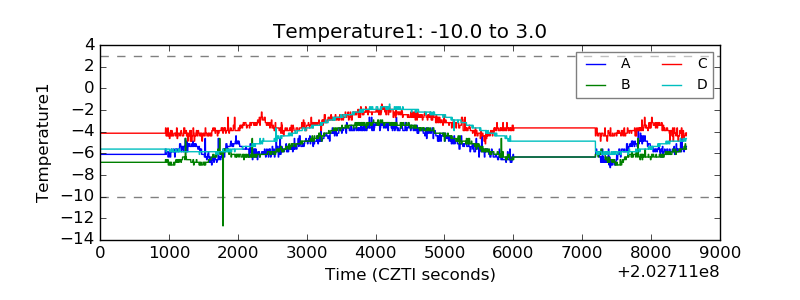 |
| Veto HV Monitor | 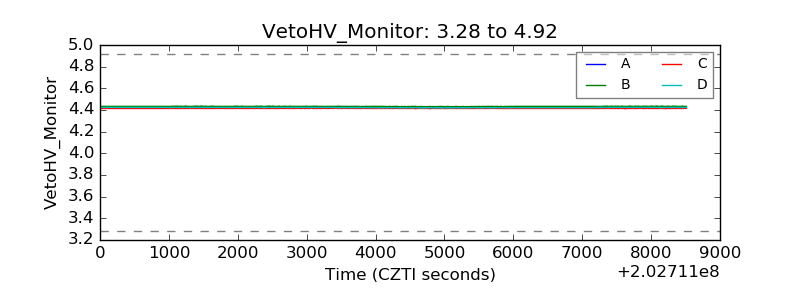 |
| Veto LLD | 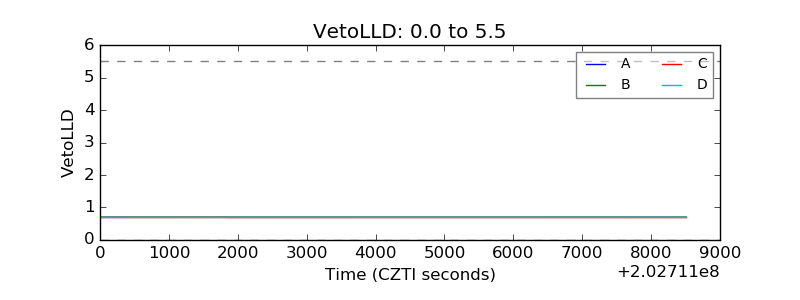 |
| Alpha Counter | 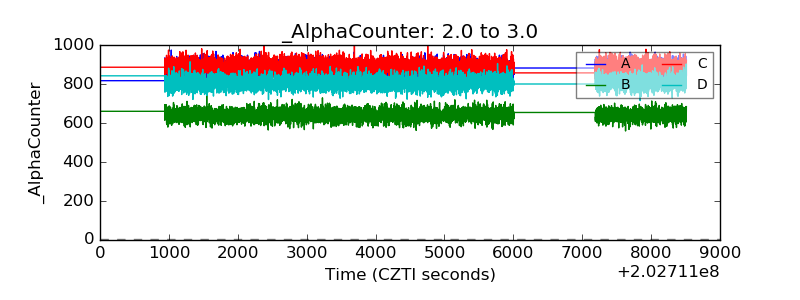 |
| _CPM_Rate | 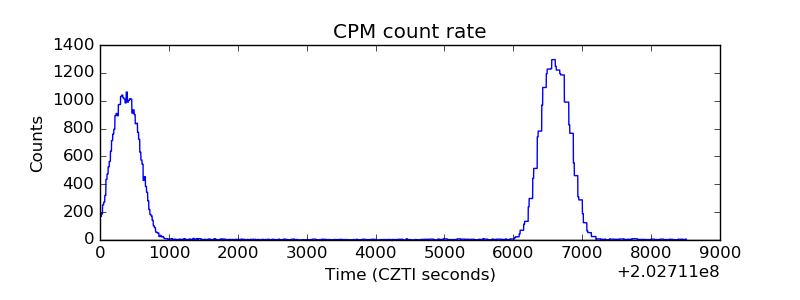 |
| CZT Counter | 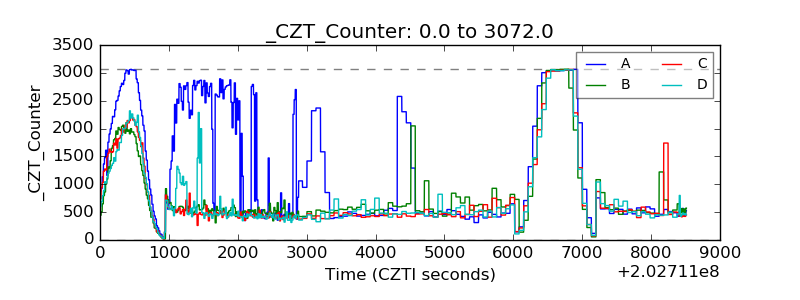 |
| +2.5 Volts monitor |  |
| +5 Volts monitor | 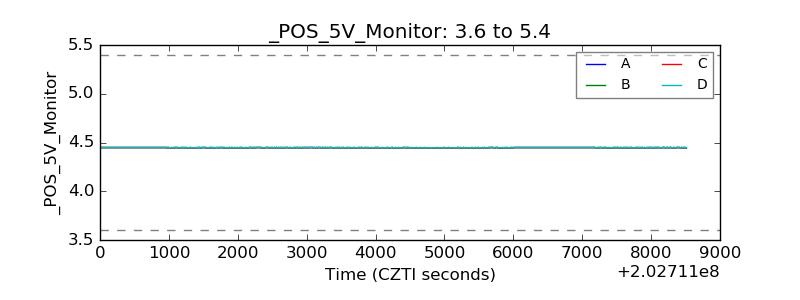 |
| Veto Counter | 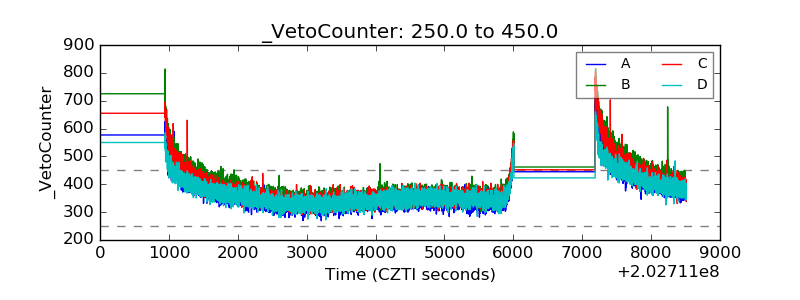 |