| Param | Original file | Final file |
|---|---|---|
| Filename | modeM0/AS1G05_009T01_9000000482_03704cztM0_level2.evt | modeM0/AS1G05_009T01_9000000482_03704cztM0_level2_quad_clean.evt |
| Size (bytes) | 545,659,200 | 59,290,560 |
| Size | 520.4 MB | 56.5 MB |
| Events in quadrant A | 3,230,195 | 346,363 |
| Events in quadrant B | 6,100,088 | 334,107 |
| Events in quadrant C | 3,233,533 | 338,752 |
| Events in quadrant D | 3,523,014 | 324,691 |
| Mode M9 | |||
|---|---|---|---|
| Quadrant | BADHDUFLAG | Total packets | Discarded packets |
| A | 0 | 20 | 0 |
| B | 0 | 20 | 0 |
| C | 0 | 20 | 0 |
| D | 0 | 21 | 0 |
| Mode SS | |||
|---|---|---|---|
| Quadrant | BADHDUFLAG | Total packets | Discarded packets |
| A | 0 | 130 | 0 |
| B | 0 | 130 | 0 |
| C | 0 | 130 | 0 |
| D | 0 | 130 | 0 |
| Mode M0 | |||
|---|---|---|---|
| Quadrant | BADHDUFLAG | Total packets | Discarded packets |
| A | 0 | 13564 | 3 |
| B | 0 | 22431 | 2 |
| C | 0 | 13716 | 2 |
| D | 0 | 14599 | 2 |
| Quadrant | Total seconds | Saturated seconds | Saturation percentage |
|---|---|---|---|
| A | 6468 | 81 | 1.252319% |
| B | 6468 | 1075 | 16.620284% |
| C | 6468 | 68 | 1.051330% |
| D | 6468 | 153 | 2.365492% |
Noise dominated data is calculated using 1-second bins in cleaned event files. If a bin has >2000 counts, and if more than 50% of those come from <1% of pixels, then it is considered to be noise-dominated and hence unusable.
| Quadrant | # 1 sec bins | Bins with >0 counts | Bins with >2000 counts | High rate bins dominated by noise | Noise dominated (total time) | Noise dominated (detector-on time) | Marked lightcurve |
|---|---|---|---|---|---|---|---|
| A | 7698 | 6469 | 1 | 1 | 0.01% | 0.02% | 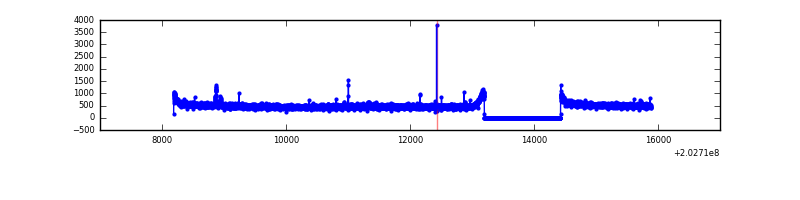 |
| B | 7698 | 6469 | 854 | 854 | 11.09% | 13.20% | 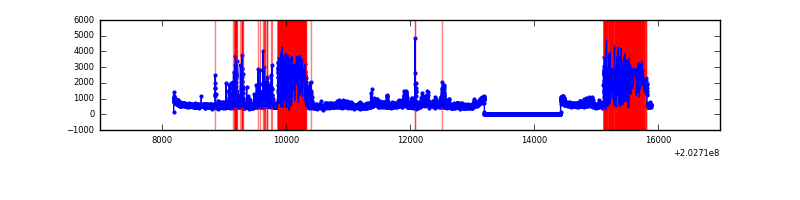 |
| C | 7698 | 6469 | 18 | 18 | 0.23% | 0.28% | 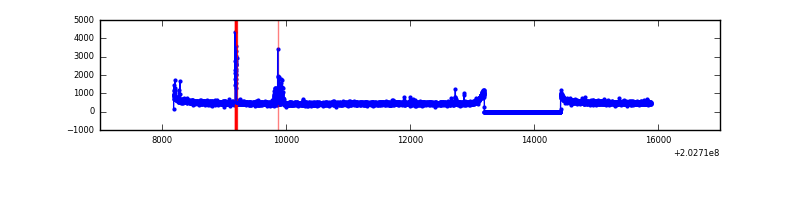 |
| D | 7698 | 6469 | 83 | 83 | 1.08% | 1.28% | 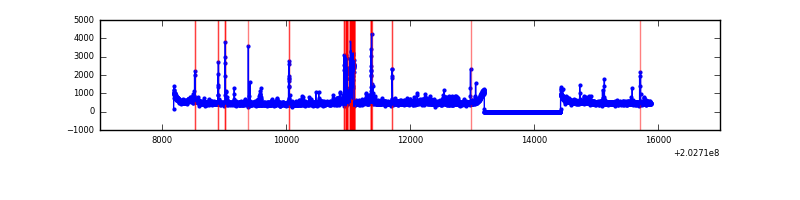 |
Top three noisy pixels from each quadrant. If the there are fewer than three noisy pixels in the level2.evt file, extra rows are filled as -1
| Pixel properties | Quadrant properties | ||||||
|---|---|---|---|---|---|---|---|
| Quadrant | DetID | PixID | Counts | Sigma | Mean | Median | Sigma |
| A | 13 | 251 | 17685 | 99.81 | 829 | 814 | 169.0 |
| A | 0 | 226 | 8991 | 48.37 | 829 | 814 | 169.0 |
| A | 12 | 194 | 8635 | 46.27 | 829 | 814 | 169.0 |
| B | 5 | 70 | 2505707 | 16986.97 | 773 | 758 | 147.5 |
| B | 14 | 167 | 265688 | 1796.59 | 773 | 758 | 147.5 |
| B | 15 | 204 | 209236 | 1413.77 | 773 | 758 | 147.5 |
| C | 8 | 208 | 48448 | 261.35 | 790 | 796 | 182.3 |
| C | 9 | 247 | 24729 | 131.26 | 790 | 796 | 182.3 |
| C | 7 | 239 | 23610 | 125.12 | 790 | 796 | 182.3 |
| D | 2 | 37 | 242029 | 1277.32 | 785 | 762 | 188.9 |
| D | 1 | 84 | 97799 | 513.73 | 785 | 762 | 188.9 |
| D | 13 | 137 | 48042 | 250.31 | 785 | 762 | 188.9 |
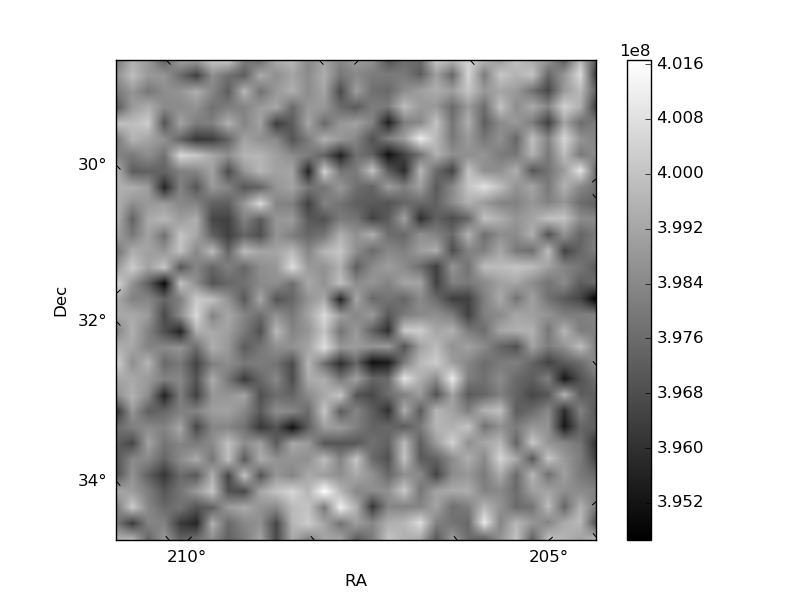
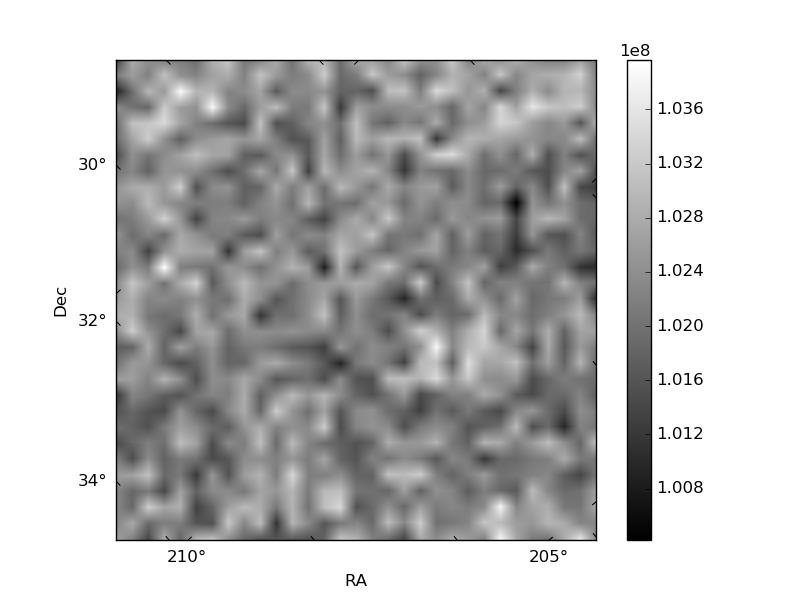
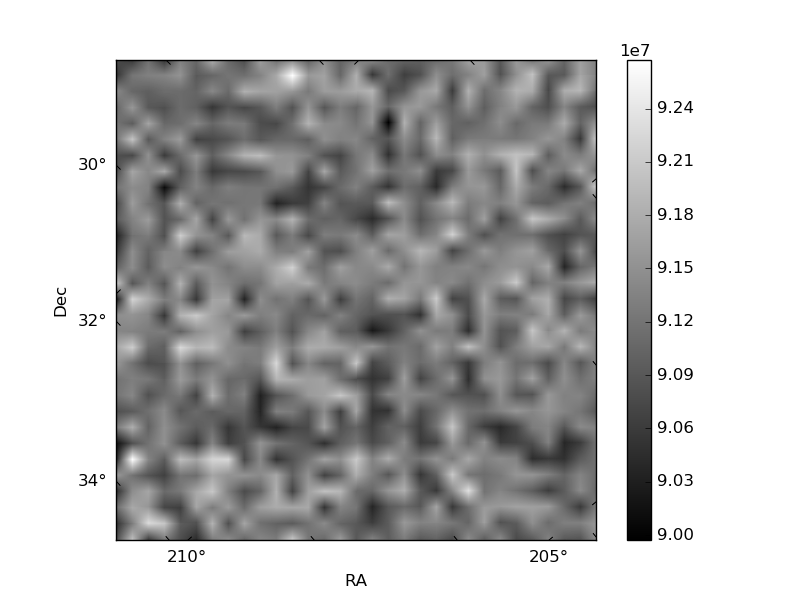
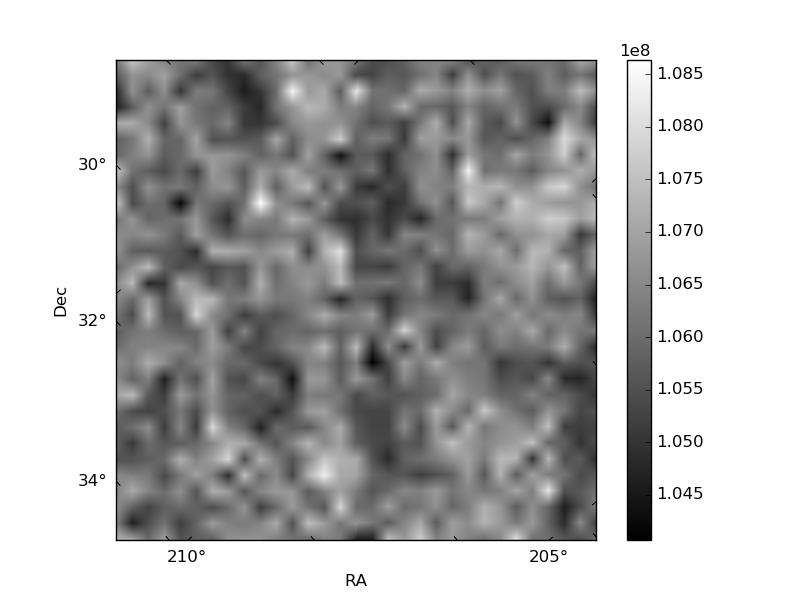
Histogram calculated using DETX and DETY for each event in the final _common_clean file
| Quadrant A | 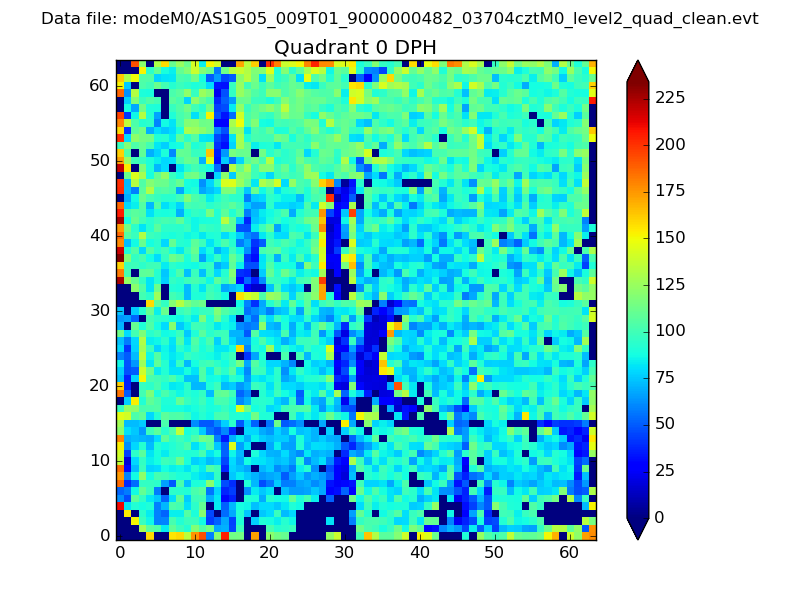 |
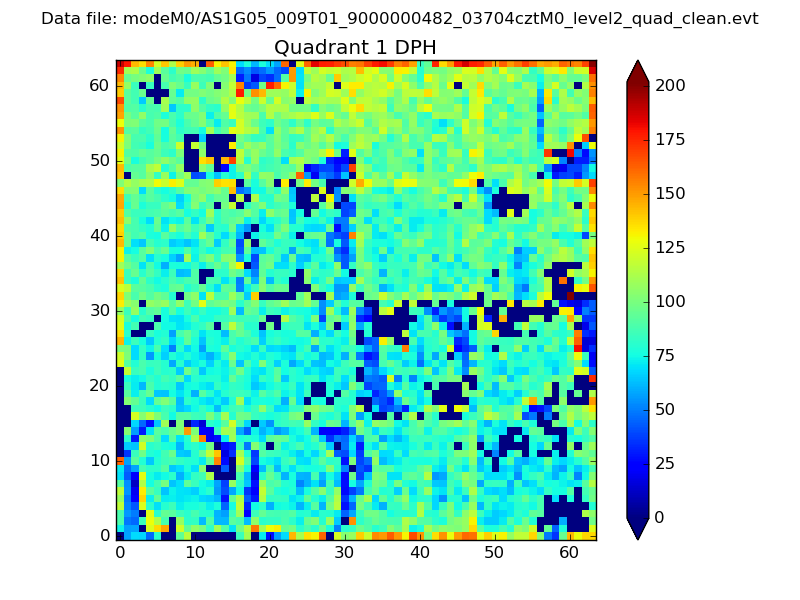 |
Quadrant B |
|---|---|---|---|
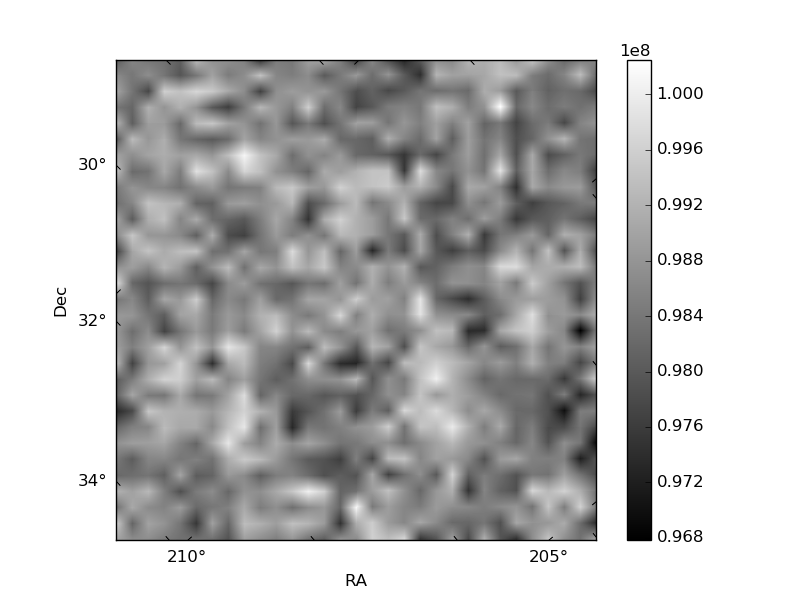
| Quadrant D | 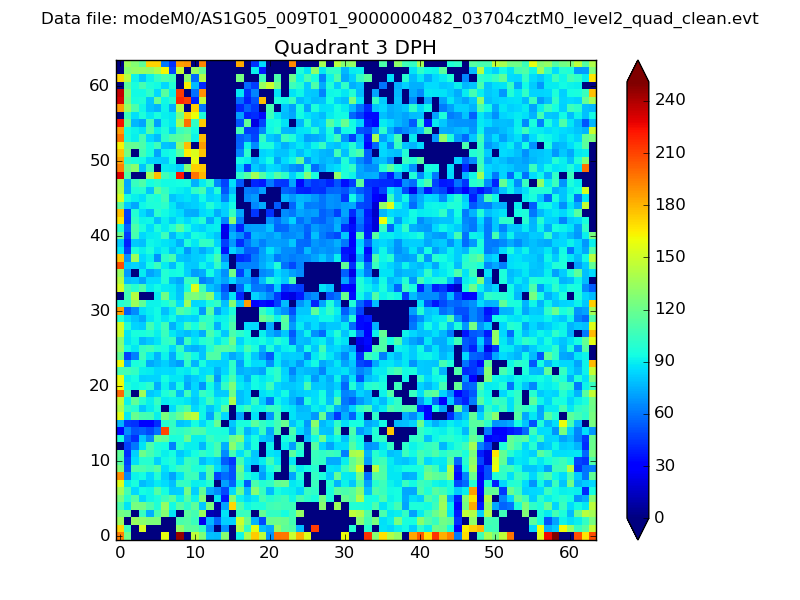 |
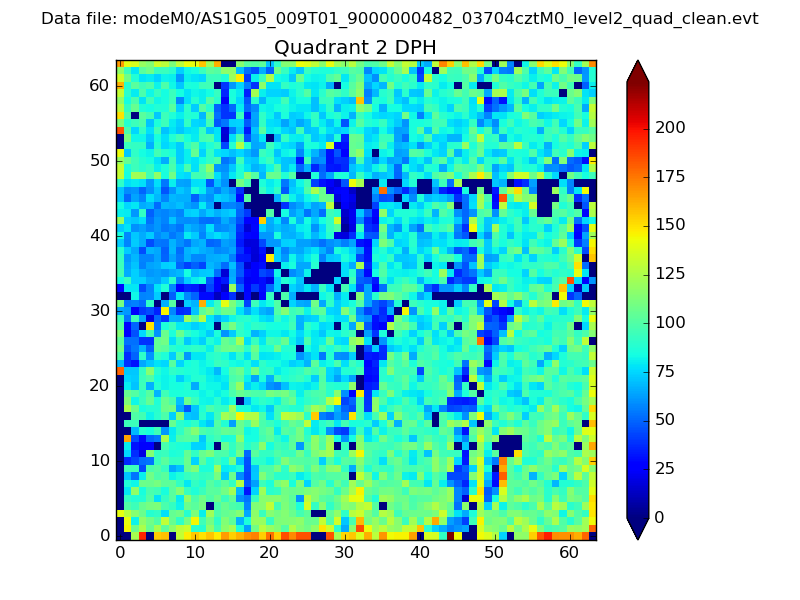 |
Quadrant C |
| Plot type | Count rate plots | Images |
|---|---|---|
| Comparison with Poisson distribution Blue bars denote a histogram of data divided into 1 sec bins. Red curve is a Poisson curve with rate = median count rate of data. |
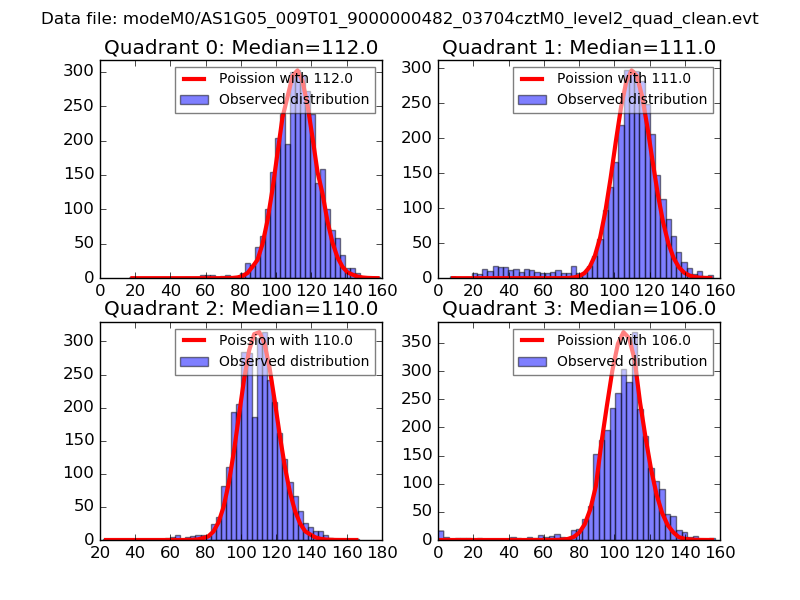 |
 |
| Quadrant-wise count rates Data is divided into 100 sec bins |
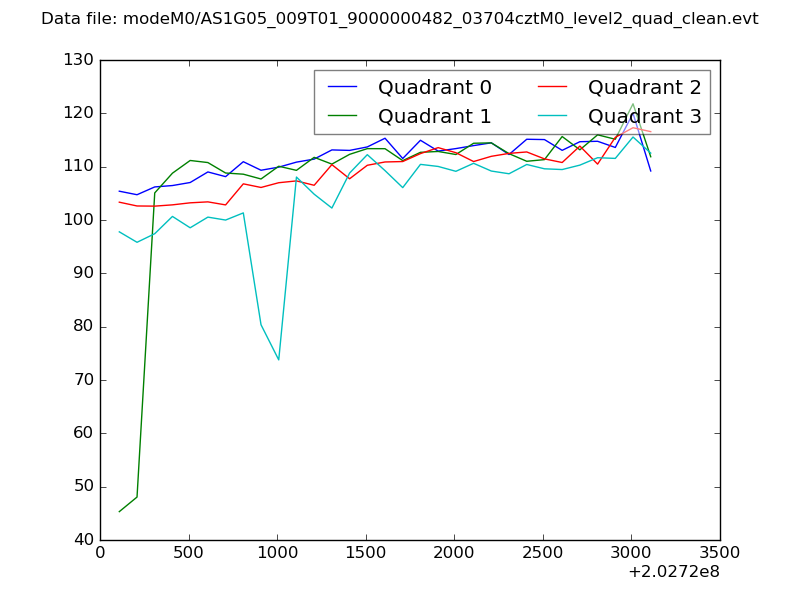 |
|
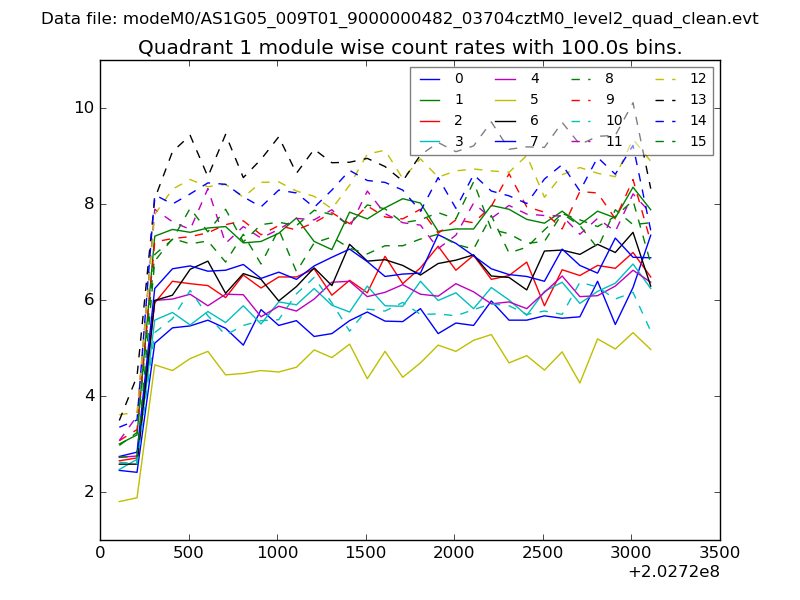
| Module-wise count rates for Quadrant A Data is divided into 100 sec bins |
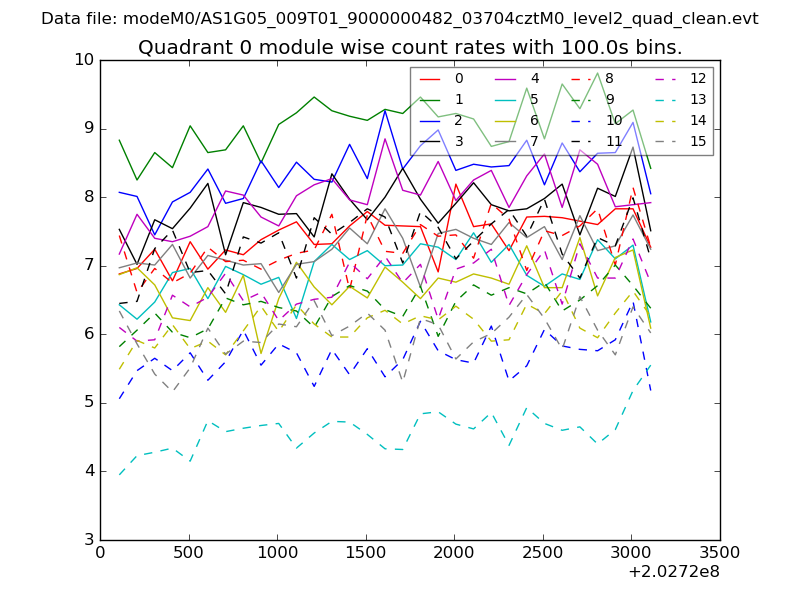 |
 |
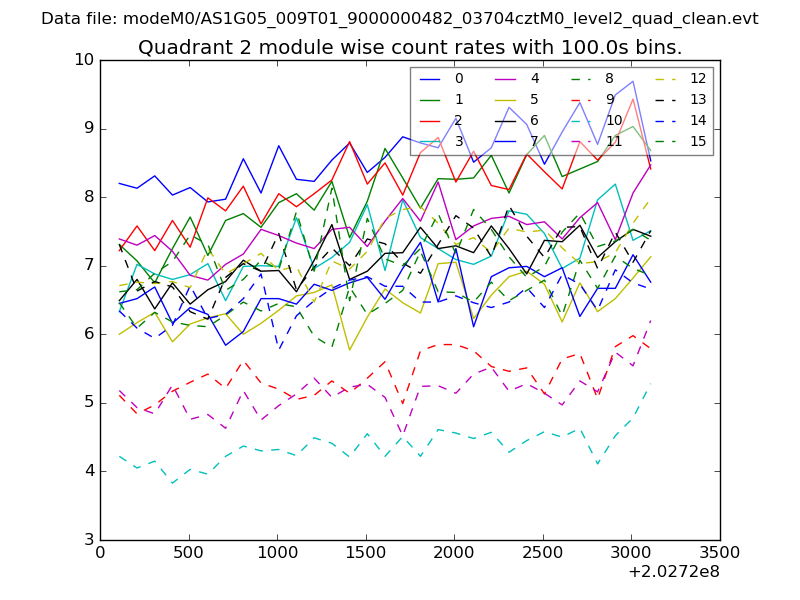
| Module-wise count rates for Quadrant B Data is divided into 100 sec bins |
 |
 |
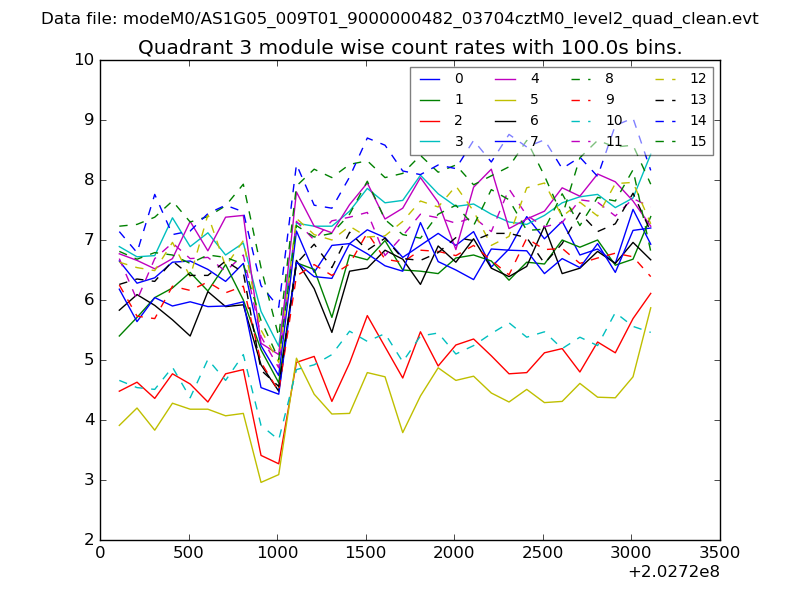
| Module-wise count rates for Quadrant C Data is divided into 100 sec bins |
 |
 |
| Module-wise count rates for Quadrant D Data is divided into 100 sec bins |
 |
 |
| Parameter | Plot |
|---|---|
| CZT HV Monitor | 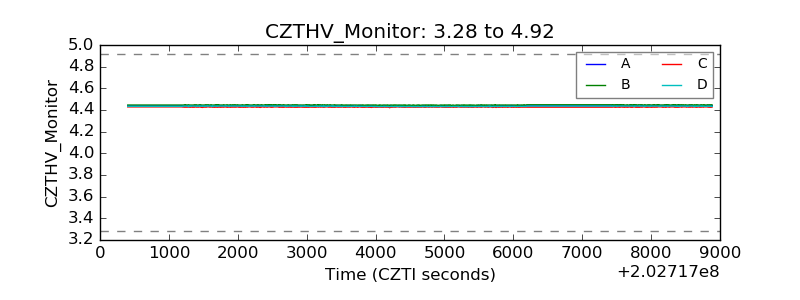 |
| D_VDD | 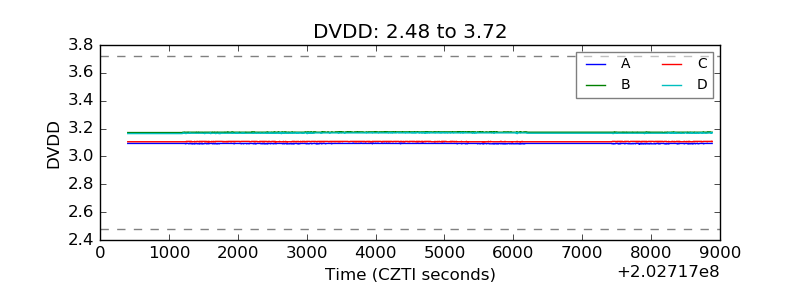 |
| Temperature 1 | 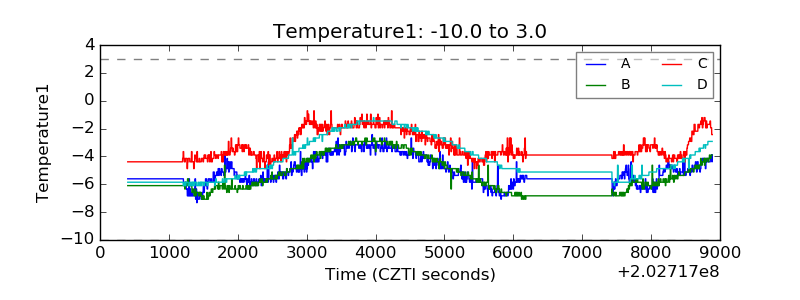 |
| Veto HV Monitor | 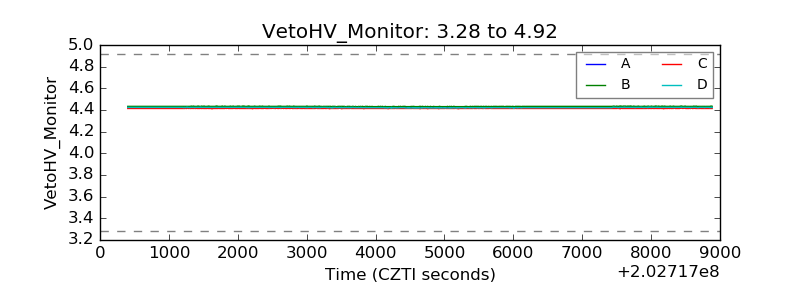 |
| Veto LLD | 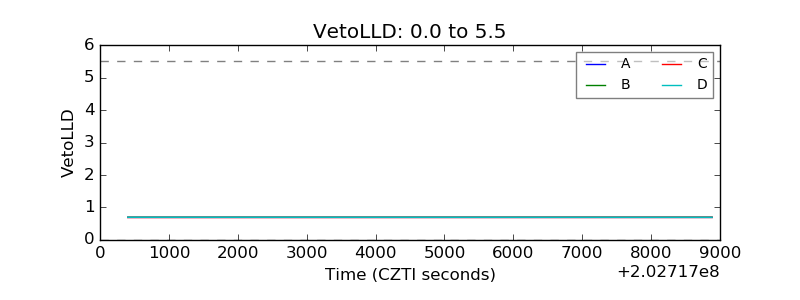 |
| Alpha Counter | 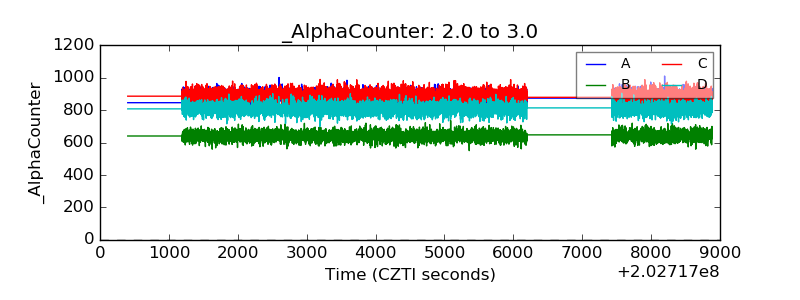 |
| _CPM_Rate | 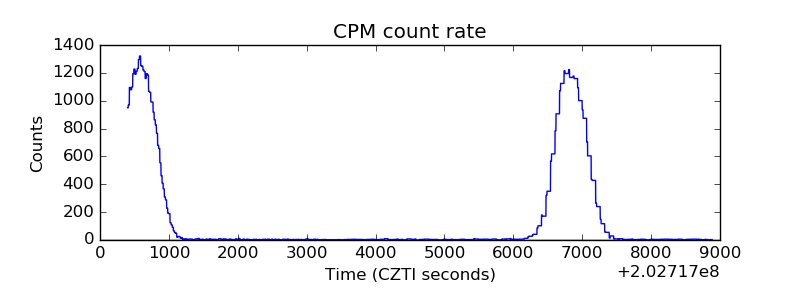 |
| CZT Counter | 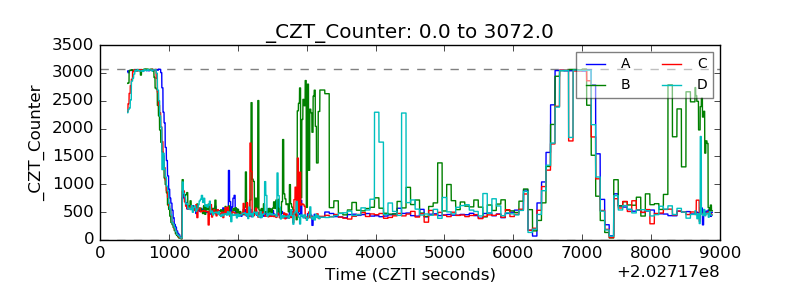 |
| +2.5 Volts monitor |  |
| +5 Volts monitor |  |
| Veto Counter | 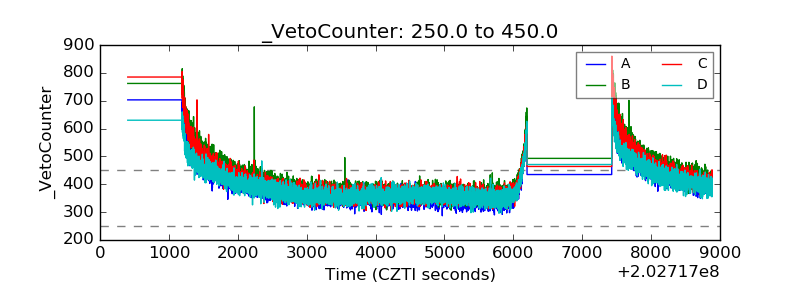 |