| Param | Original file | Final file |
|---|---|---|
| Filename | modeM0/AS1G05_009T01_9000000482_03705cztM0_level2.evt | modeM0/AS1G05_009T01_9000000482_03705cztM0_level2_quad_clean.evt |
| Size (bytes) | 584,354,880 | 69,514,560 |
| Size | 557.3 MB | 66.3 MB |
| Events in quadrant A | 3,336,645 | 427,298 |
| Events in quadrant B | 7,190,039 | 403,894 |
| Events in quadrant C | 3,139,099 | 420,913 |
| Events in quadrant D | 3,596,799 | 404,948 |
| Mode M9 | |||
|---|---|---|---|
| Quadrant | BADHDUFLAG | Total packets | Discarded packets |
| A | 0 | 18 | 0 |
| B | 0 | 18 | 1 |
| C | 0 | 18 | 1 |
| D | 0 | 19 | 1 |
| Mode SS | |||
|---|---|---|---|
| Quadrant | BADHDUFLAG | Total packets | Discarded packets |
| A | 0 | 130 | 0 |
| B | 0 | 130 | 0 |
| C | 0 | 130 | 0 |
| D | 0 | 130 | 0 |
| Mode M0 | |||
|---|---|---|---|
| Quadrant | BADHDUFLAG | Total packets | Discarded packets |
| A | 0 | 13785 | 3 |
| B | 0 | 25809 | 2 |
| C | 0 | 13374 | 2 |
| D | 0 | 14672 | 2 |
| Quadrant | Total seconds | Saturated seconds | Saturation percentage |
|---|---|---|---|
| A | 6414 | 153 | 2.385407% |
| B | 6414 | 1227 | 19.130028% |
| C | 6414 | 104 | 1.621453% |
| D | 6414 | 156 | 2.432180% |
Noise dominated data is calculated using 1-second bins in cleaned event files. If a bin has >2000 counts, and if more than 50% of those come from <1% of pixels, then it is considered to be noise-dominated and hence unusable.
| Quadrant | # 1 sec bins | Bins with >0 counts | Bins with >2000 counts | High rate bins dominated by noise | Noise dominated (total time) | Noise dominated (detector-on time) | Marked lightcurve |
|---|---|---|---|---|---|---|---|
| A | 7634 | 6414 | 12 | 12 | 0.16% | 0.19% | 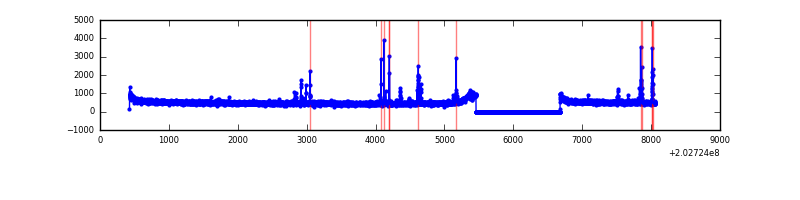 |
| B | 7633 | 6413 | 887 | 887 | 11.62% | 13.83% | 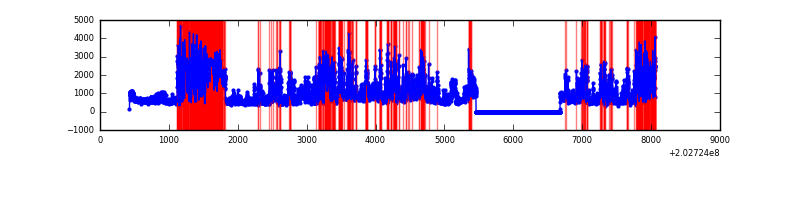 |
| C | 7634 | 6414 | 0 | 0 | 0.00% | 0.00% | 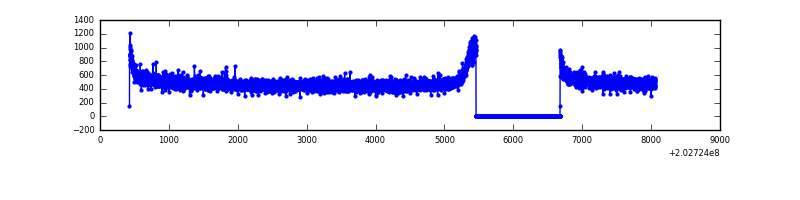 |
| D | 7634 | 6415 | 45 | 45 | 0.59% | 0.70% | 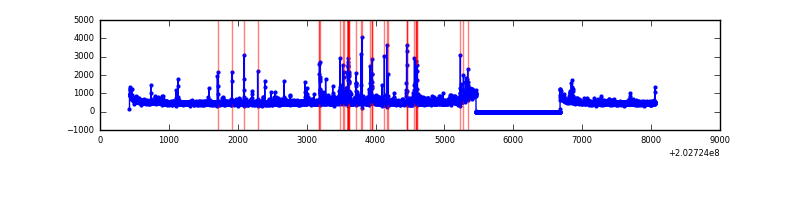 |
Top three noisy pixels from each quadrant. If the there are fewer than three noisy pixels in the level2.evt file, extra rows are filled as -1
| Pixel properties | Quadrant properties | ||||||
|---|---|---|---|---|---|---|---|
| Quadrant | DetID | PixID | Counts | Sigma | Mean | Median | Sigma |
| A | 0 | 50 | 82579 | 479.27 | 836 | 819 | 170.6 |
| A | 15 | 174 | 18827 | 105.56 | 836 | 819 | 170.6 |
| A | 0 | 226 | 9115 | 48.63 | 836 | 819 | 170.6 |
| B | 14 | 167 | 2011997 | 13509.18 | 779 | 764 | 148.9 |
| B | 5 | 70 | 1427421 | 9582.66 | 779 | 764 | 148.9 |
| B | 3 | 0 | 546246 | 3663.93 | 779 | 764 | 148.9 |
| C | 13 | 61 | 6834 | 32.22 | 800 | 805 | 187.1 |
| C | 2 | 53 | 3947 | 16.79 | 800 | 805 | 187.1 |
| C | 14 | 67 | 3360 | 13.66 | 800 | 805 | 187.1 |
| D | 1 | 84 | 117246 | 602.58 | 799 | 775 | 193.3 |
| D | 2 | 37 | 109270 | 561.31 | 799 | 775 | 193.3 |
| D | 5 | 233 | 69726 | 356.73 | 799 | 775 | 193.3 |
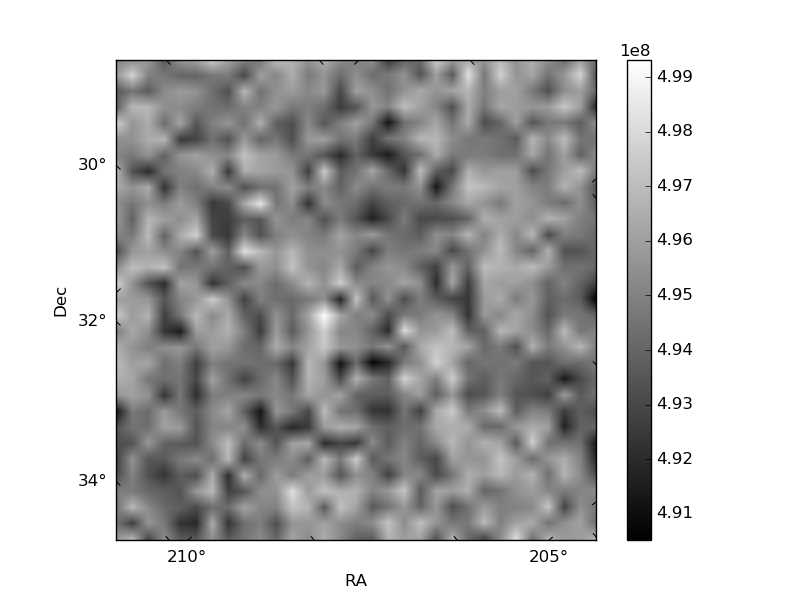
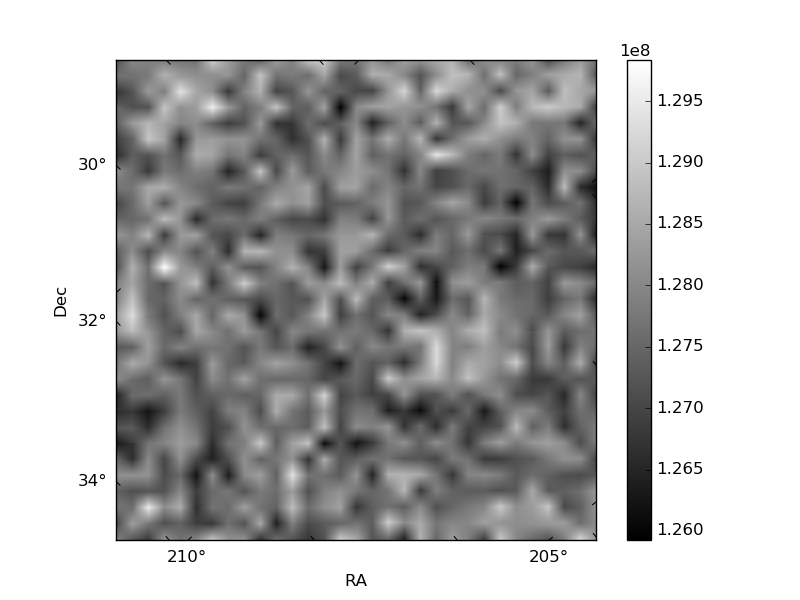
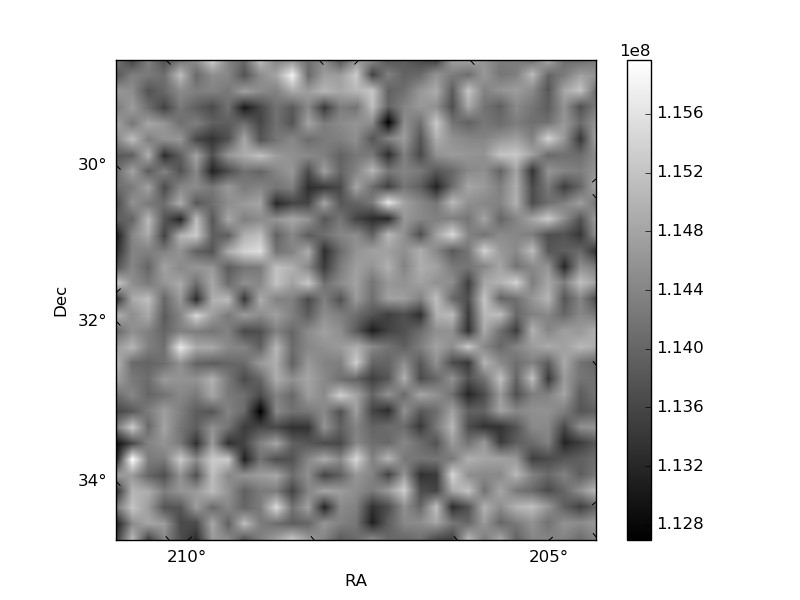
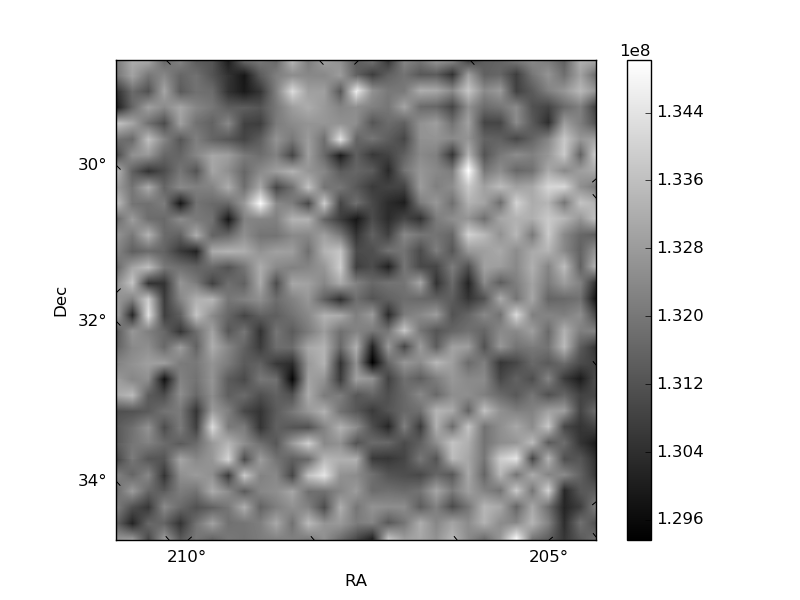
Histogram calculated using DETX and DETY for each event in the final _common_clean file
| Quadrant A | 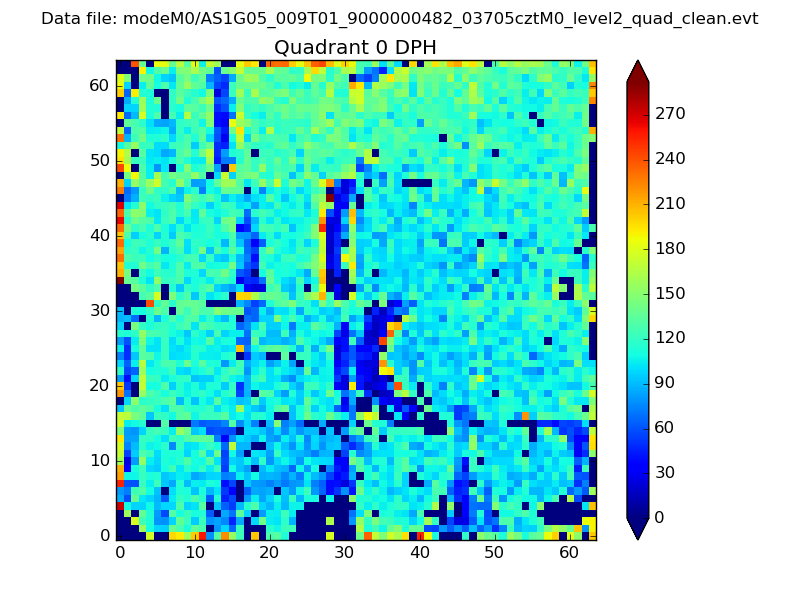 |
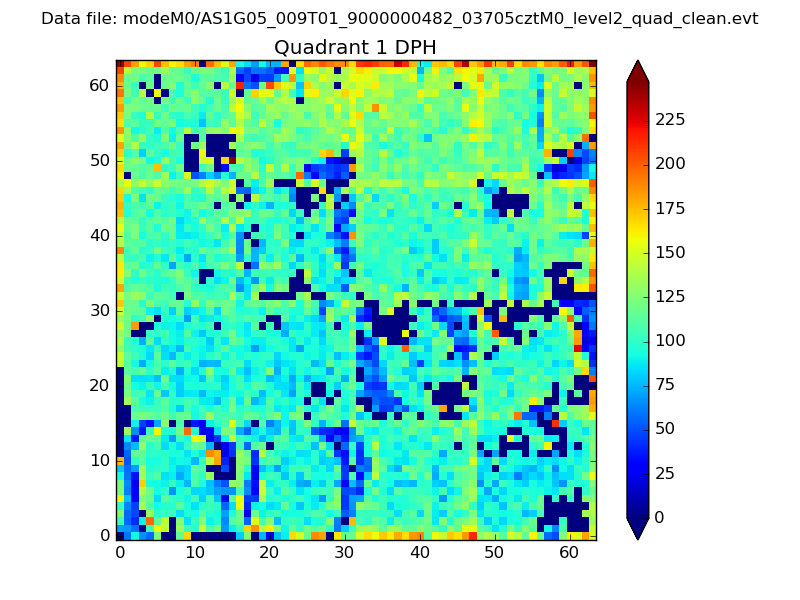 |
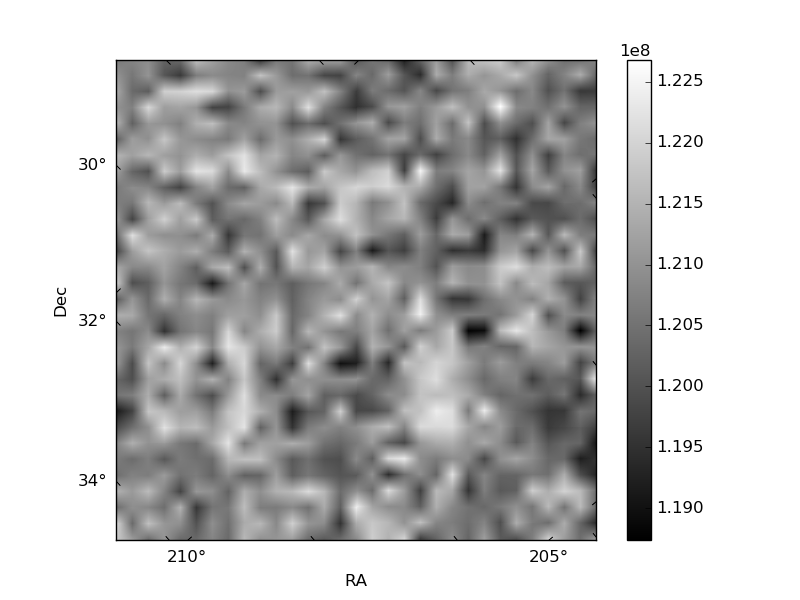
Quadrant B |
|---|---|---|---|
| Quadrant D | 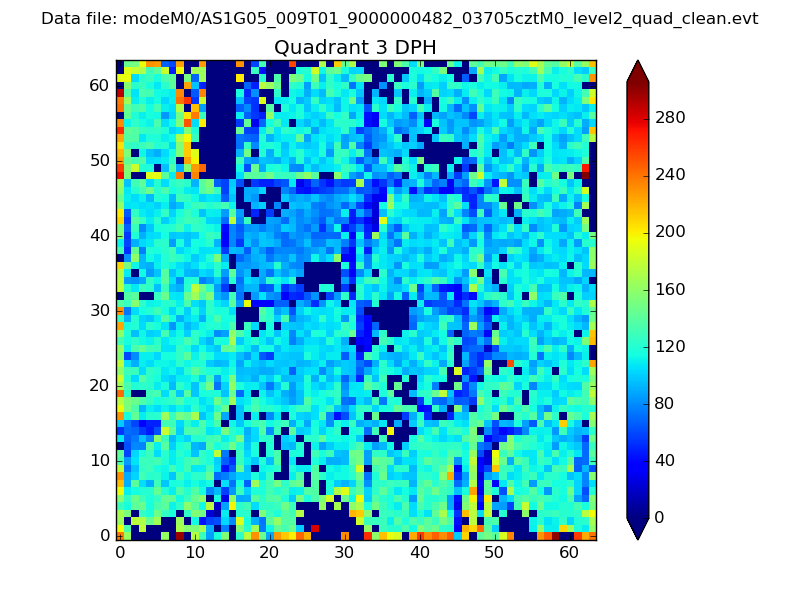 |
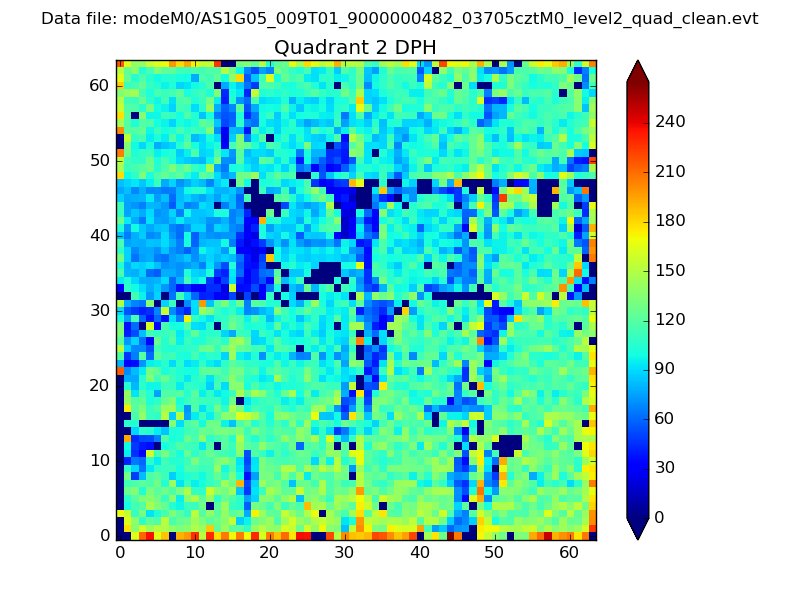 |
Quadrant C |
| Plot type | Count rate plots | Images |
|---|---|---|
| Comparison with Poisson distribution Blue bars denote a histogram of data divided into 1 sec bins. Red curve is a Poisson curve with rate = median count rate of data. |
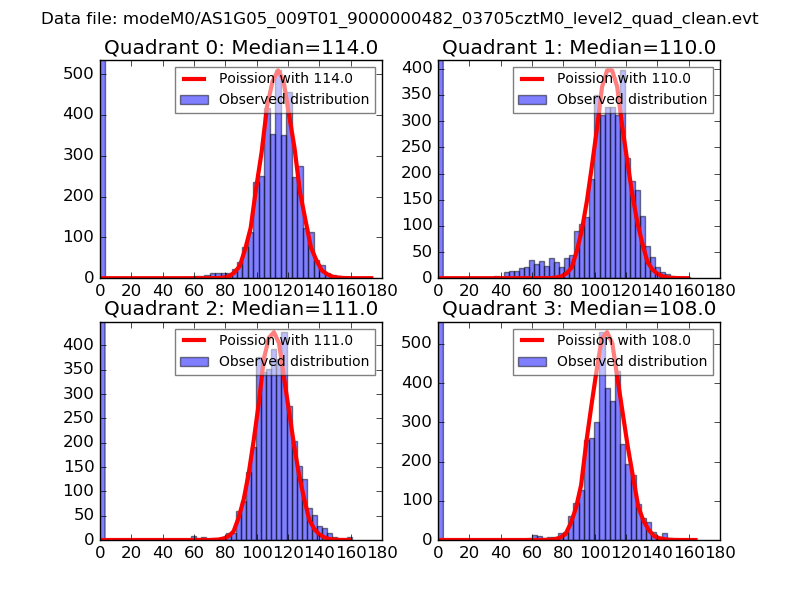 |
 |
| Quadrant-wise count rates Data is divided into 100 sec bins |
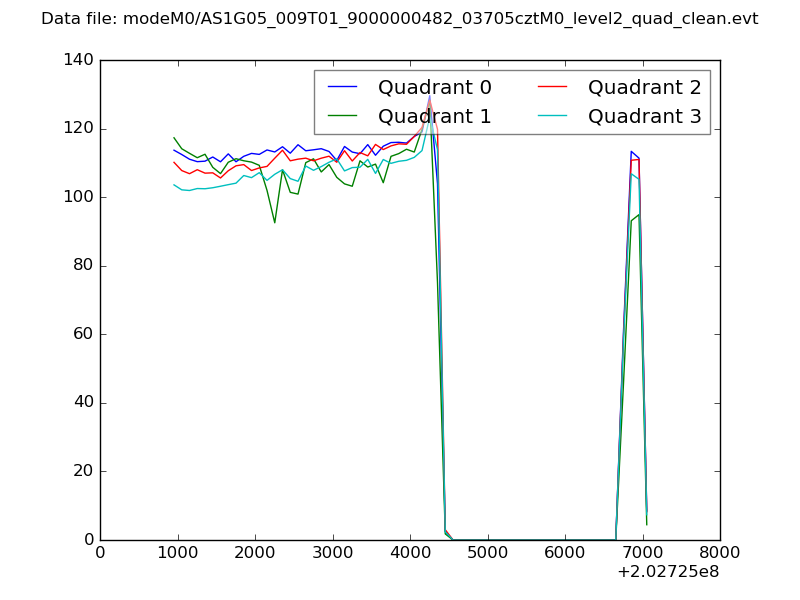 |
|
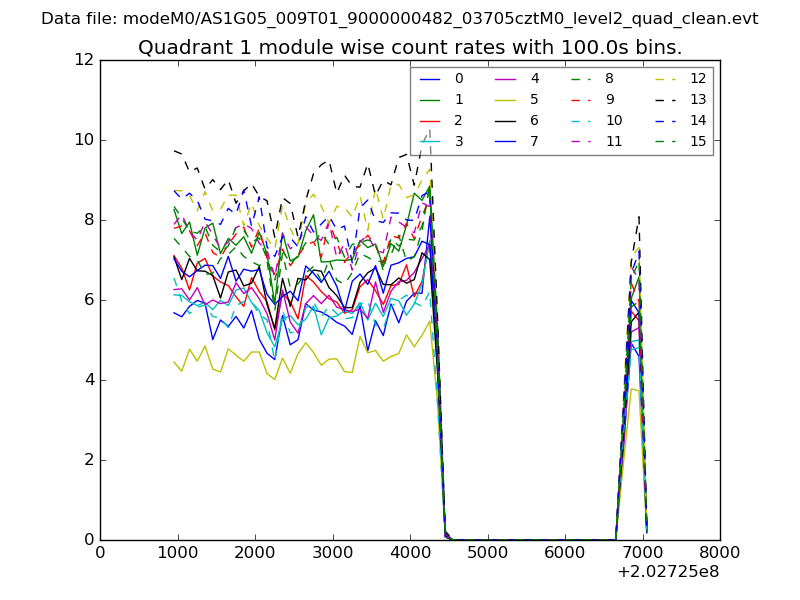
| Module-wise count rates for Quadrant A Data is divided into 100 sec bins |
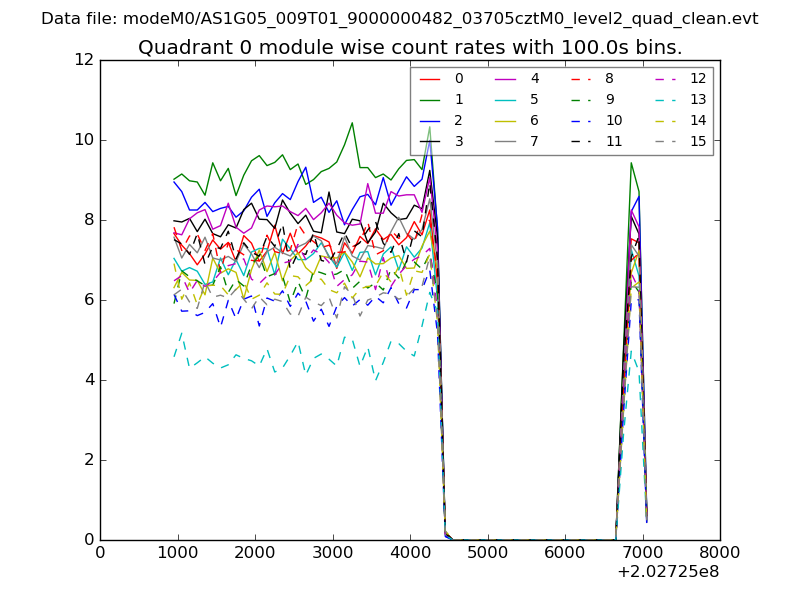 |
 |
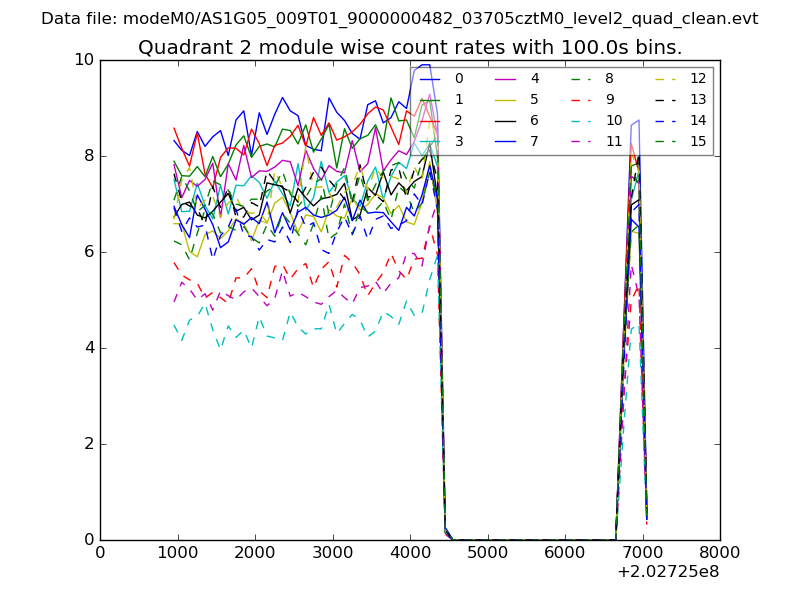
| Module-wise count rates for Quadrant B Data is divided into 100 sec bins |
 |
 |
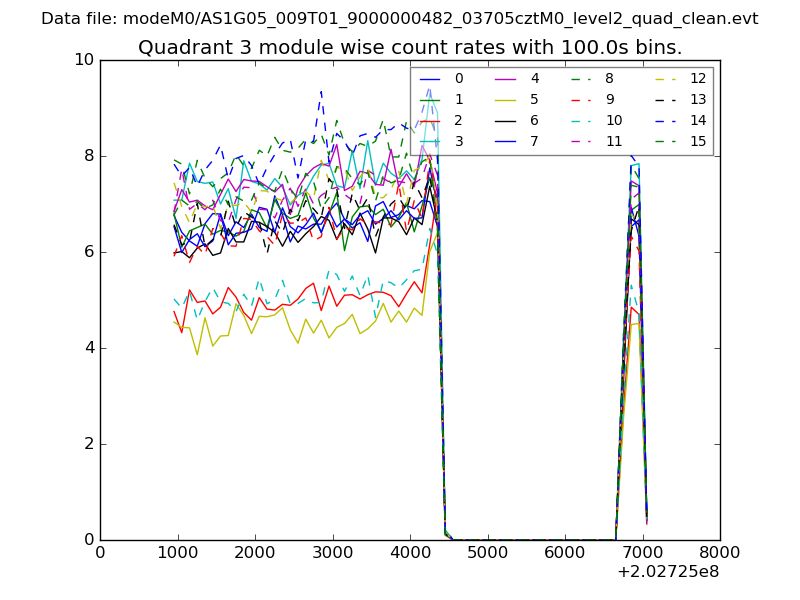
| Module-wise count rates for Quadrant C Data is divided into 100 sec bins |
 |
 |
| Module-wise count rates for Quadrant D Data is divided into 100 sec bins |
 |
 |
| Parameter | Plot |
|---|---|
| CZT HV Monitor | 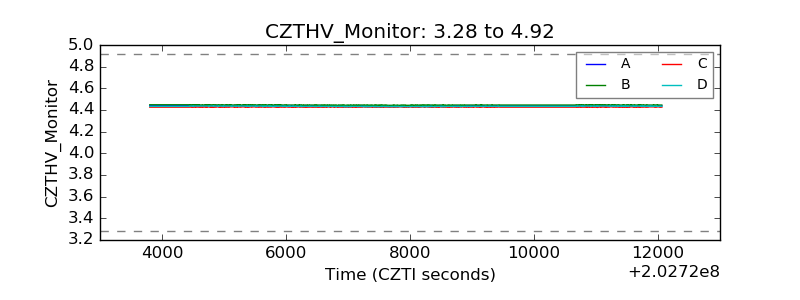 |
| D_VDD | 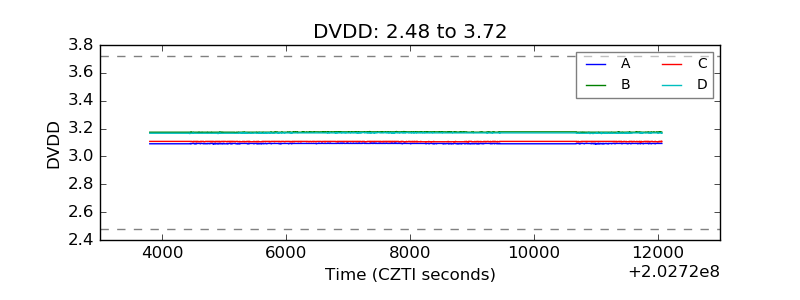 |
| Temperature 1 | 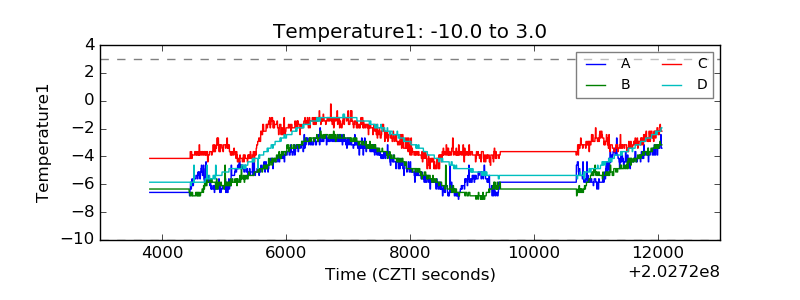 |
| Veto HV Monitor | 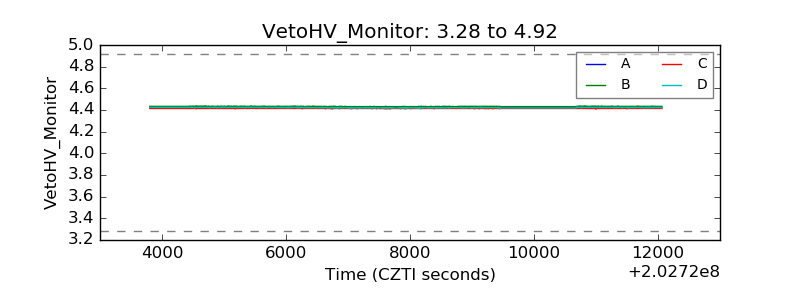 |
| Veto LLD | 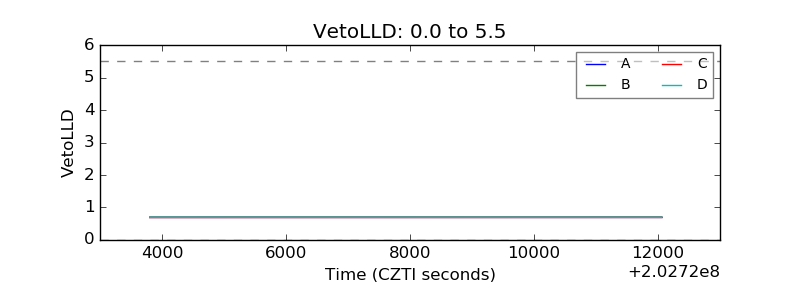 |
| Alpha Counter | 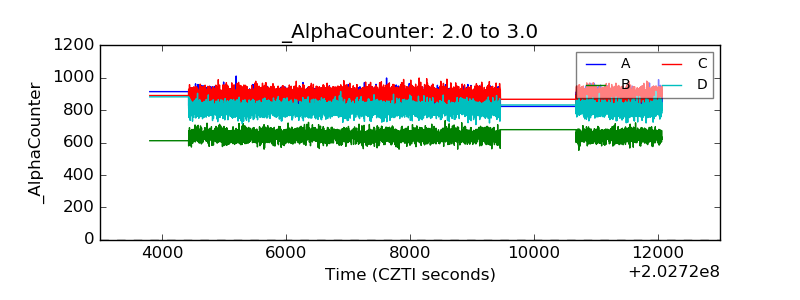 |
| _CPM_Rate | 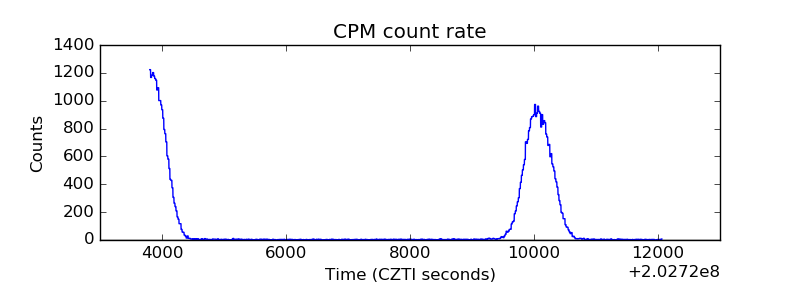 |
| CZT Counter | 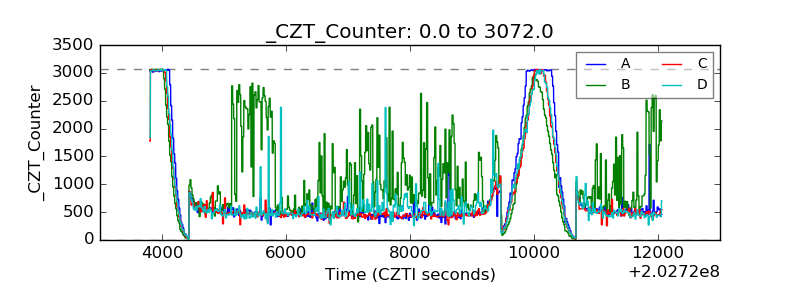 |
| +2.5 Volts monitor |  |
| +5 Volts monitor |  |
| Veto Counter | 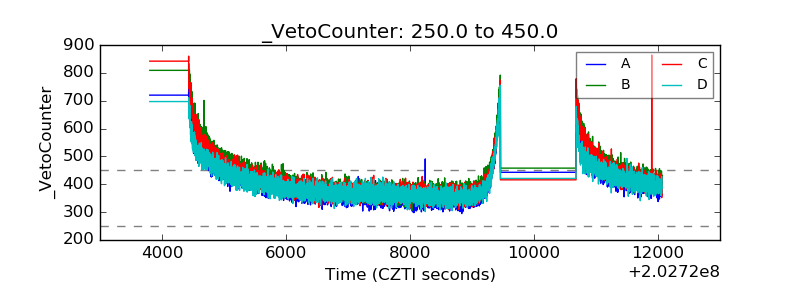 |