| Param | Original file | Final file |
|---|---|---|
| Filename | modeM0/AS1G05_009T01_9000000482_03706cztM0_level2.evt | modeM0/AS1G05_009T01_9000000482_03706cztM0_level2_quad_clean.evt |
| Size (bytes) | 533,799,360 | 81,576,000 |
| Size | 509.1 MB | 77.8 MB |
| Events in quadrant A | 3,449,048 | 515,051 |
| Events in quadrant B | 5,467,279 | 494,335 |
| Events in quadrant C | 3,219,361 | 505,367 |
| Events in quadrant D | 3,575,179 | 487,506 |
| Mode M9 | |||
|---|---|---|---|
| Quadrant | BADHDUFLAG | Total packets | Discarded packets |
| A | 0 | 17 | 0 |
| B | 0 | 17 | 0 |
| C | 0 | 17 | 0 |
| D | 0 | 18 | 0 |
| Mode SS | |||
|---|---|---|---|
| Quadrant | BADHDUFLAG | Total packets | Discarded packets |
| A | 0 | 136 | 0 |
| B | 0 | 136 | 0 |
| C | 0 | 136 | 0 |
| D | 0 | 136 | 0 |
| Mode M0 | |||
|---|---|---|---|
| Quadrant | BADHDUFLAG | Total packets | Discarded packets |
| A | 0 | 14418 | 3 |
| B | 0 | 20629 | 2 |
| C | 0 | 13911 | 2 |
| D | 0 | 15016 | 2 |
| Quadrant | Total seconds | Saturated seconds | Saturation percentage |
|---|---|---|---|
| A | 6711 | 153 | 2.279839% |
| B | 6711 | 640 | 9.536582% |
| C | 6711 | 100 | 1.490091% |
| D | 6711 | 130 | 1.937118% |
Noise dominated data is calculated using 1-second bins in cleaned event files. If a bin has >2000 counts, and if more than 50% of those come from <1% of pixels, then it is considered to be noise-dominated and hence unusable.
| Quadrant | # 1 sec bins | Bins with >0 counts | Bins with >2000 counts | High rate bins dominated by noise | Noise dominated (total time) | Noise dominated (detector-on time) | Marked lightcurve |
|---|---|---|---|---|---|---|---|
| A | 7911 | 6711 | 20 | 20 | 0.25% | 0.30% | 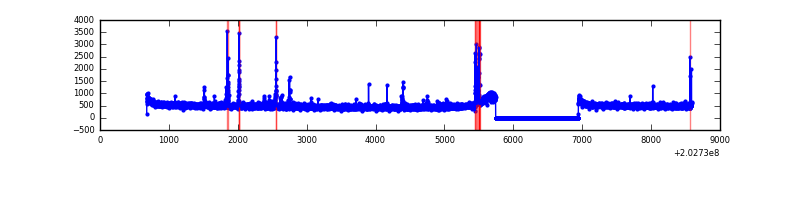 |
| B | 7911 | 6712 | 384 | 384 | 4.85% | 5.72% | 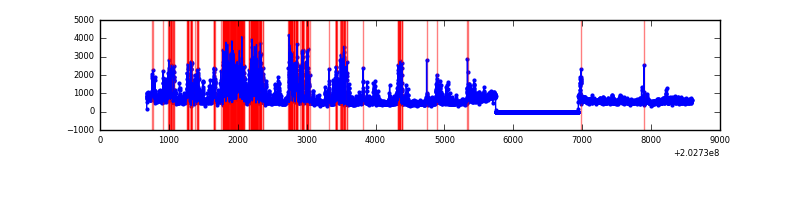 |
| C | 7911 | 6712 | 0 | 0 | 0.00% | 0.00% | 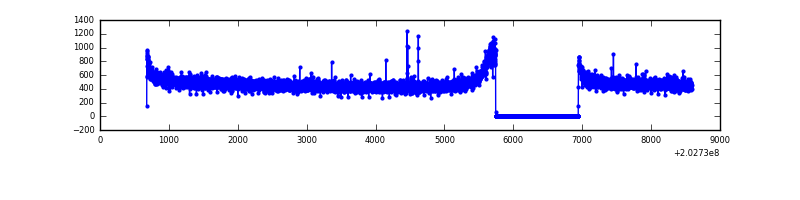 |
| D | 7911 | 6711 | 35 | 35 | 0.44% | 0.52% | 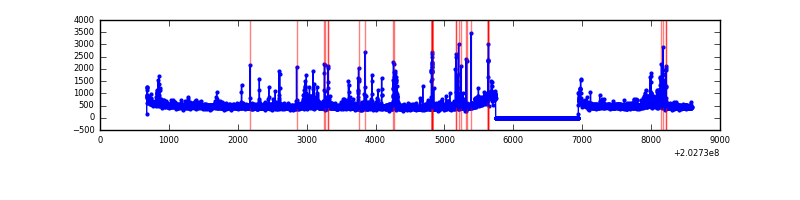 |
Top three noisy pixels from each quadrant. If the there are fewer than three noisy pixels in the level2.evt file, extra rows are filled as -1
| Pixel properties | Quadrant properties | ||||||
|---|---|---|---|---|---|---|---|
| Quadrant | DetID | PixID | Counts | Sigma | Mean | Median | Sigma |
| A | 0 | 50 | 73683 | 416.11 | 853 | 835 | 175.1 |
| A | 15 | 174 | 70625 | 398.64 | 853 | 835 | 175.1 |
| A | 0 | 226 | 9622 | 50.19 | 853 | 835 | 175.1 |
| B | 14 | 167 | 1843957 | 11455.55 | 836 | 816 | 160.9 |
| B | 15 | 204 | 169508 | 1048.46 | 836 | 816 | 160.9 |
| B | 3 | 0 | 130997 | 809.11 | 836 | 816 | 160.9 |
| C | 13 | 61 | 7050 | 32.49 | 820 | 822 | 191.7 |
| C | 9 | 247 | 4635 | 19.89 | 820 | 822 | 191.7 |
| C | 14 | 67 | 4426 | 18.8 | 820 | 822 | 191.7 |
| D | 2 | 37 | 238593 | 1202.75 | 819 | 797 | 197.7 |
| D | 13 | 137 | 54262 | 270.42 | 819 | 797 | 197.7 |
| D | 1 | 20 | 46634 | 231.84 | 819 | 797 | 197.7 |
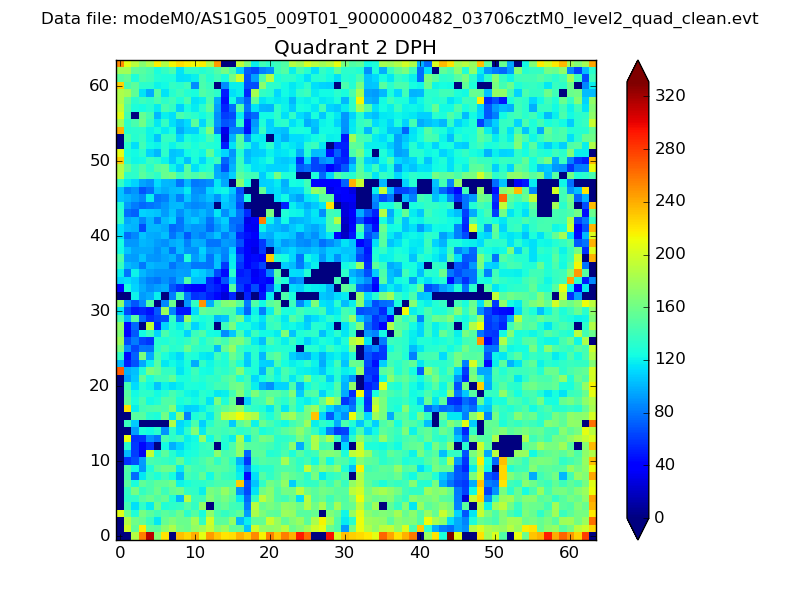
Histogram calculated using DETX and DETY for each event in the final _common_clean file
| Quadrant A | 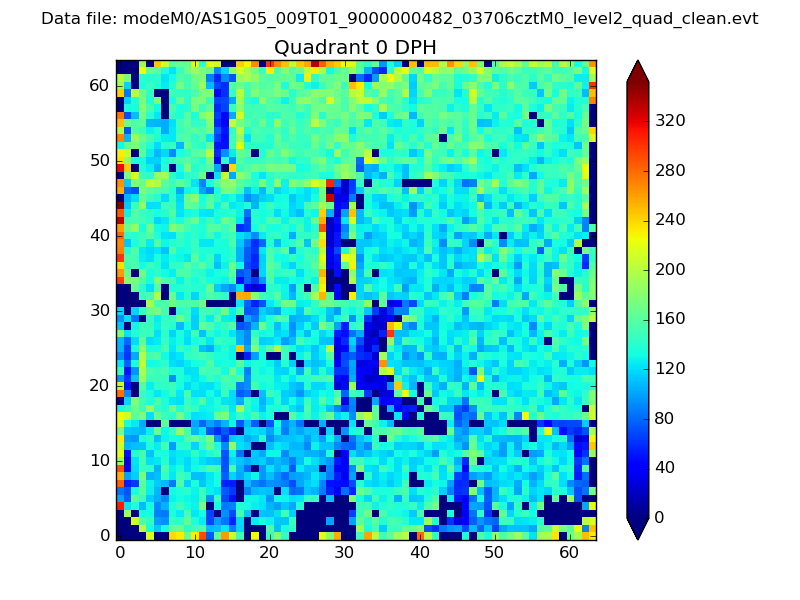 |
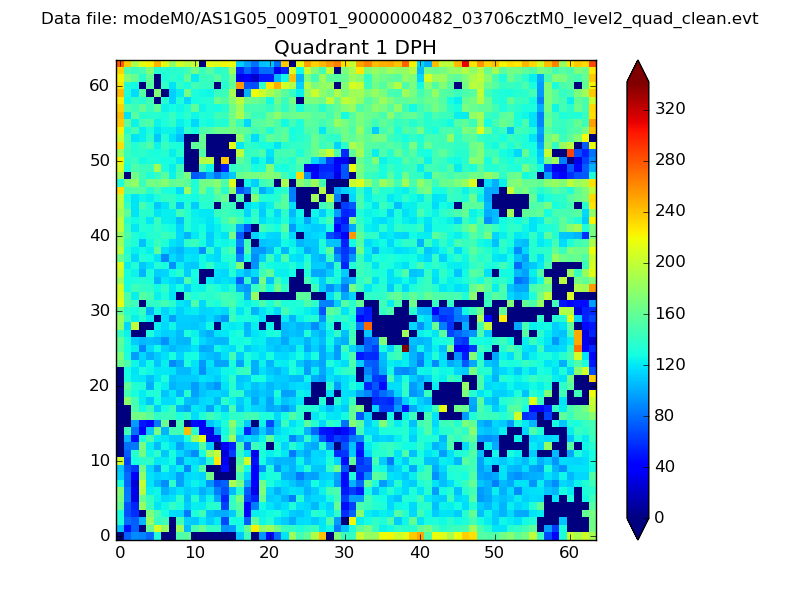 |
Quadrant B |
|---|---|---|---|
| Quadrant D | 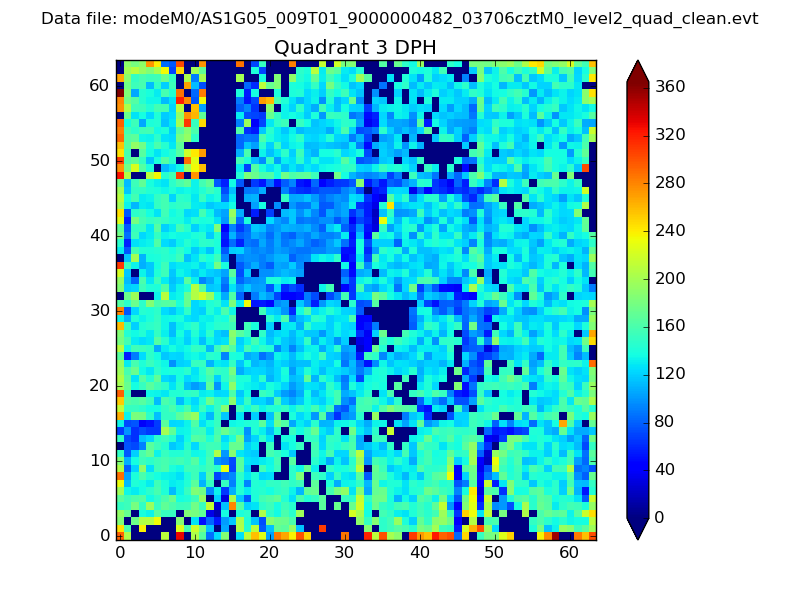 |
 |
Quadrant C |
| Plot type | Count rate plots | Images |
|---|---|---|
| Comparison with Poisson distribution Blue bars denote a histogram of data divided into 1 sec bins. Red curve is a Poisson curve with rate = median count rate of data. |
 |
 |
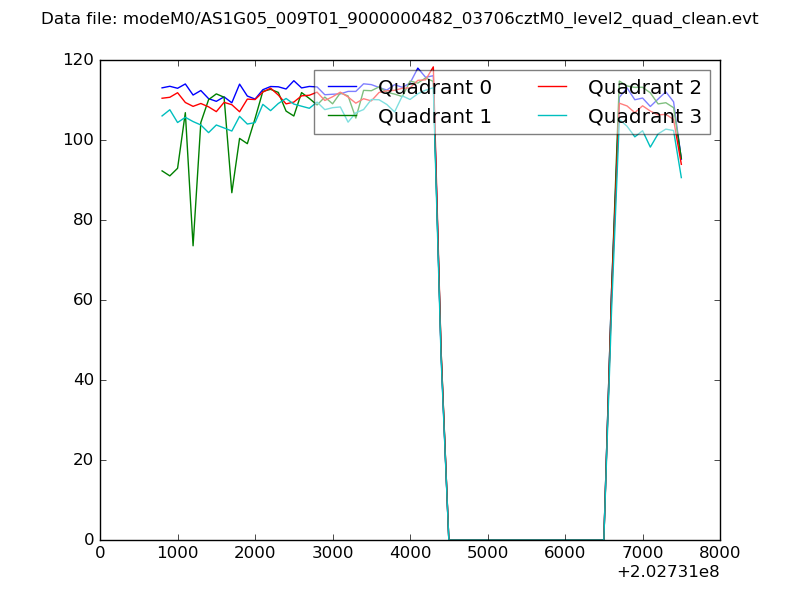
| Quadrant-wise count rates Data is divided into 100 sec bins |
 |
|
| Module-wise count rates for Quadrant A Data is divided into 100 sec bins |
 |
 |
| Module-wise count rates for Quadrant B Data is divided into 100 sec bins |
 |
 |
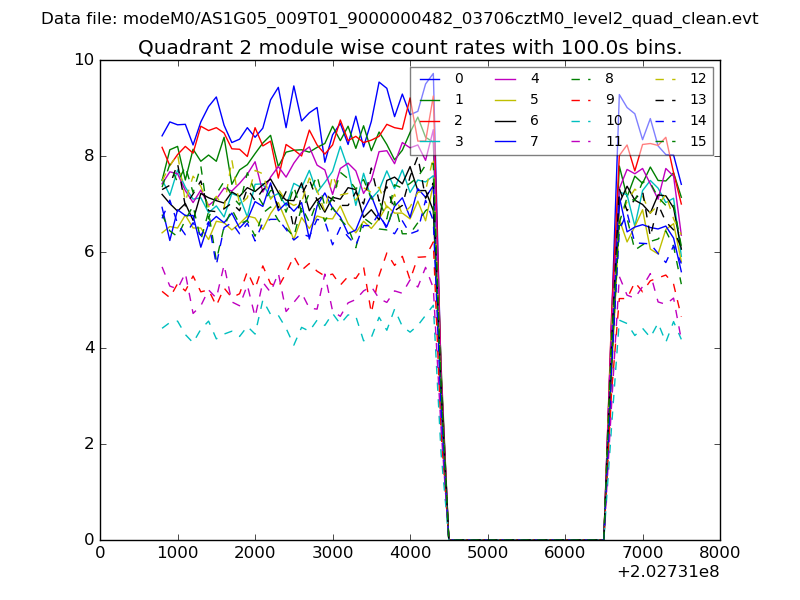
| Module-wise count rates for Quadrant C Data is divided into 100 sec bins |
 |
 |
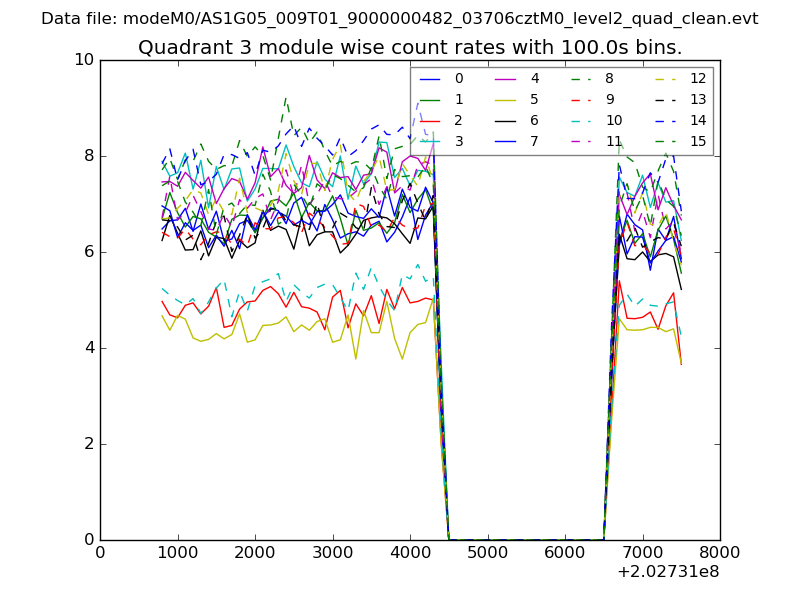
| Module-wise count rates for Quadrant D Data is divided into 100 sec bins |
 |
 |
| Parameter | Plot |
|---|---|
| CZT HV Monitor | 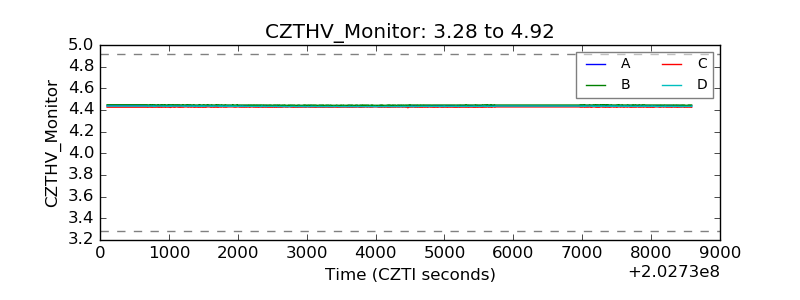 |
| D_VDD | 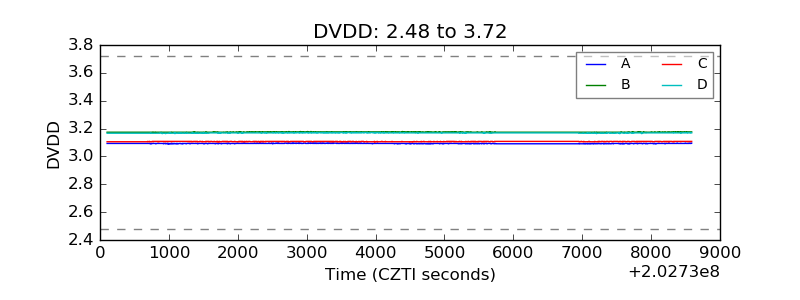 |
| Temperature 1 | 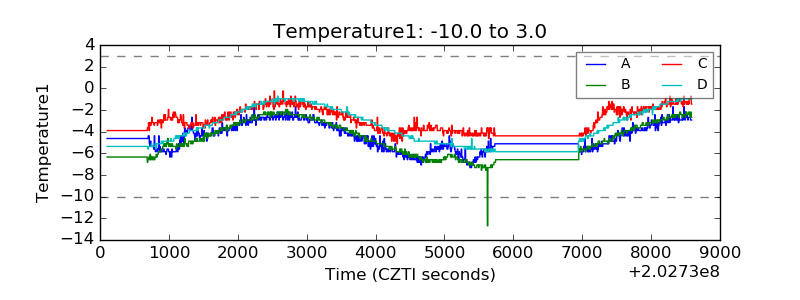 |
| Veto HV Monitor | 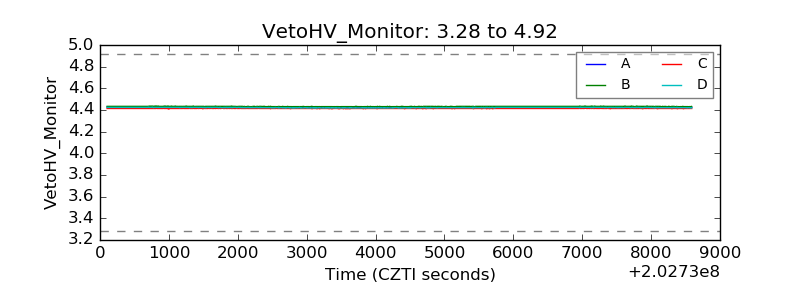 |
| Veto LLD | 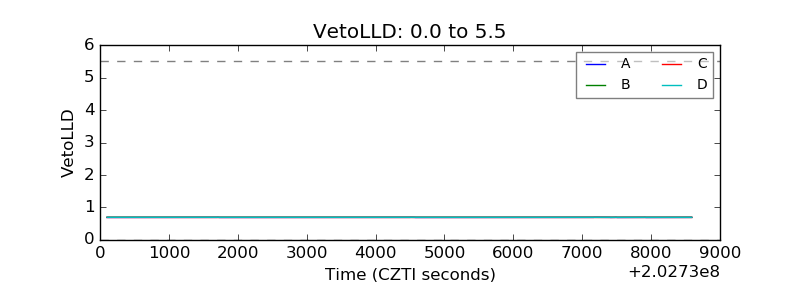 |
| Alpha Counter | 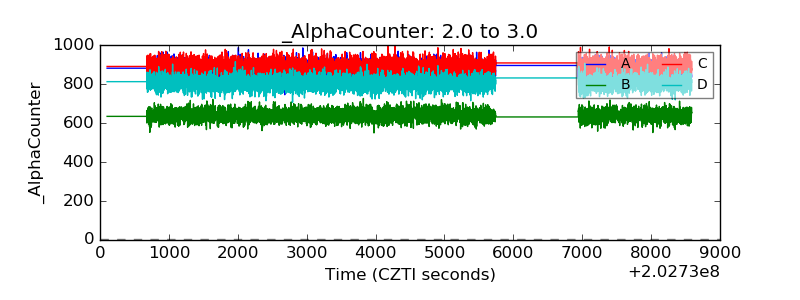 |
| _CPM_Rate | 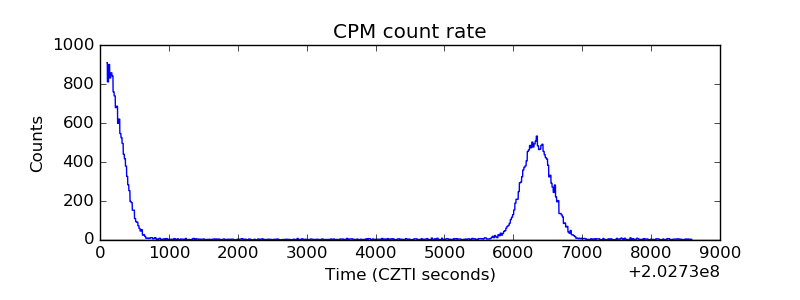 |
| CZT Counter | 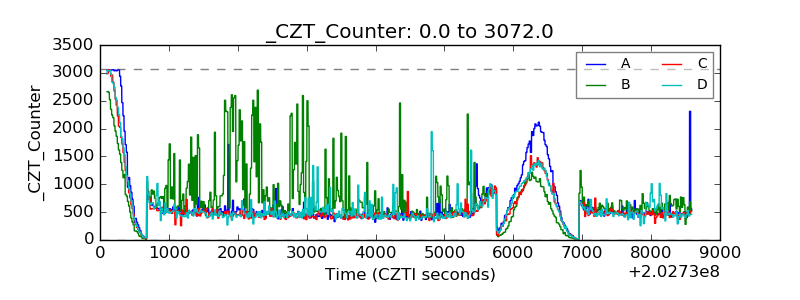 |
| +2.5 Volts monitor |  |
| +5 Volts monitor |  |
| Veto Counter | 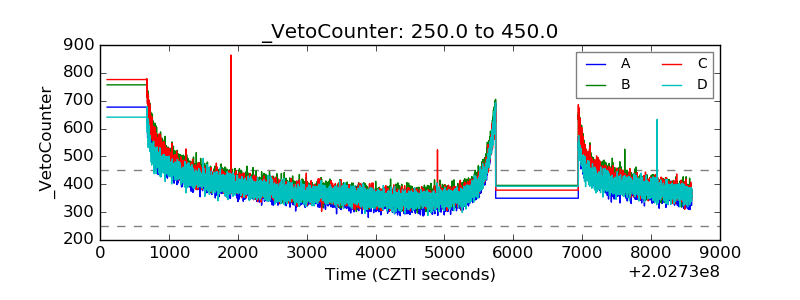 |