| Param | Original file | Final file |
|---|---|---|
| Filename | modeM0/AS1G05_009T01_9000000482_03707cztM0_level2.evt | modeM0/AS1G05_009T01_9000000482_03707cztM0_level2_quad_clean.evt |
| Size (bytes) | 455,204,160 | 82,840,320 |
| Size | 434.1 MB | 79.0 MB |
| Events in quadrant A | 3,021,349 | 528,872 |
| Events in quadrant B | 4,362,051 | 524,127 |
| Events in quadrant C | 2,815,577 | 523,205 |
| Events in quadrant D | 3,172,147 | 506,045 |
| Mode M9 | |||
|---|---|---|---|
| Quadrant | BADHDUFLAG | Total packets | Discarded packets |
| A | 0 | 10 | 0 |
| B | 0 | 10 | 0 |
| C | 0 | 10 | 0 |
| D | 0 | 10 | 0 |
| Mode SS | |||
|---|---|---|---|
| Quadrant | BADHDUFLAG | Total packets | Discarded packets |
| A | 0 | 124 | 0 |
| B | 0 | 124 | 0 |
| C | 0 | 124 | 0 |
| D | 0 | 124 | 0 |
| Mode M0 | |||
|---|---|---|---|
| Quadrant | BADHDUFLAG | Total packets | Discarded packets |
| A | 0 | 13037 | 2 |
| B | 0 | 16980 | 1 |
| C | 0 | 12533 | 1 |
| D | 0 | 13648 | 1 |
| Quadrant | Total seconds | Saturated seconds | Saturation percentage |
|---|---|---|---|
| A | 6106 | 144 | 2.358336% |
| B | 6106 | 241 | 3.946937% |
| C | 6106 | 84 | 1.375696% |
| D | 6106 | 101 | 1.654111% |
Noise dominated data is calculated using 1-second bins in cleaned event files. If a bin has >2000 counts, and if more than 50% of those come from <1% of pixels, then it is considered to be noise-dominated and hence unusable.
| Quadrant | # 1 sec bins | Bins with >0 counts | Bins with >2000 counts | High rate bins dominated by noise | Noise dominated (total time) | Noise dominated (detector-on time) | Marked lightcurve |
|---|---|---|---|---|---|---|---|
| A | 7130 | 6106 | 29 | 29 | 0.41% | 0.47% | 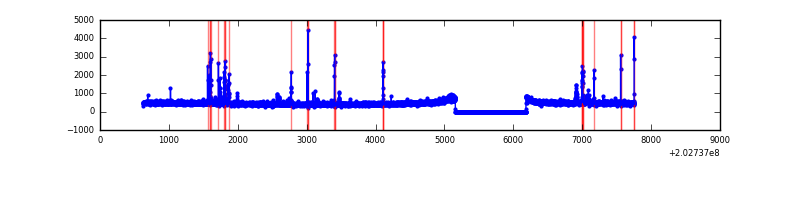 |
| B | 7131 | 6107 | 104 | 104 | 1.46% | 1.70% | 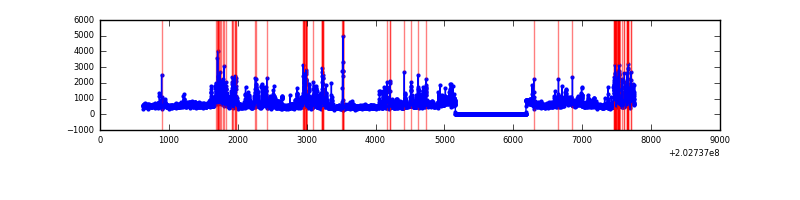 |
| C | 7131 | 6107 | 2 | 2 | 0.03% | 0.03% | 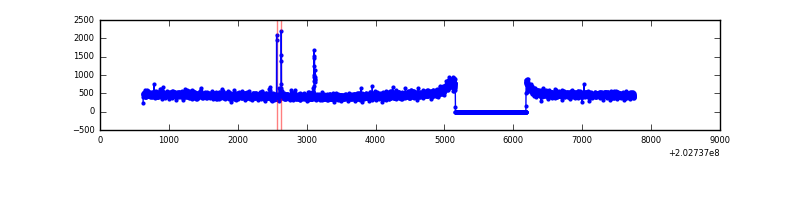 |
| D | 7131 | 6107 | 17 | 17 | 0.24% | 0.28% | 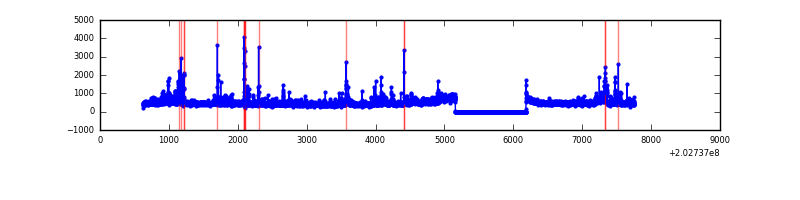 |
Top three noisy pixels from each quadrant. If the there are fewer than three noisy pixels in the level2.evt file, extra rows are filled as -1
| Pixel properties | Quadrant properties | ||||||
|---|---|---|---|---|---|---|---|
| Quadrant | DetID | PixID | Counts | Sigma | Mean | Median | Sigma |
| A | 0 | 50 | 126651 | 843.2 | 734 | 720 | 149.3 |
| A | 13 | 248 | 18545 | 119.35 | 734 | 720 | 149.3 |
| A | 0 | 118 | 18426 | 118.55 | 734 | 720 | 149.3 |
| B | 14 | 167 | 1064303 | 7498.86 | 733 | 716 | 141.8 |
| B | 15 | 204 | 214986 | 1510.72 | 733 | 716 | 141.8 |
| B | 3 | 0 | 149863 | 1051.57 | 733 | 716 | 141.8 |
| C | 1 | 16 | 11447 | 64.19 | 714 | 719 | 167.1 |
| C | 12 | 4 | 6985 | 37.49 | 714 | 719 | 167.1 |
| C | 13 | 61 | 6061 | 31.96 | 714 | 719 | 167.1 |
| D | 9 | 35 | 158525 | 904.01 | 714 | 694 | 174.6 |
| D | 2 | 37 | 113994 | 648.95 | 714 | 694 | 174.6 |
| D | 13 | 137 | 46591 | 262.89 | 714 | 694 | 174.6 |
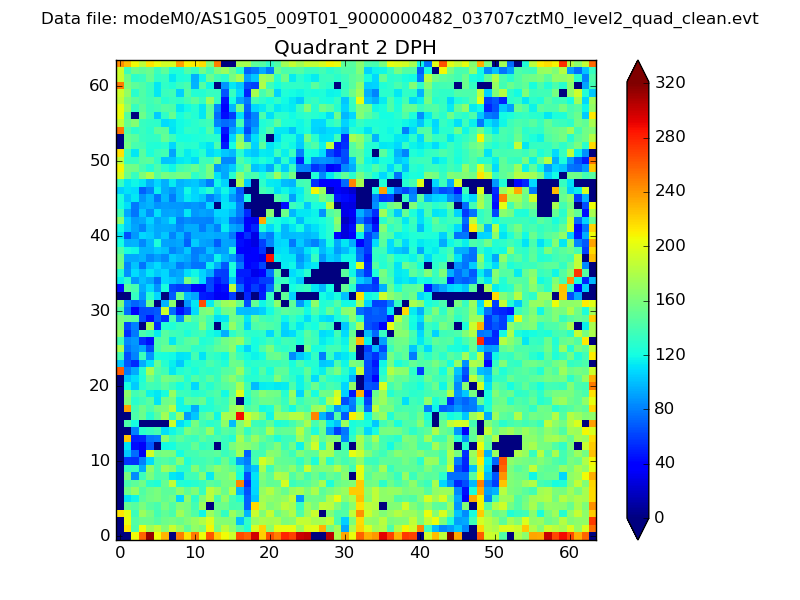
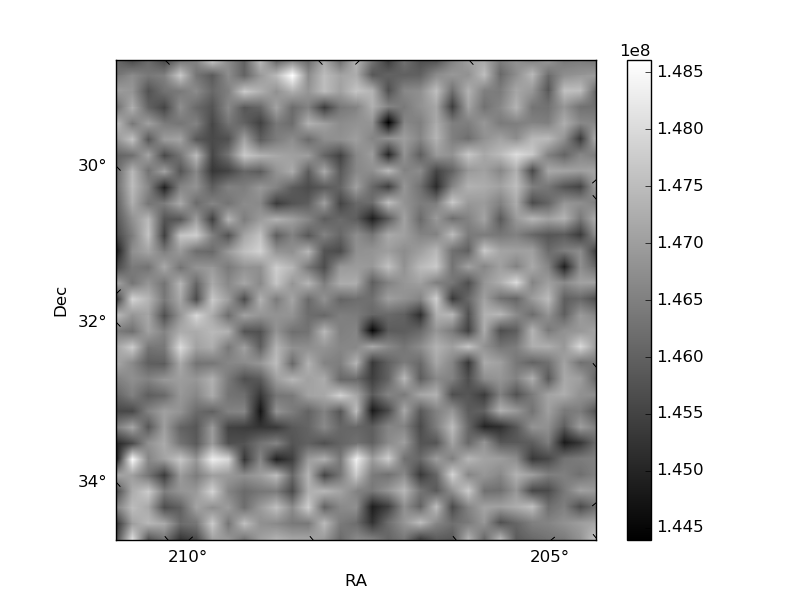
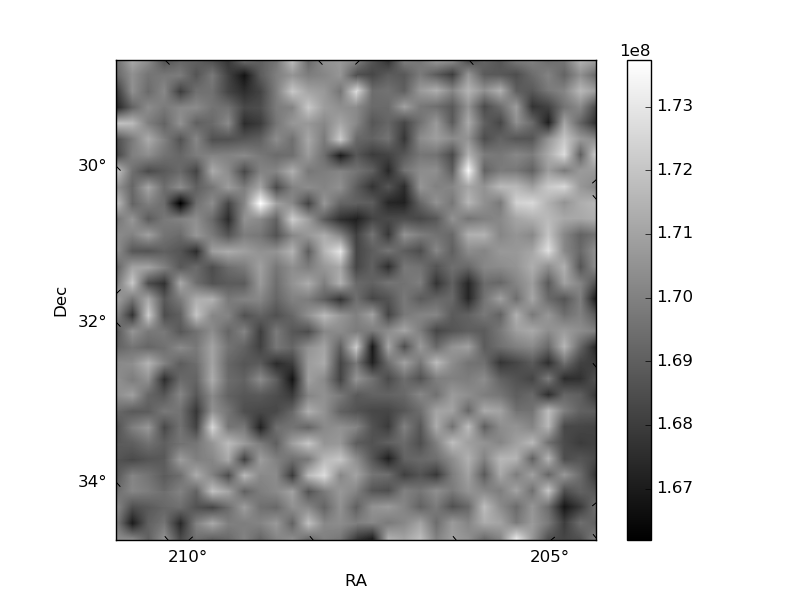
Histogram calculated using DETX and DETY for each event in the final _common_clean file
| Quadrant A | 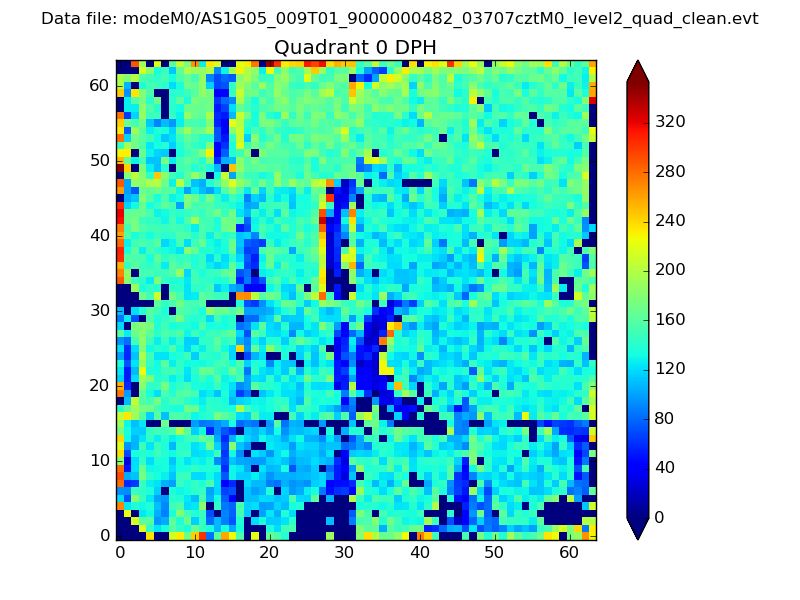 |
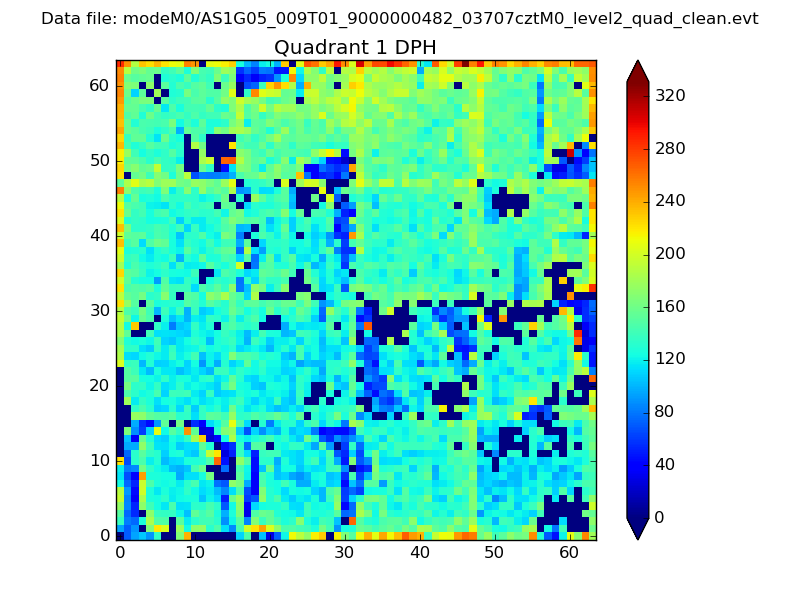 |
Quadrant B |
|---|---|---|---|
| Quadrant D | 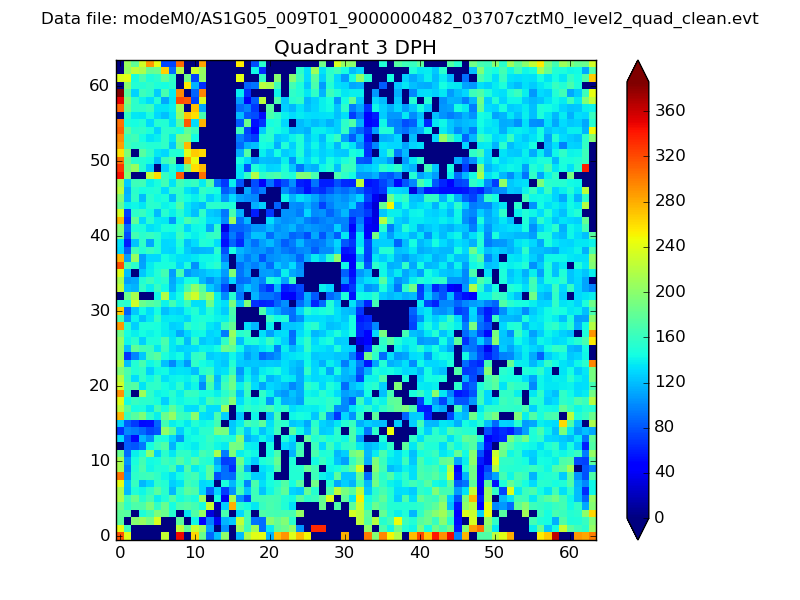 |
 |
Quadrant C |
| Plot type | Count rate plots | Images |
|---|---|---|
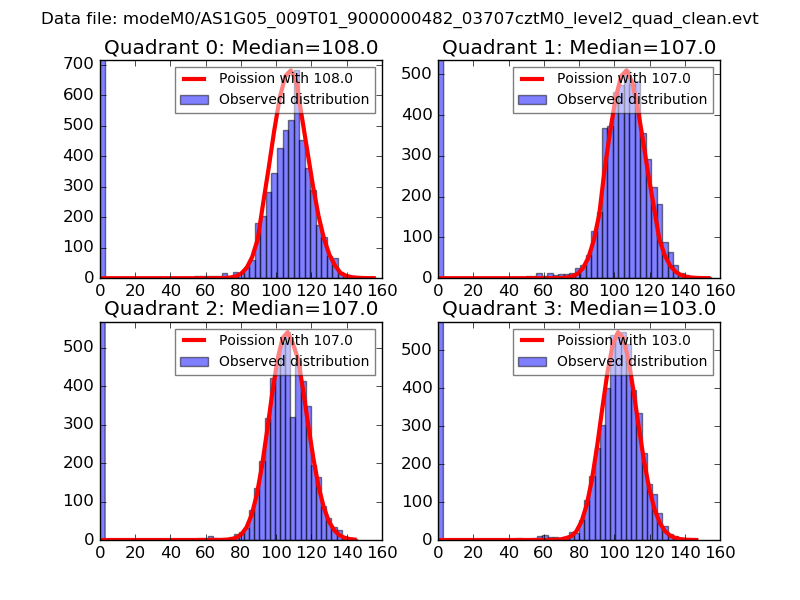
| Comparison with Poisson distribution Blue bars denote a histogram of data divided into 1 sec bins. Red curve is a Poisson curve with rate = median count rate of data. |
 |
 |
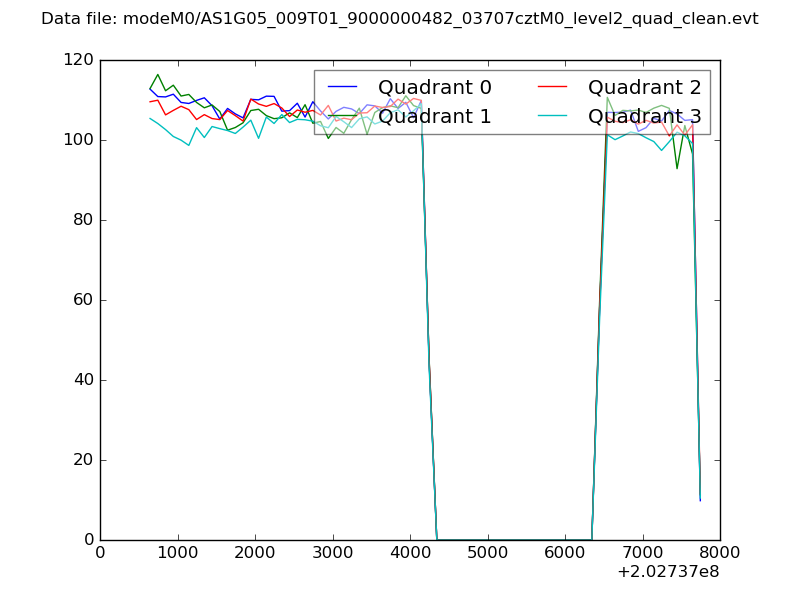
| Quadrant-wise count rates Data is divided into 100 sec bins |
 |
|
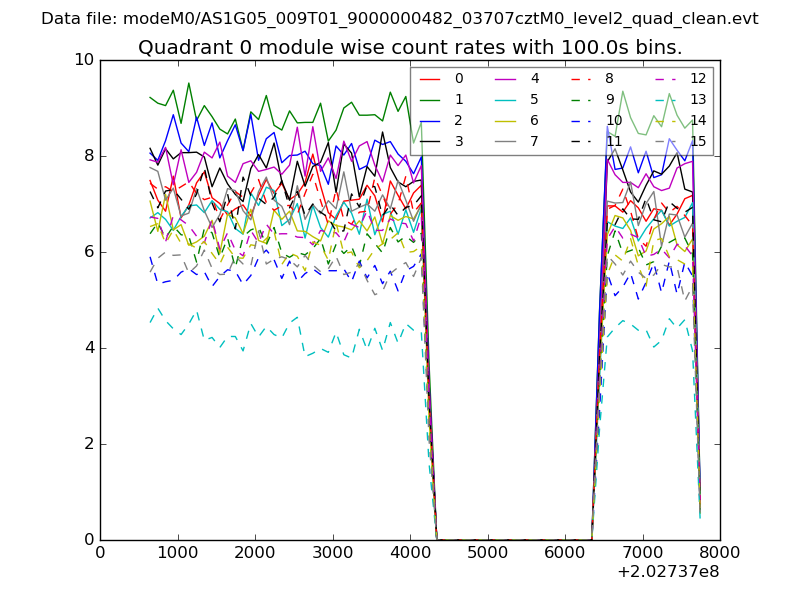
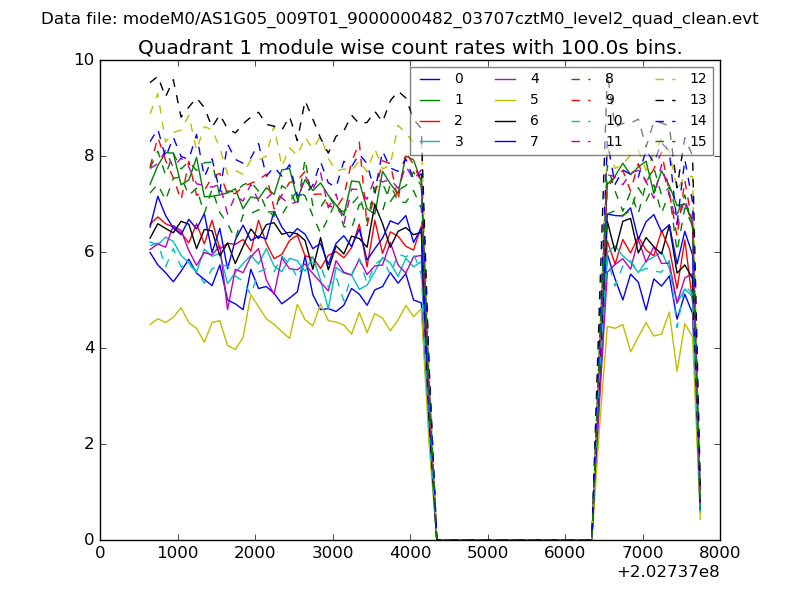
| Module-wise count rates for Quadrant A Data is divided into 100 sec bins |
 |
 |
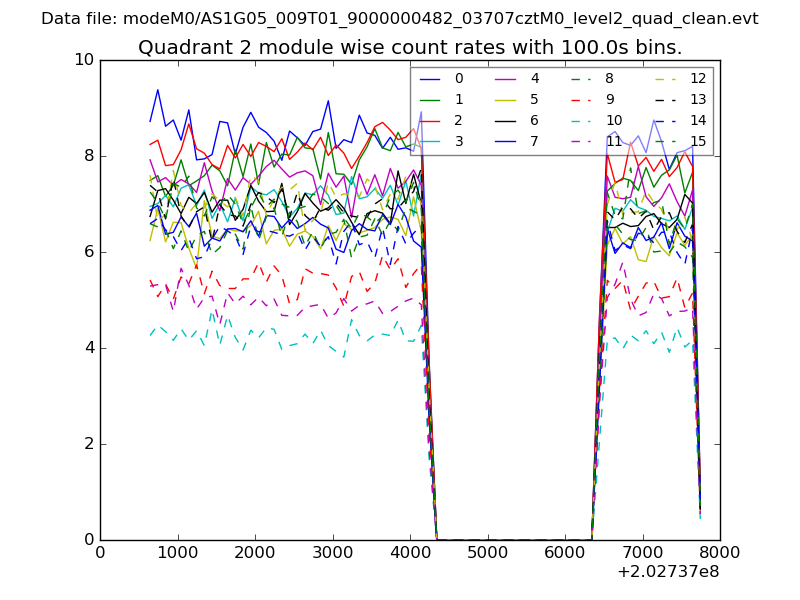
| Module-wise count rates for Quadrant B Data is divided into 100 sec bins |
 |
 |
| Module-wise count rates for Quadrant C Data is divided into 100 sec bins |
 |
 |
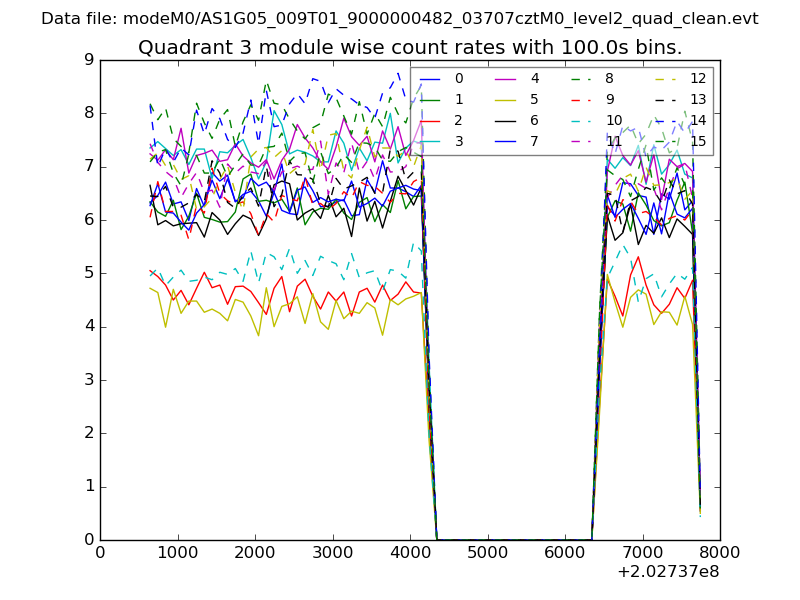
| Module-wise count rates for Quadrant D Data is divided into 100 sec bins |
 |
 |
| Parameter | Plot |
|---|---|
| CZT HV Monitor | 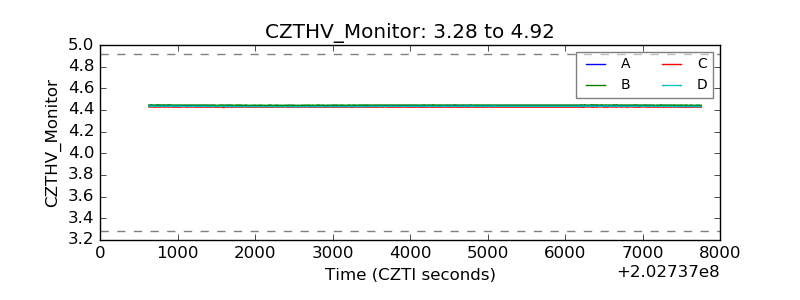 |
| D_VDD | 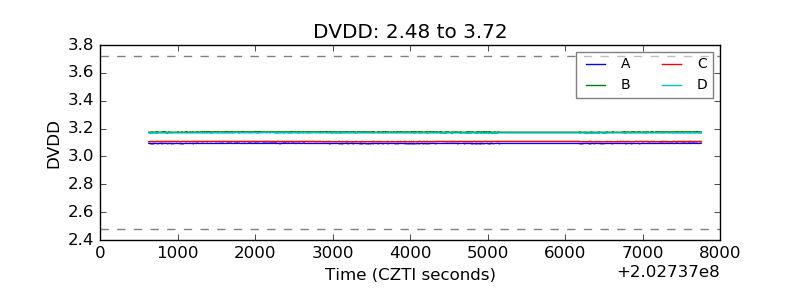 |
| Temperature 1 | 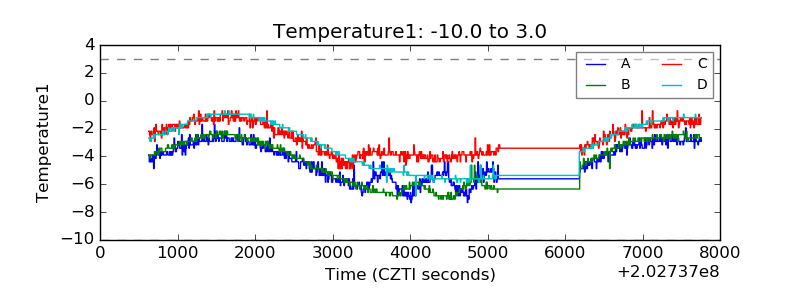 |
| Veto HV Monitor | 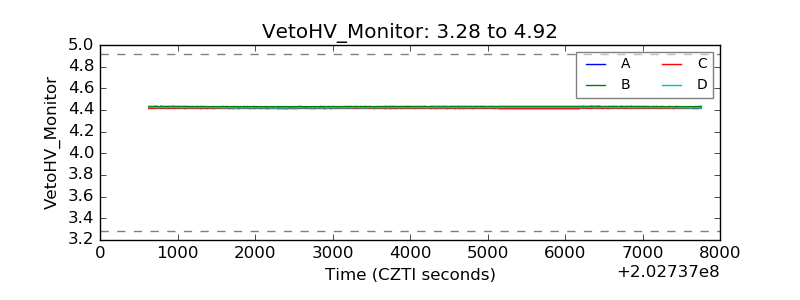 |
| Veto LLD | 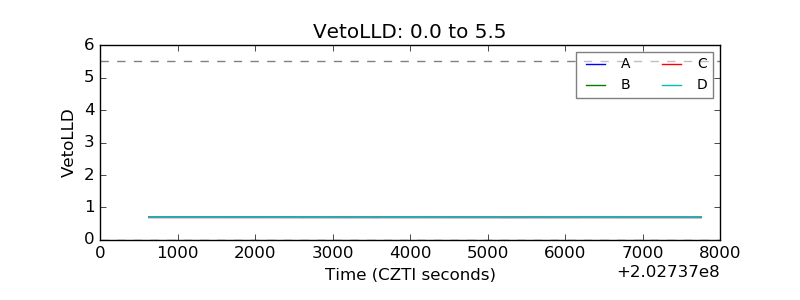 |
| Alpha Counter | 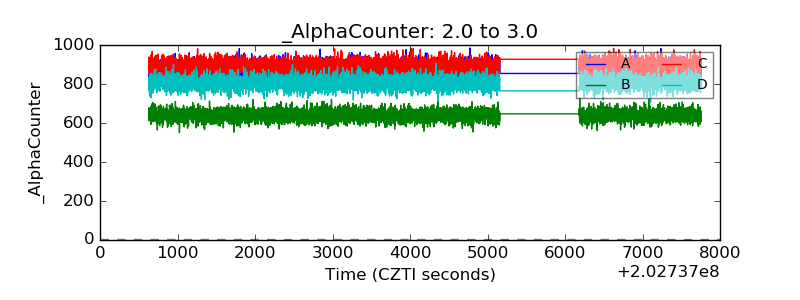 |
| _CPM_Rate | 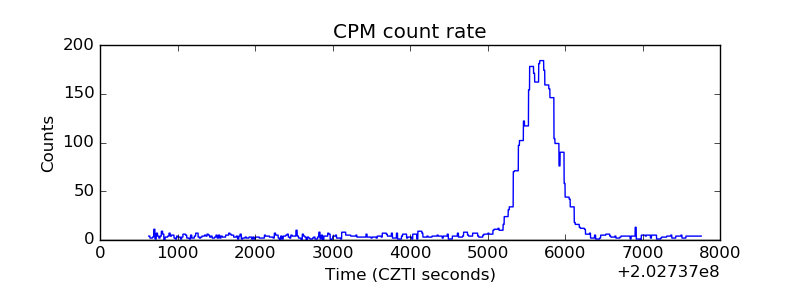 |
| CZT Counter | 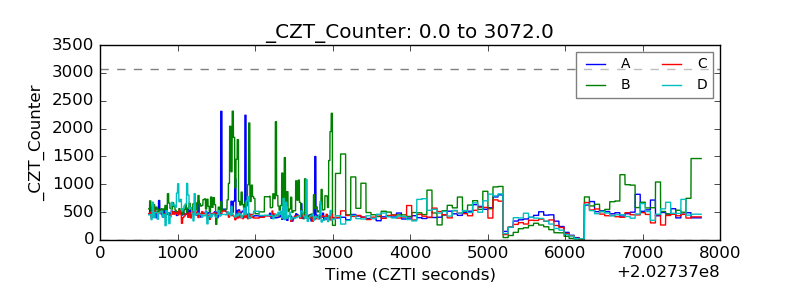 |
| +2.5 Volts monitor | 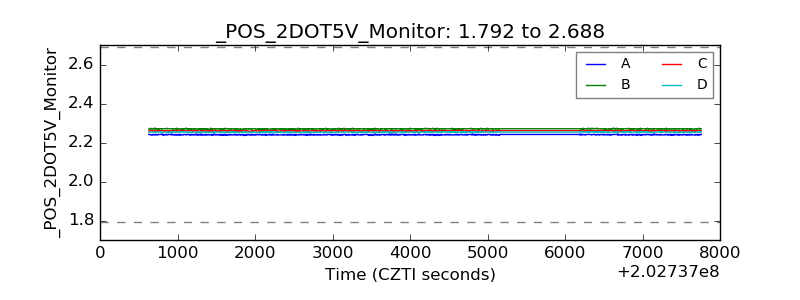 |
| +5 Volts monitor | 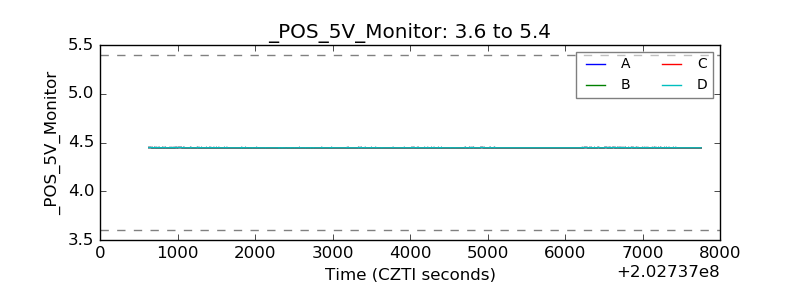 |
| Veto Counter | 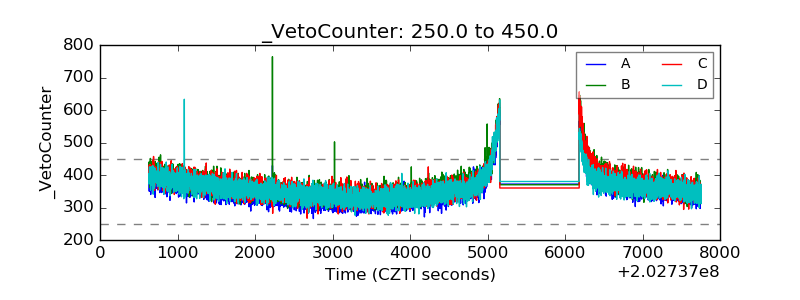 |