| Param | Original file | Final file |
|---|---|---|
| Filename | modeM0/AS1G05_009T01_9000000482_03708cztM0_level2.evt | modeM0/AS1G05_009T01_9000000482_03708cztM0_level2_quad_clean.evt |
| Size (bytes) | 1,431,267,840 | 221,595,840 |
| Size | 1.3 GB | 211.3 MB |
| Events in quadrant A | 9,012,966 | 1,406,521 |
| Events in quadrant B | 15,642,987 | 1,361,110 |
| Events in quadrant C | 8,256,353 | 1,389,715 |
| Events in quadrant D | 9,247,680 | 1,342,416 |
| Mode M9 | |||
|---|---|---|---|
| Quadrant | BADHDUFLAG | Total packets | Discarded packets |
| A | 0 | 30 | 0 |
| B | 0 | 30 | 0 |
| C | 0 | 30 | 0 |
| D | 0 | 30 | 0 |
| Mode SS | |||
|---|---|---|---|
| Quadrant | BADHDUFLAG | Total packets | Discarded packets |
| A | 0 | 358 | 0 |
| B | 0 | 358 | 0 |
| C | 0 | 358 | 0 |
| D | 0 | 358 | 0 |
| Mode M0 | |||
|---|---|---|---|
| Quadrant | BADHDUFLAG | Total packets | Discarded packets |
| A | 0 | 38181 | 4 |
| B | 0 | 58185 | 3 |
| C | 0 | 36359 | 3 |
| D | 0 | 39200 | 6 |
| Quadrant | Total seconds | Saturated seconds | Saturation percentage |
|---|---|---|---|
| A | 17570 | 513 | 2.919750% |
| B | 17570 | 1893 | 10.774047% |
| C | 17570 | 280 | 1.593625% |
| D | 17569 | 379 | 2.157209% |
Noise dominated data is calculated using 1-second bins in cleaned event files. If a bin has >2000 counts, and if more than 50% of those come from <1% of pixels, then it is considered to be noise-dominated and hence unusable.
| Quadrant | # 1 sec bins | Bins with >0 counts | Bins with >2000 counts | High rate bins dominated by noise | Noise dominated (total time) | Noise dominated (detector-on time) | Marked lightcurve |
|---|---|---|---|---|---|---|---|
| A | 25667 | 17572 | 89 | 89 | 0.35% | 0.51% | 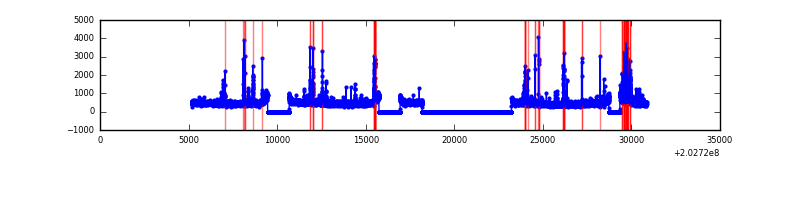 |
| B | 25667 | 17573 | 1239 | 1239 | 4.83% | 7.05% | 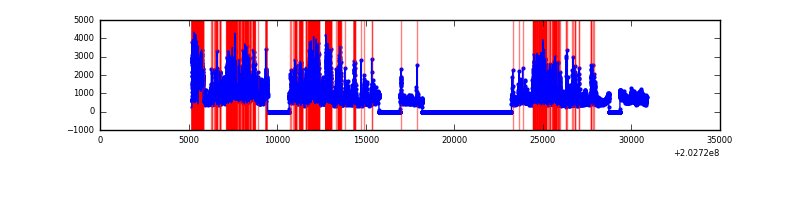 |
| C | 25667 | 17573 | 0 | 0 | 0.00% | 0.00% | 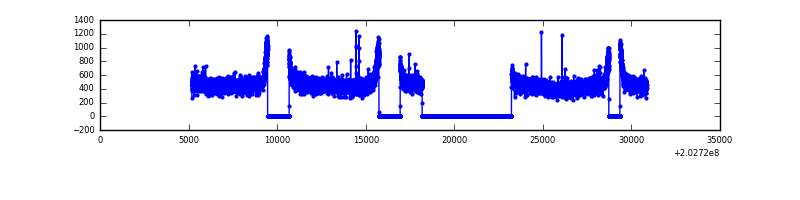 |
| D | 25667 | 17572 | 93 | 93 | 0.36% | 0.53% | 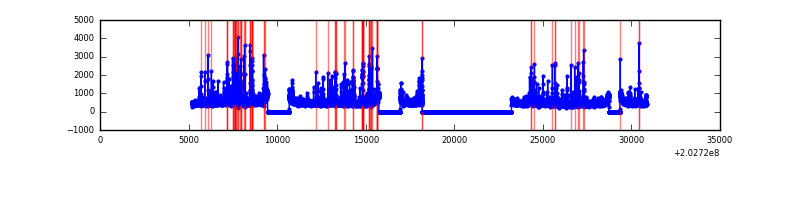 |
Top three noisy pixels from each quadrant. If the there are fewer than three noisy pixels in the level2.evt file, extra rows are filled as -1
| Pixel properties | Quadrant properties | ||||||
|---|---|---|---|---|---|---|---|
| Quadrant | DetID | PixID | Counts | Sigma | Mean | Median | Sigma |
| A | 13 | 251 | 250905 | 560.51 | 2177 | 2127 | 443.8 |
| A | 0 | 50 | 238516 | 532.6 | 2177 | 2127 | 443.8 |
| A | 15 | 174 | 75377 | 165.04 | 2177 | 2127 | 443.8 |
| B | 14 | 167 | 4582337 | 11257.9 | 2116 | 2063 | 406.8 |
| B | 5 | 70 | 1332277 | 3269.55 | 2116 | 2063 | 406.8 |
| B | 3 | 0 | 916689 | 2248.07 | 2116 | 2063 | 406.8 |
| C | 13 | 61 | 17985 | 32.4 | 2106 | 2115 | 489.8 |
| C | 9 | 247 | 9136 | 14.33 | 2106 | 2115 | 489.8 |
| C | 14 | 67 | 6797 | 9.56 | 2106 | 2115 | 489.8 |
| D | 2 | 37 | 375284 | 732.81 | 2108 | 2048 | 509.3 |
| D | 1 | 84 | 116758 | 225.22 | 2108 | 2048 | 509.3 |
| D | 13 | 137 | 116134 | 224.0 | 2108 | 2048 | 509.3 |
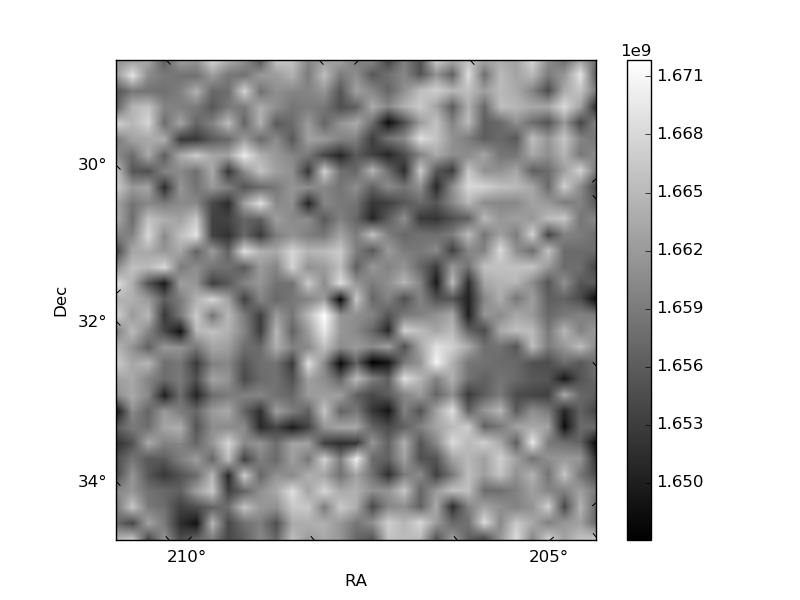
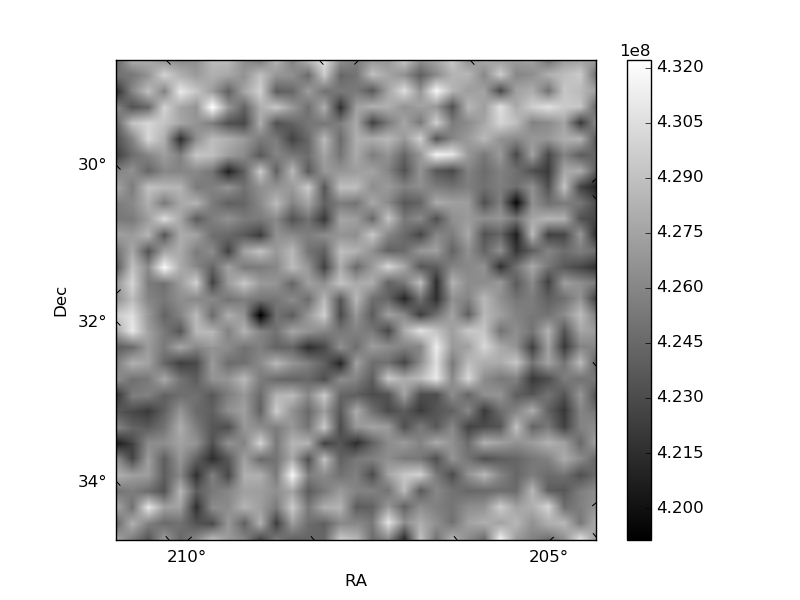
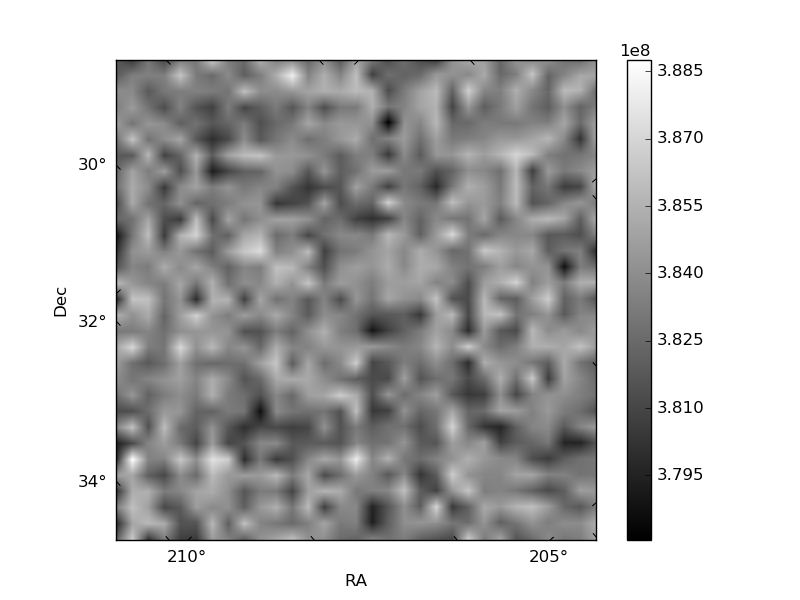
Histogram calculated using DETX and DETY for each event in the final _common_clean file
| Quadrant A | 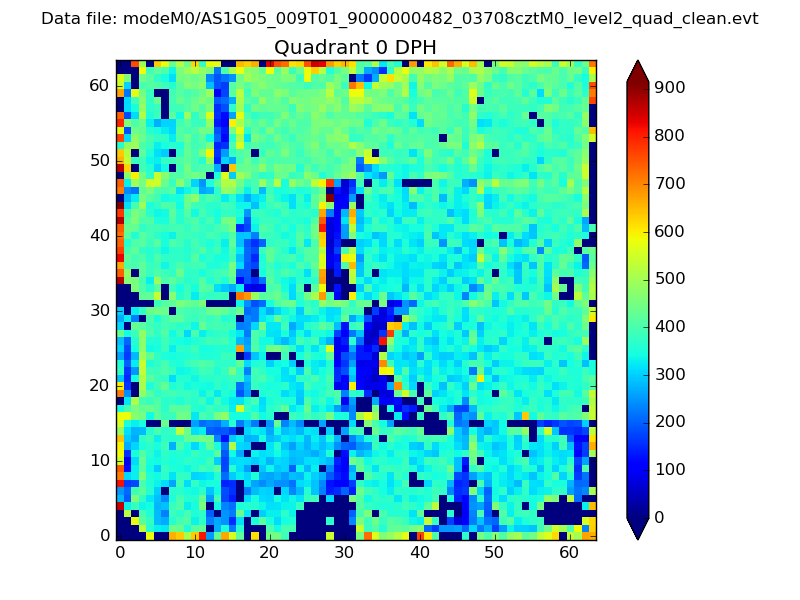 |
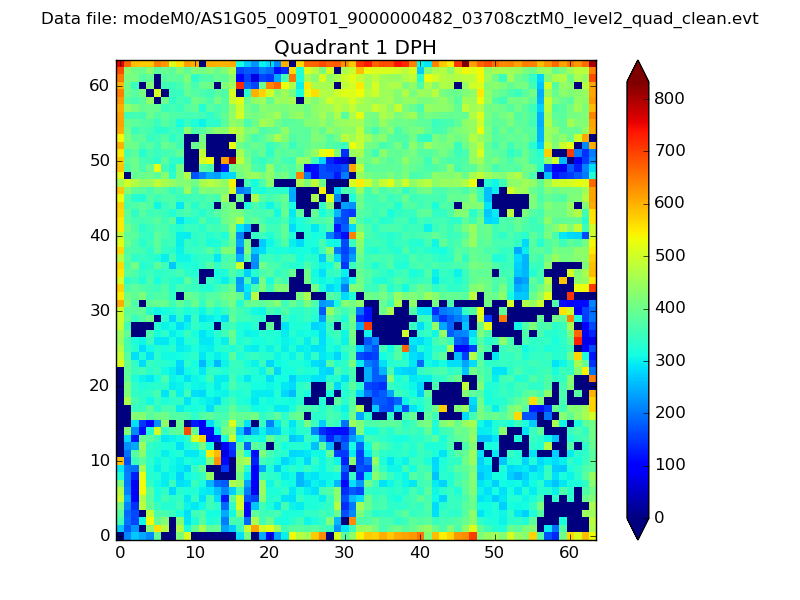 |
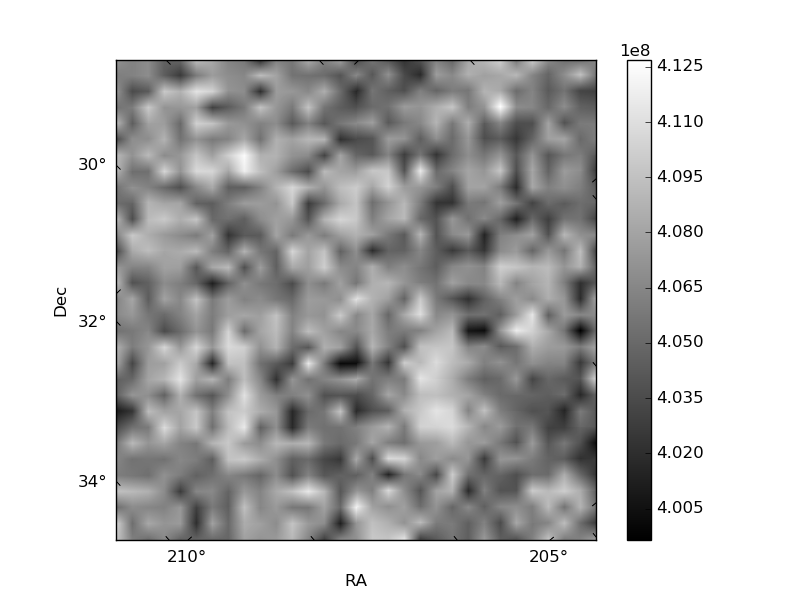
Quadrant B |
|---|---|---|---|
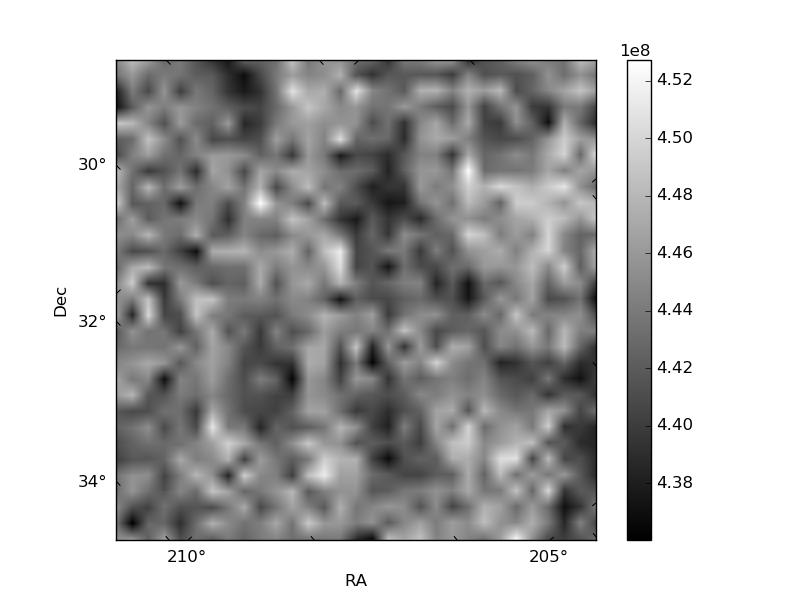
| Quadrant D | 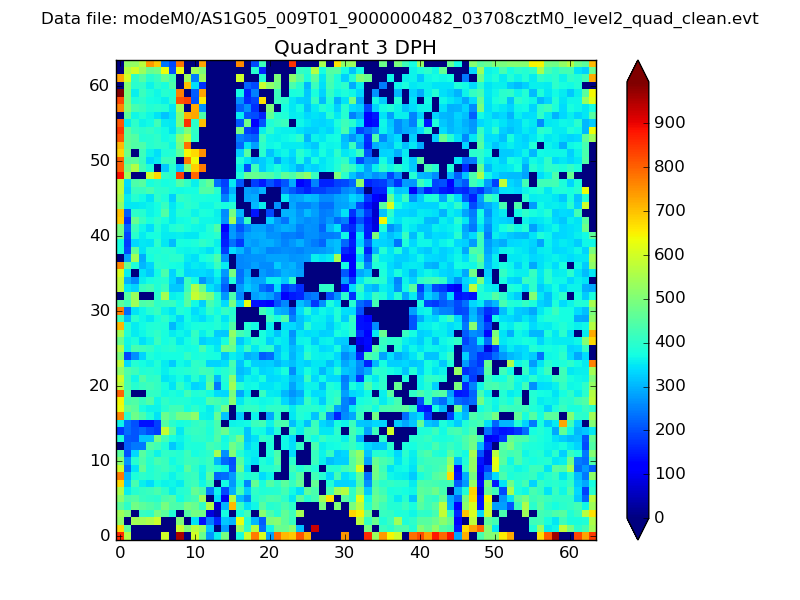 |
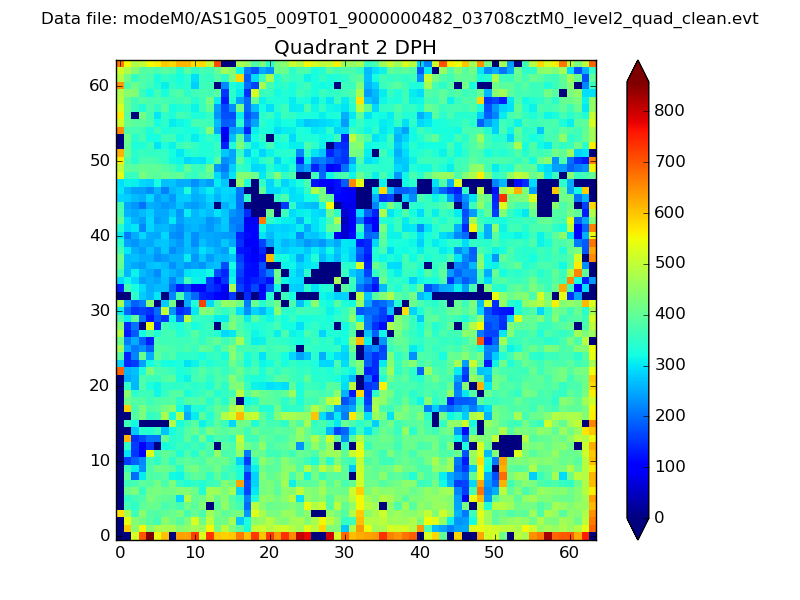 |
Quadrant C |
| Plot type | Count rate plots | Images |
|---|---|---|
| Comparison with Poisson distribution Blue bars denote a histogram of data divided into 1 sec bins. Red curve is a Poisson curve with rate = median count rate of data. |
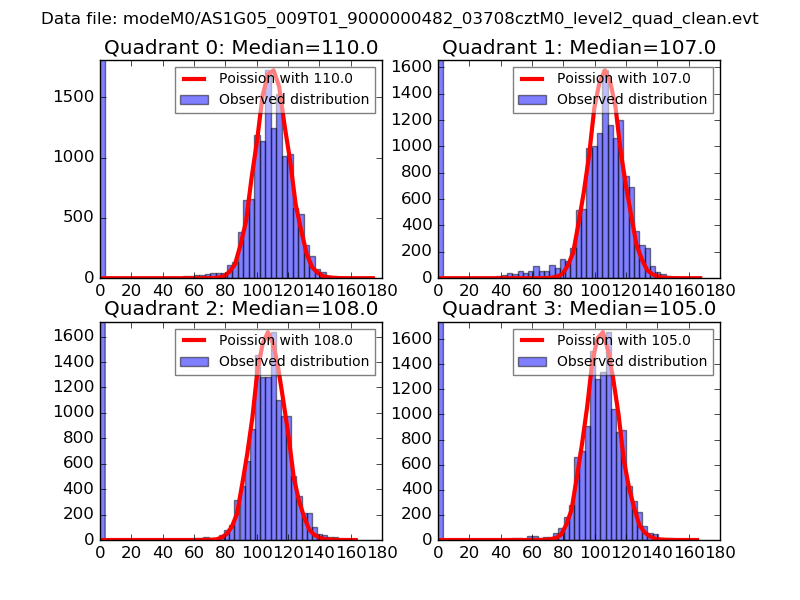 |
 |
| Quadrant-wise count rates Data is divided into 100 sec bins |
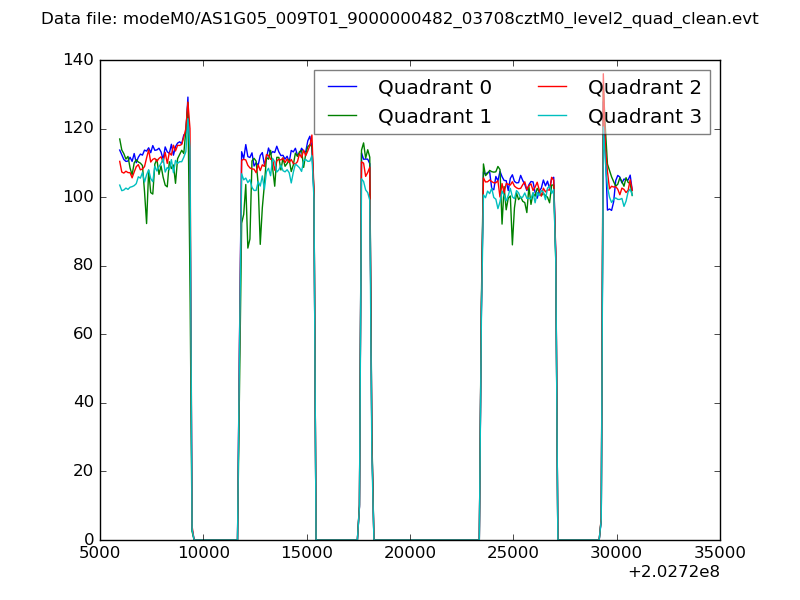 |
|
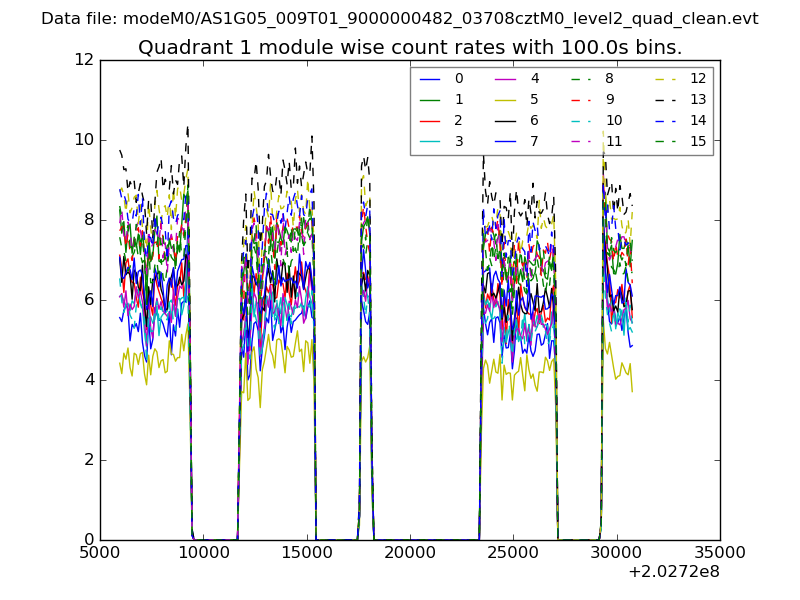
| Module-wise count rates for Quadrant A Data is divided into 100 sec bins |
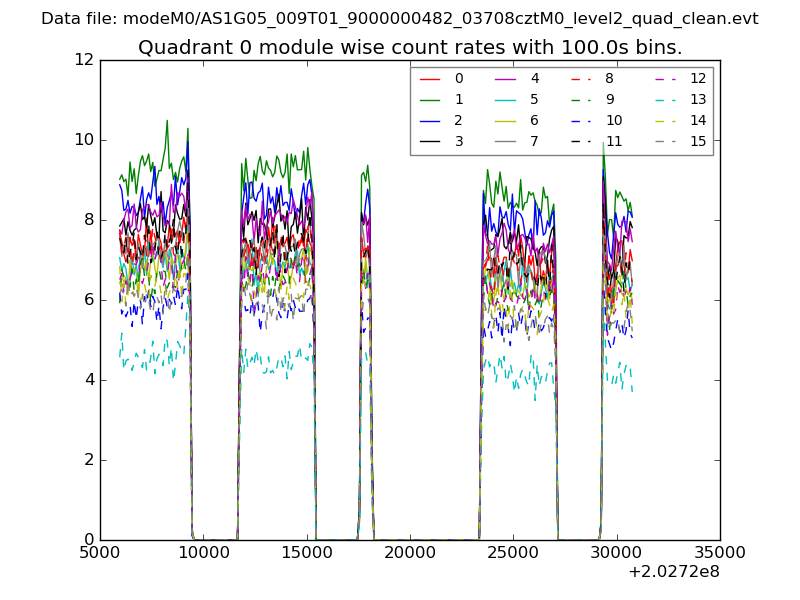 |
 |
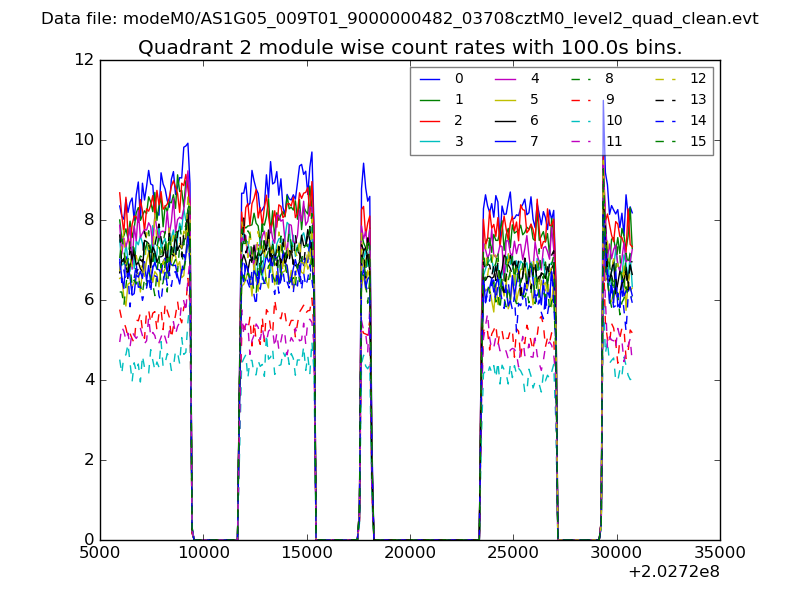
| Module-wise count rates for Quadrant B Data is divided into 100 sec bins |
 |
 |
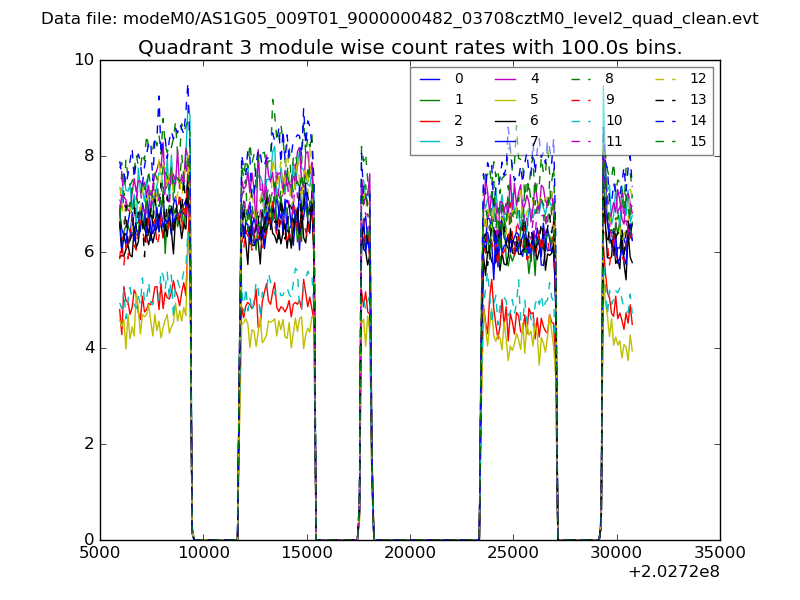
| Module-wise count rates for Quadrant C Data is divided into 100 sec bins |
 |
 |
| Module-wise count rates for Quadrant D Data is divided into 100 sec bins |
 |
 |
| Parameter | Plot |
|---|---|
| CZT HV Monitor | 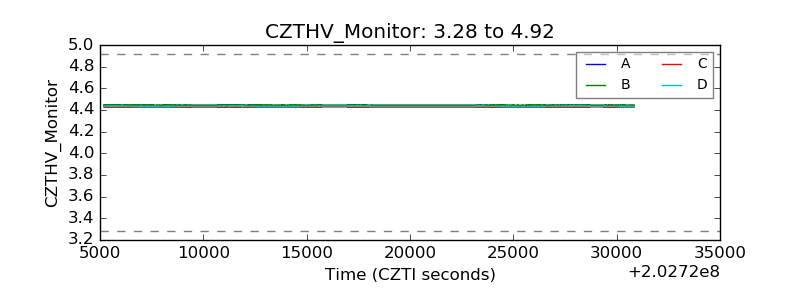 |
| D_VDD | 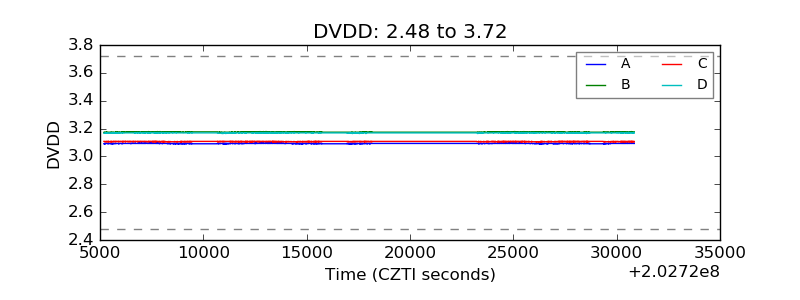 |
| Temperature 1 | 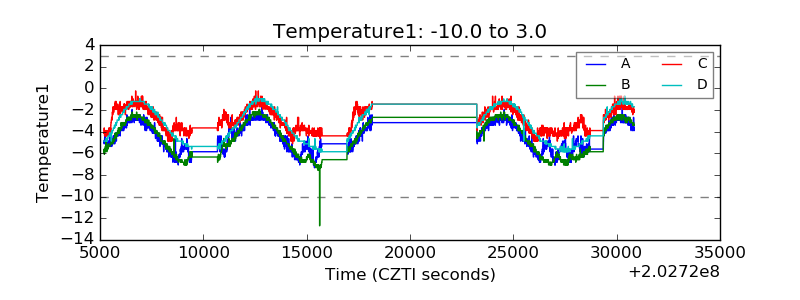 |
| Veto HV Monitor | 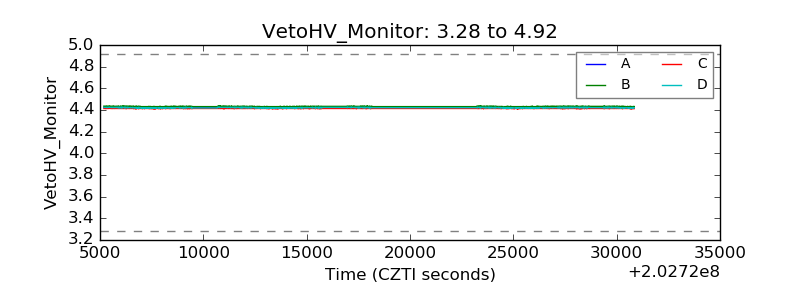 |
| Veto LLD | 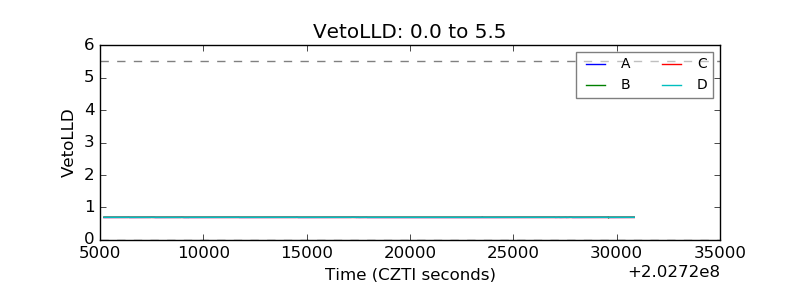 |
| Alpha Counter | 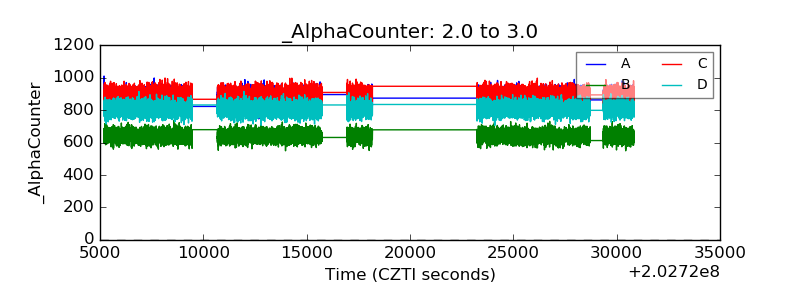 |
| _CPM_Rate | 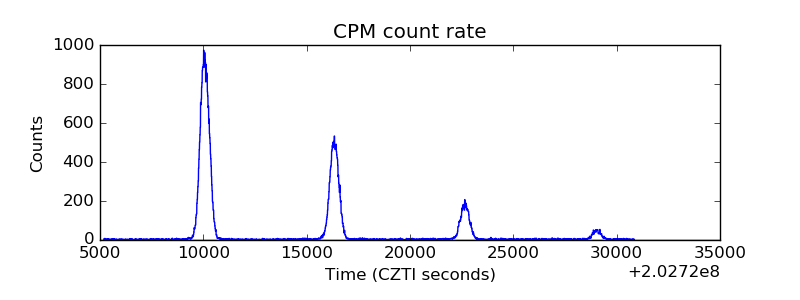 |
| CZT Counter | 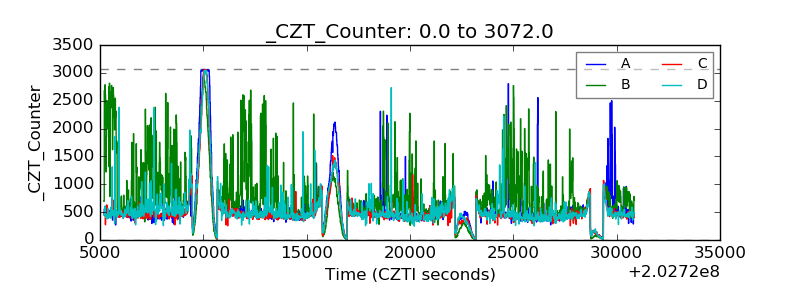 |
| +2.5 Volts monitor |  |
| +5 Volts monitor | 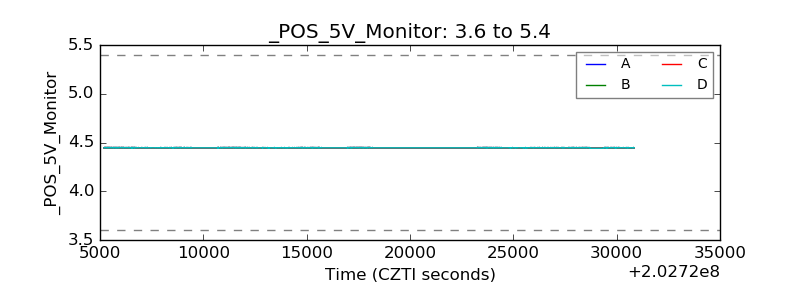 |
| Veto Counter | 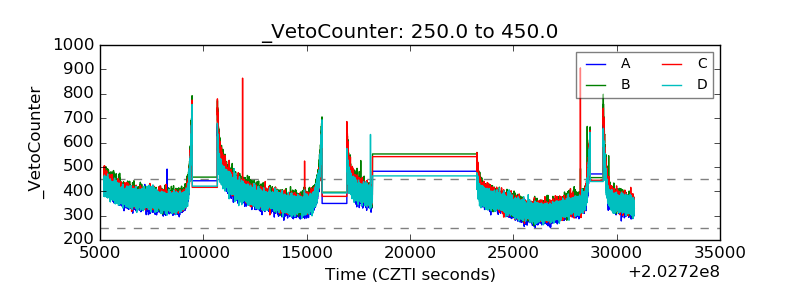 |