| Param | Original file | Final file |
|---|---|---|
| Filename | modeM0/AS1G05_009T01_9000000482_03709cztM0_level2.evt | modeM0/AS1G05_009T01_9000000482_03709cztM0_level2_quad_clean.evt |
| Size (bytes) | 525,346,560 | 84,312,000 |
| Size | 501.0 MB | 80.4 MB |
| Events in quadrant A | 3,533,656 | 519,461 |
| Events in quadrant B | 5,008,071 | 513,908 |
| Events in quadrant C | 3,321,078 | 514,351 |
| Events in quadrant D | 3,556,492 | 501,898 |
| Mode M9 | |||
|---|---|---|---|
| Quadrant | BADHDUFLAG | Total packets | Discarded packets |
| A | 0 | 3 | 0 |
| B | 0 | 3 | 0 |
| C | 0 | 3 | 0 |
| D | 0 | 3 | 0 |
| Mode SS | |||
|---|---|---|---|
| Quadrant | BADHDUFLAG | Total packets | Discarded packets |
| A | 0 | 148 | 0 |
| B | 0 | 148 | 0 |
| C | 0 | 148 | 0 |
| D | 0 | 148 | 0 |
| Mode M0 | |||
|---|---|---|---|
| Quadrant | BADHDUFLAG | Total packets | Discarded packets |
| A | 0 | 15612 | 3 |
| B | 0 | 19781 | 2 |
| C | 0 | 15024 | 2 |
| D | 0 | 15828 | 2 |
| Quadrant | Total seconds | Saturated seconds | Saturation percentage |
|---|---|---|---|
| A | 7225 | 124 | 1.716263% |
| B | 7225 | 241 | 3.335640% |
| C | 7225 | 85 | 1.176471% |
| D | 7225 | 112 | 1.550173% |
Noise dominated data is calculated using 1-second bins in cleaned event files. If a bin has >2000 counts, and if more than 50% of those come from <1% of pixels, then it is considered to be noise-dominated and hence unusable.
| Quadrant | # 1 sec bins | Bins with >0 counts | Bins with >2000 counts | High rate bins dominated by noise | Noise dominated (total time) | Noise dominated (detector-on time) | Marked lightcurve |
|---|---|---|---|---|---|---|---|
| A | 7545 | 7228 | 29 | 29 | 0.38% | 0.40% | 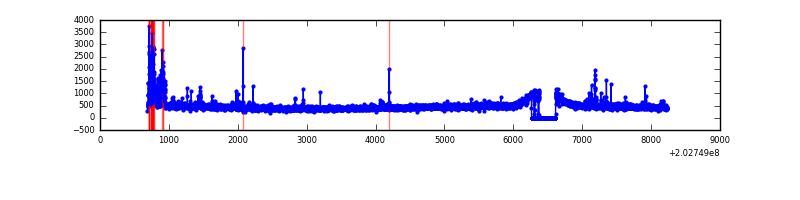 |
| B | 7545 | 7228 | 104 | 104 | 1.38% | 1.44% | 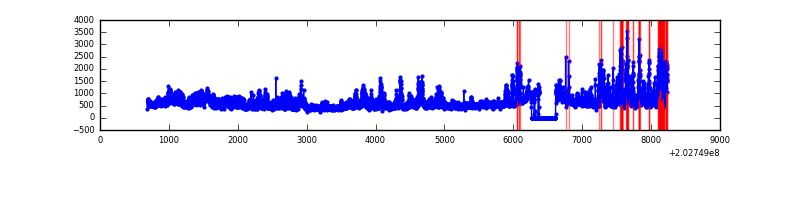 |
| C | 7545 | 7228 | 7 | 7 | 0.09% | 0.10% | 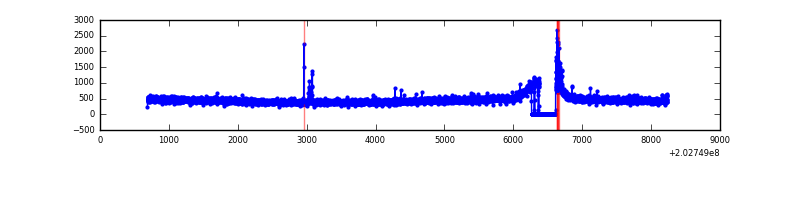 |
| D | 7545 | 7227 | 36 | 36 | 0.48% | 0.50% | 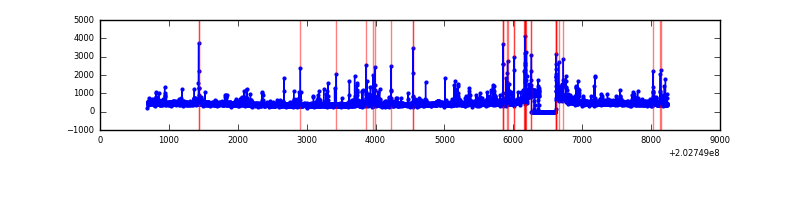 |
Top three noisy pixels from each quadrant. If the there are fewer than three noisy pixels in the level2.evt file, extra rows are filled as -1
| Pixel properties | Quadrant properties | ||||||
|---|---|---|---|---|---|---|---|
| Quadrant | DetID | PixID | Counts | Sigma | Mean | Median | Sigma |
| A | 13 | 251 | 175657 | 1001.62 | 850 | 831 | 174.5 |
| A | 13 | 248 | 28698 | 159.66 | 850 | 831 | 174.5 |
| A | 0 | 50 | 19585 | 107.45 | 850 | 831 | 174.5 |
| B | 14 | 167 | 1068603 | 6300.22 | 856 | 836 | 169.5 |
| B | 3 | 0 | 311831 | 1834.99 | 856 | 836 | 169.5 |
| B | 15 | 204 | 234026 | 1375.91 | 856 | 836 | 169.5 |
| C | 9 | 247 | 57974 | 290.15 | 830 | 833 | 196.9 |
| C | 7 | 239 | 11587 | 54.6 | 830 | 833 | 196.9 |
| C | 13 | 61 | 6915 | 30.88 | 830 | 833 | 196.9 |
| D | 4 | 239 | 103893 | 517.08 | 825 | 802 | 199.4 |
| D | 4 | 160 | 79435 | 394.4 | 825 | 802 | 199.4 |
| D | 13 | 223 | 51059 | 252.08 | 825 | 802 | 199.4 |
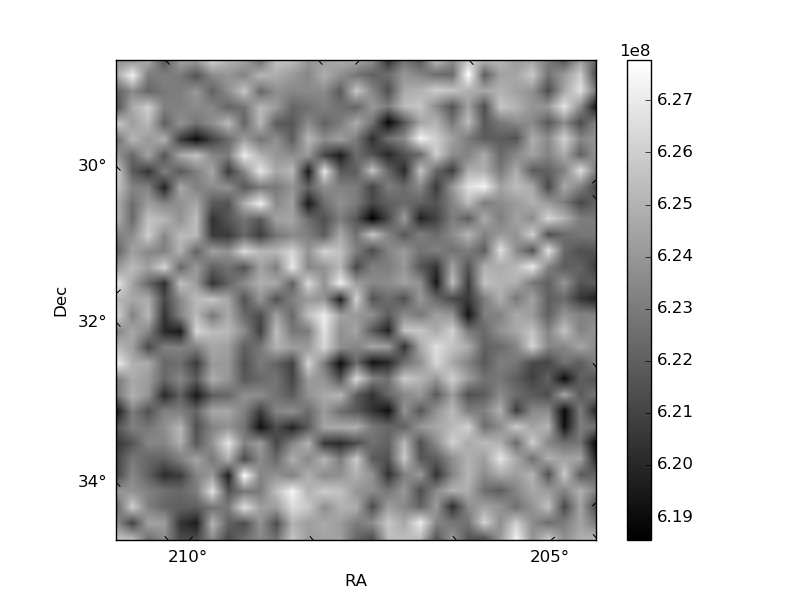
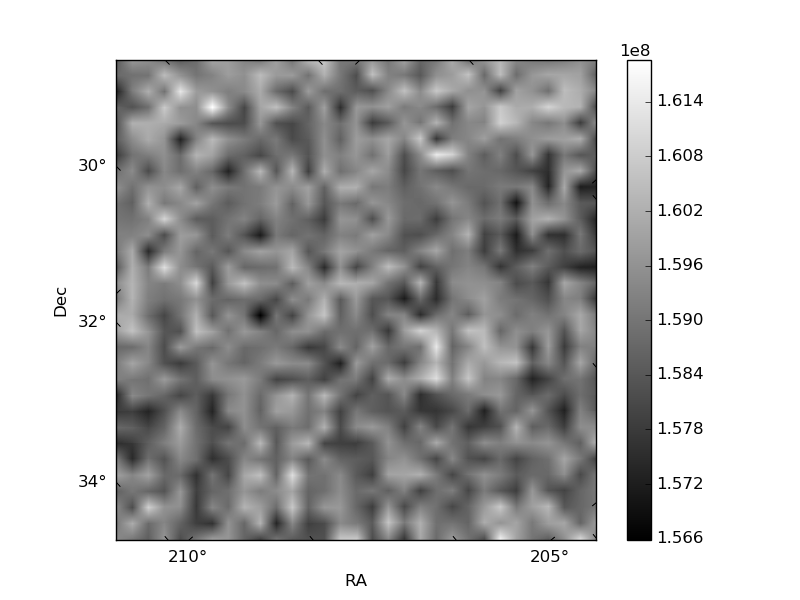
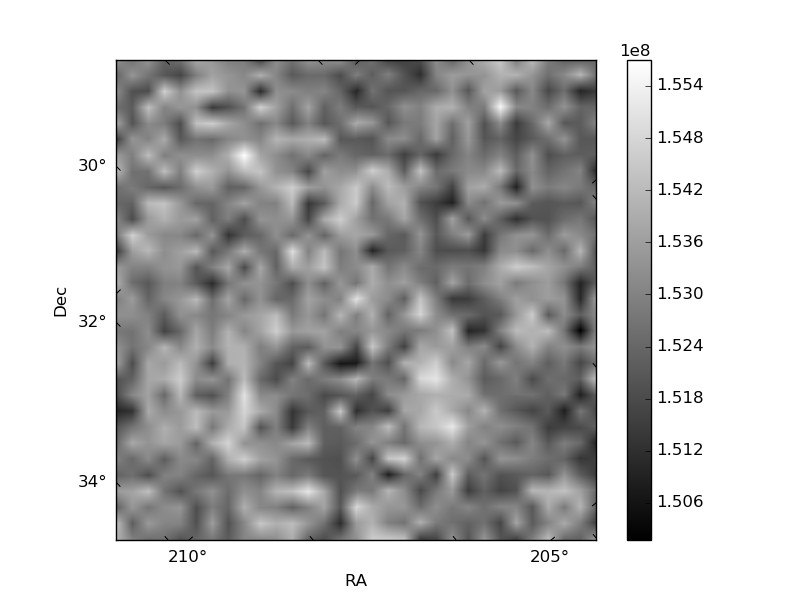
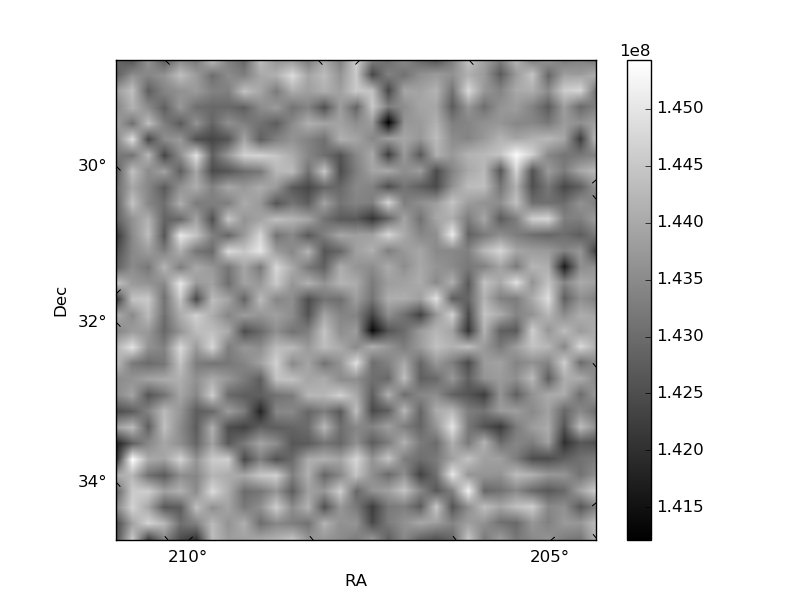
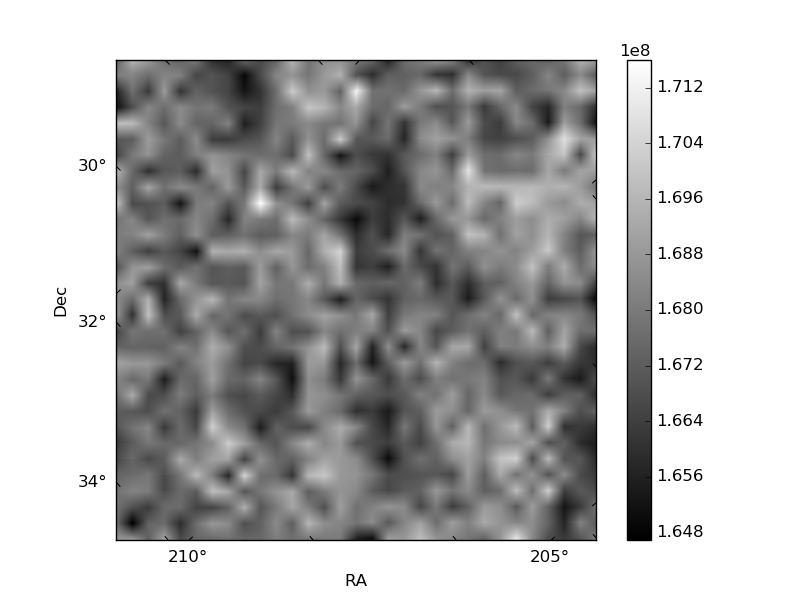
Histogram calculated using DETX and DETY for each event in the final _common_clean file
| Quadrant A | 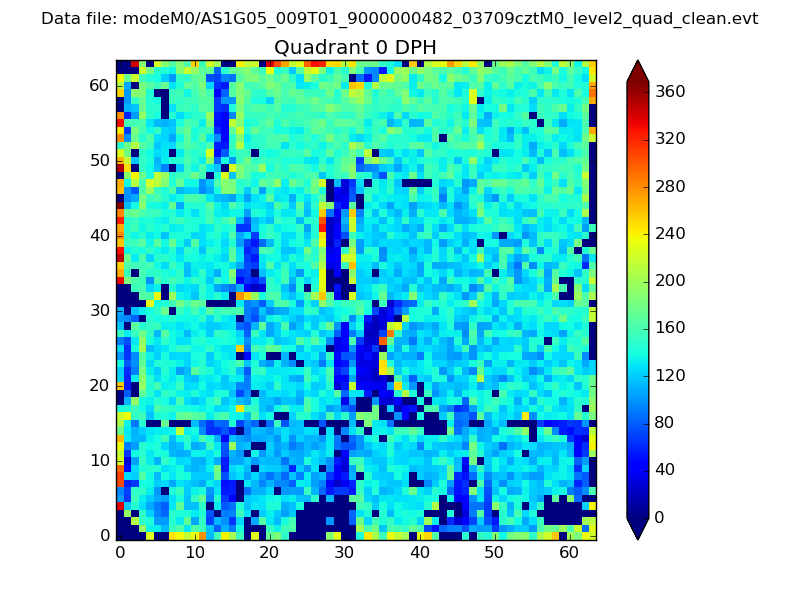 |
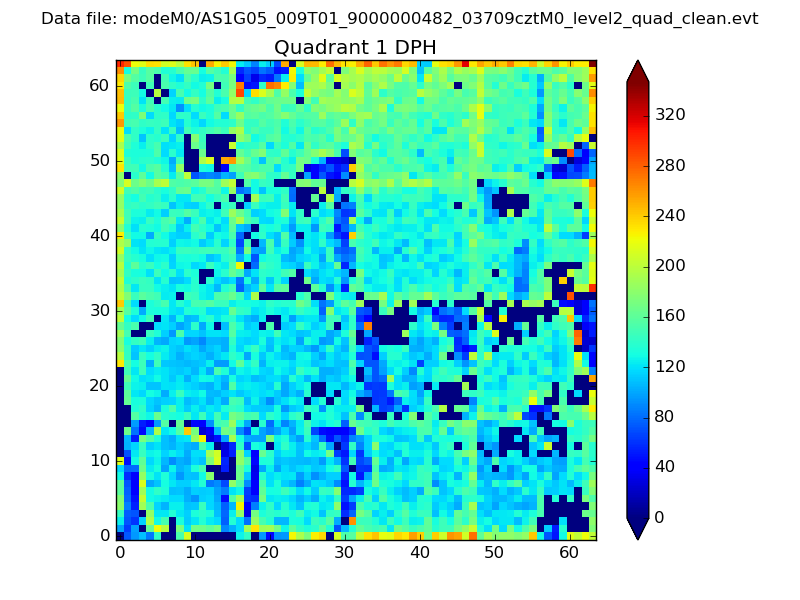 |
Quadrant B |
|---|---|---|---|
| Quadrant D | 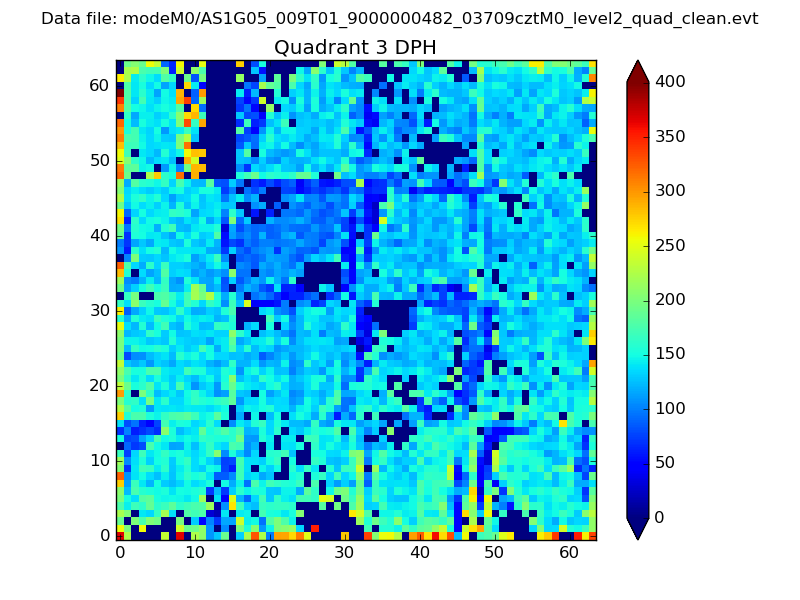 |
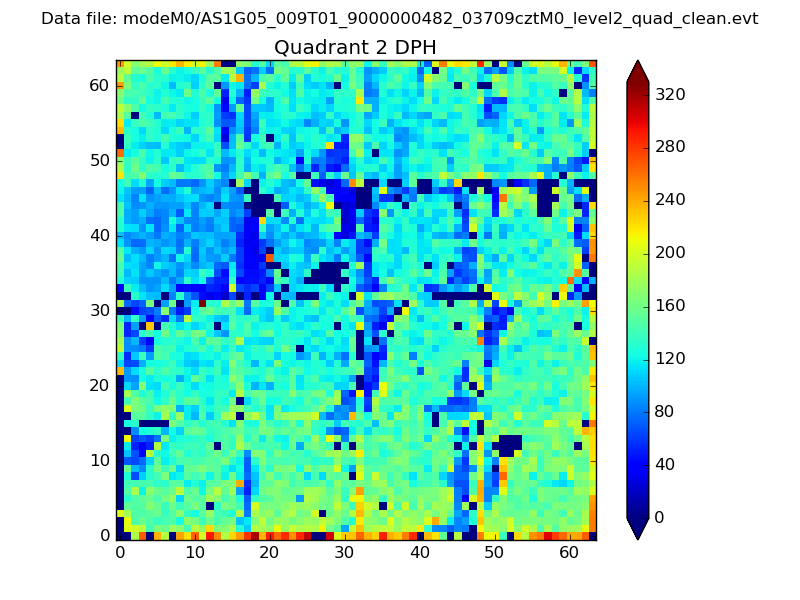 |
Quadrant C |
| Plot type | Count rate plots | Images |
|---|---|---|
| Comparison with Poisson distribution Blue bars denote a histogram of data divided into 1 sec bins. Red curve is a Poisson curve with rate = median count rate of data. |
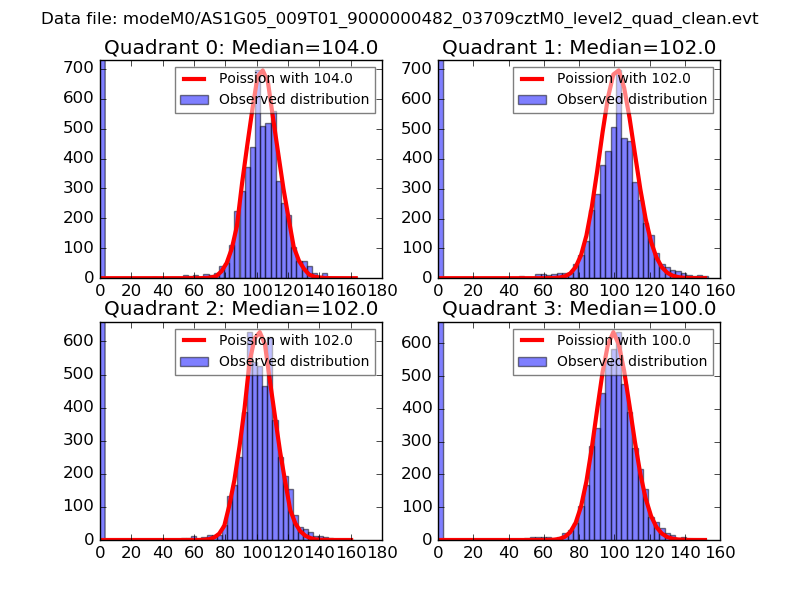 |
 |
| Quadrant-wise count rates Data is divided into 100 sec bins |
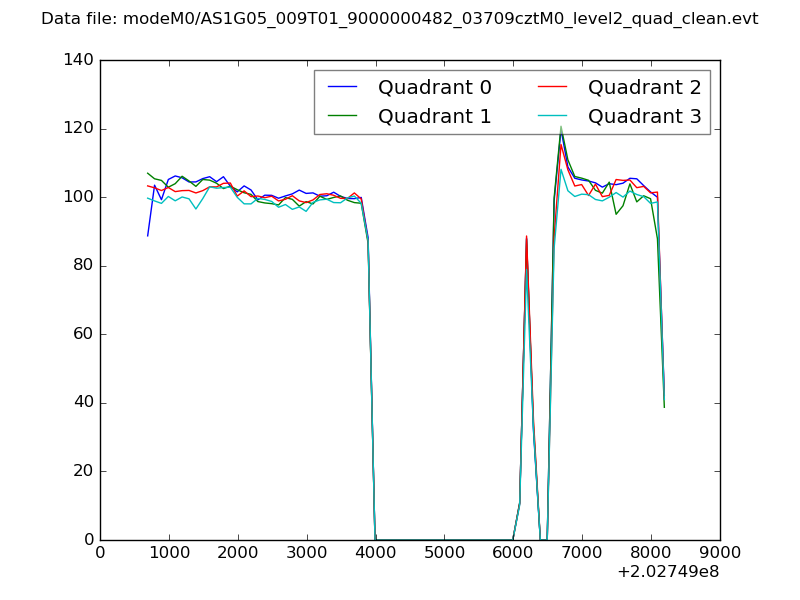 |
|
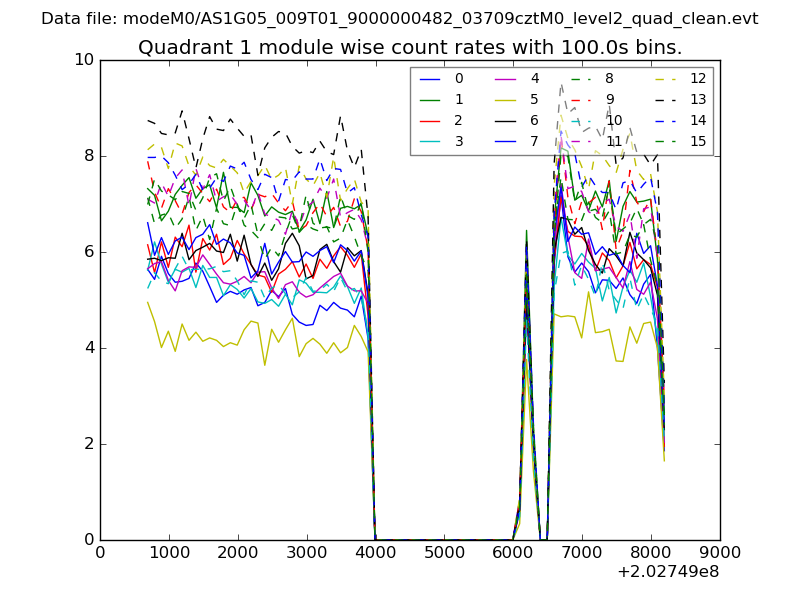
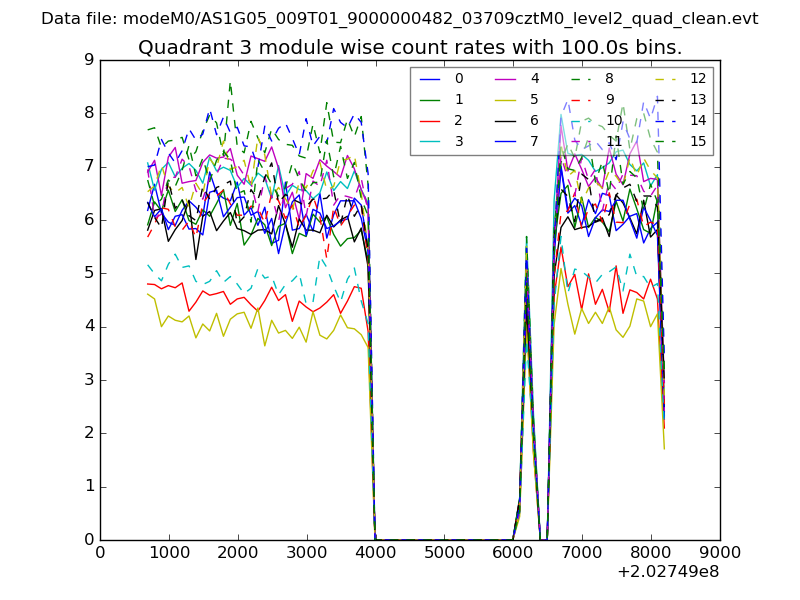
| Module-wise count rates for Quadrant A Data is divided into 100 sec bins |
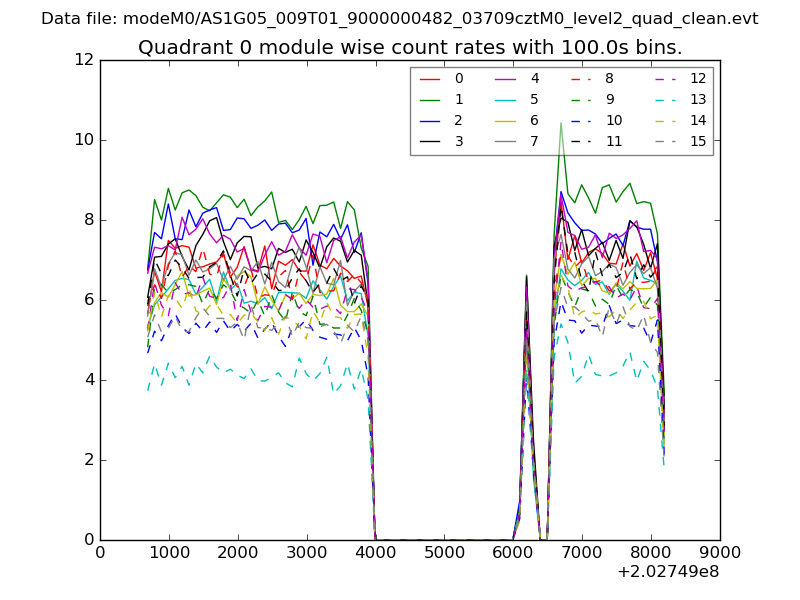 |
 |
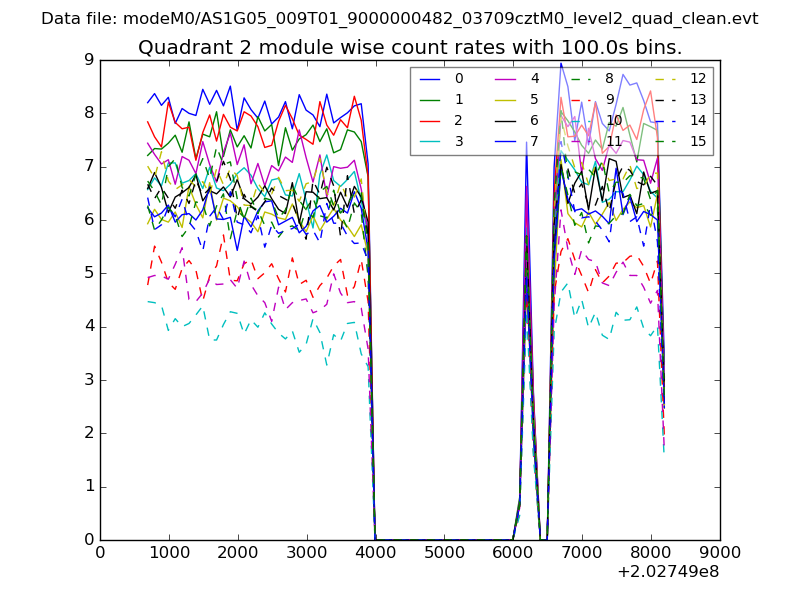
| Module-wise count rates for Quadrant B Data is divided into 100 sec bins |
 |
 |
| Module-wise count rates for Quadrant C Data is divided into 100 sec bins |
 |
 |
| Module-wise count rates for Quadrant D Data is divided into 100 sec bins |
 |
 |
| Parameter | Plot |
|---|---|
| CZT HV Monitor | 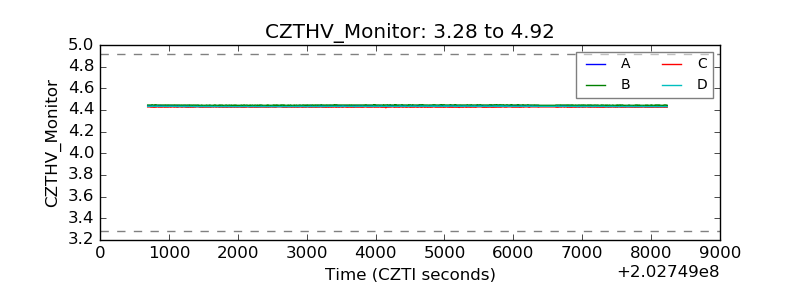 |
| D_VDD | 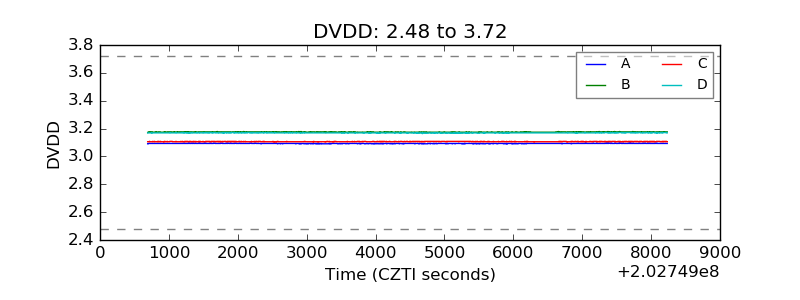 |
| Temperature 1 | 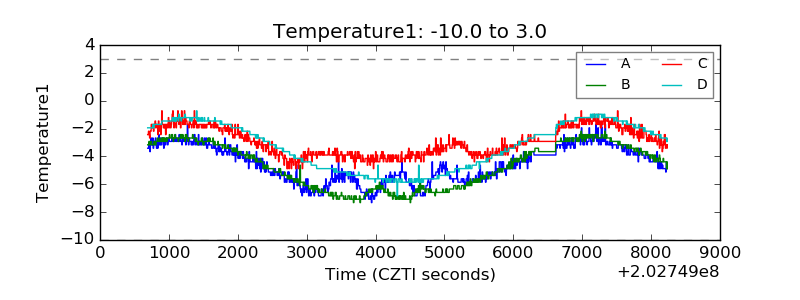 |
| Veto HV Monitor | 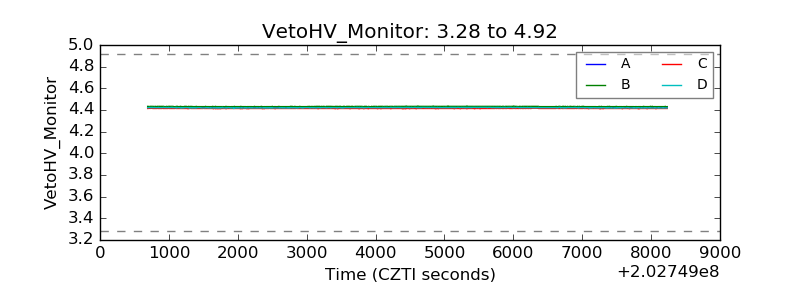 |
| Veto LLD | 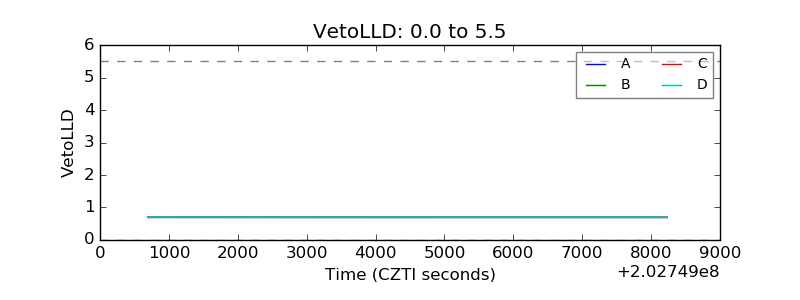 |
| Alpha Counter | 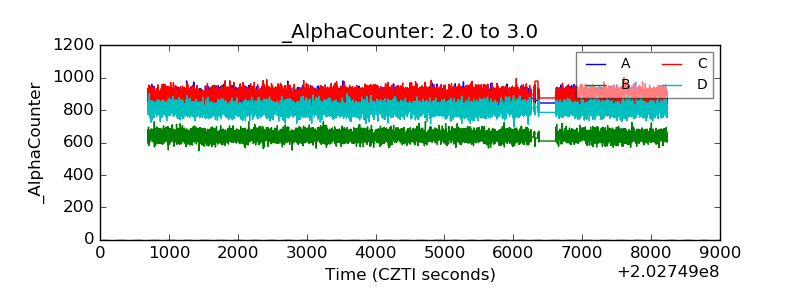 |
| _CPM_Rate | 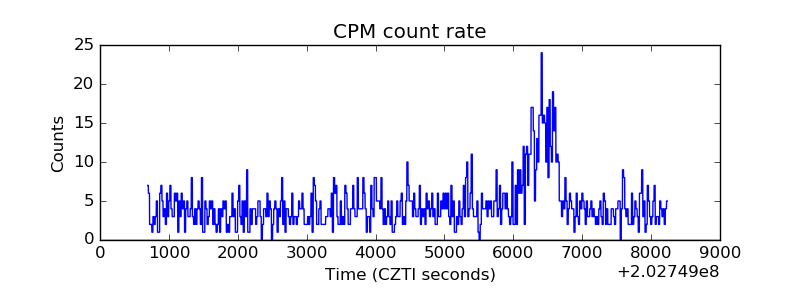 |
| CZT Counter | 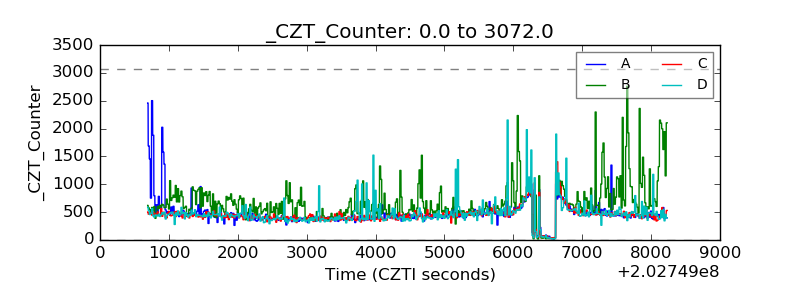 |
| +2.5 Volts monitor | 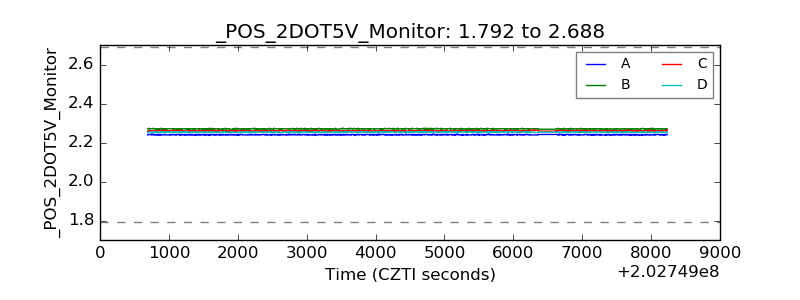 |
| +5 Volts monitor | 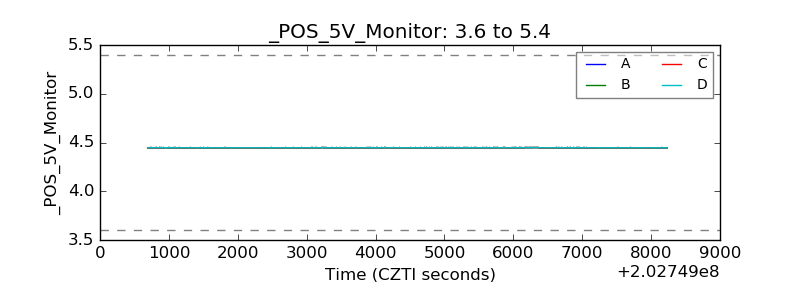 |
| Veto Counter | 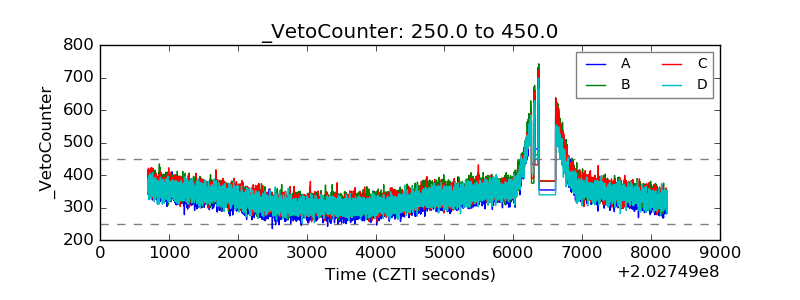 |