| Param | Original file | Final file |
|---|---|---|
| Filename | modeM0/AS1G05_009T01_9000000482_03711cztM0_level2.evt | modeM0/AS1G05_009T01_9000000482_03711cztM0_level2_quad_clean.evt |
| Size (bytes) | 535,847,040 | 85,106,880 |
| Size | 511.0 MB | 81.2 MB |
| Events in quadrant A | 3,559,718 | 525,331 |
| Events in quadrant B | 5,179,354 | 515,722 |
| Events in quadrant C | 3,498,124 | 521,393 |
| Events in quadrant D | 3,497,803 | 508,431 |
| Mode M9 | |||
|---|---|---|---|
| Quadrant | BADHDUFLAG | Total packets | Discarded packets |
| A | 0 | 1 | 0 |
| B | 0 | 1 | 0 |
| C | 0 | 1 | 0 |
| D | 0 | 1 | 0 |
| Mode SS | |||
|---|---|---|---|
| Quadrant | BADHDUFLAG | Total packets | Discarded packets |
| A | 0 | 148 | 0 |
| B | 0 | 148 | 0 |
| C | 0 | 148 | 0 |
| D | 0 | 148 | 0 |
| Mode M0 | |||
|---|---|---|---|
| Quadrant | BADHDUFLAG | Total packets | Discarded packets |
| A | 0 | 15645 | 2 |
| B | 0 | 20243 | 2 |
| C | 0 | 15500 | 2 |
| D | 0 | 15712 | 2 |
| Quadrant | Total seconds | Saturated seconds | Saturation percentage |
|---|---|---|---|
| A | 7266 | 164 | 2.257088% |
| B | 7266 | 374 | 5.147261% |
| C | 7266 | 100 | 1.376273% |
| D | 7266 | 67 | 0.922103% |
Noise dominated data is calculated using 1-second bins in cleaned event files. If a bin has >2000 counts, and if more than 50% of those come from <1% of pixels, then it is considered to be noise-dominated and hence unusable.
| Quadrant | # 1 sec bins | Bins with >0 counts | Bins with >2000 counts | High rate bins dominated by noise | Noise dominated (total time) | Noise dominated (detector-on time) | Marked lightcurve |
|---|---|---|---|---|---|---|---|
| A | 7396 | 7268 | 9 | 9 | 0.12% | 0.12% | 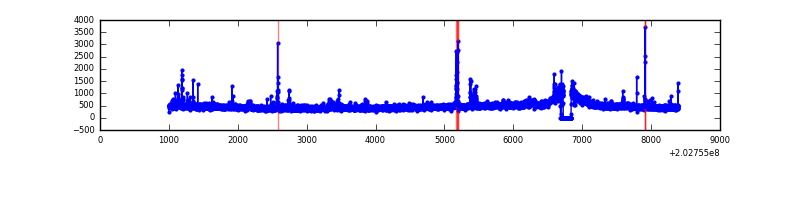 |
| B | 7396 | 7268 | 166 | 166 | 2.24% | 2.28% | 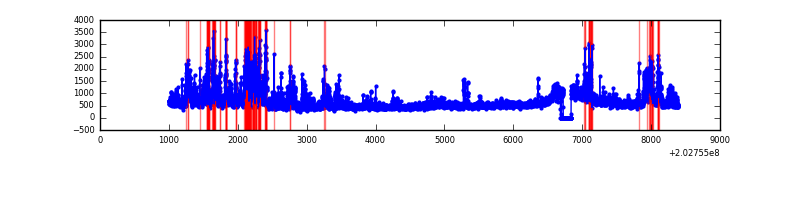 |
| C | 7396 | 7268 | 1 | 1 | 0.01% | 0.01% | 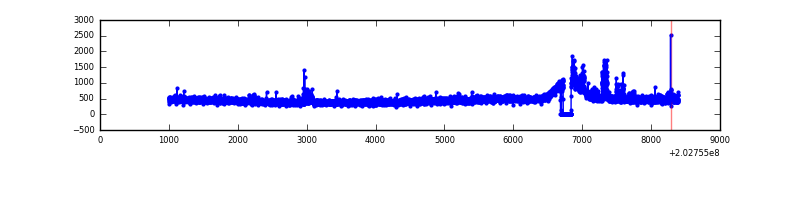 |
| D | 7396 | 7268 | 15 | 15 | 0.20% | 0.21% | 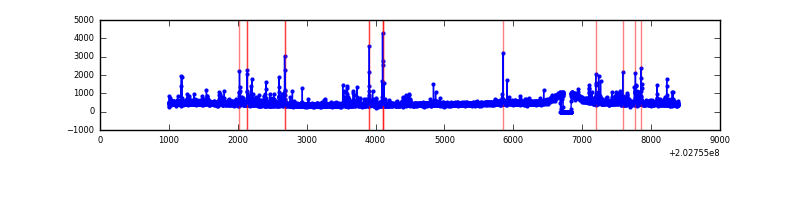 |
Top three noisy pixels from each quadrant. If the there are fewer than three noisy pixels in the level2.evt file, extra rows are filled as -1
| Pixel properties | Quadrant properties | ||||||
|---|---|---|---|---|---|---|---|
| Quadrant | DetID | PixID | Counts | Sigma | Mean | Median | Sigma |
| A | 8 | 15 | 92927 | 519.46 | 858 | 837 | 177.3 |
| A | 0 | 50 | 79281 | 442.49 | 858 | 837 | 177.3 |
| A | 13 | 248 | 25960 | 141.71 | 858 | 837 | 177.3 |
| B | 14 | 167 | 1341767 | 8012.07 | 863 | 841 | 167.4 |
| B | 15 | 204 | 390071 | 2325.66 | 863 | 841 | 167.4 |
| B | 3 | 0 | 34124 | 198.86 | 863 | 841 | 167.4 |
| C | 2 | 53 | 170481 | 856.06 | 841 | 844 | 198.2 |
| C | 9 | 247 | 13668 | 64.72 | 841 | 844 | 198.2 |
| C | 1 | 16 | 11026 | 51.38 | 841 | 844 | 198.2 |
| D | 5 | 233 | 83333 | 400.44 | 840 | 815 | 206.1 |
| D | 2 | 37 | 59056 | 282.63 | 840 | 815 | 206.1 |
| D | 13 | 223 | 38202 | 181.43 | 840 | 815 | 206.1 |
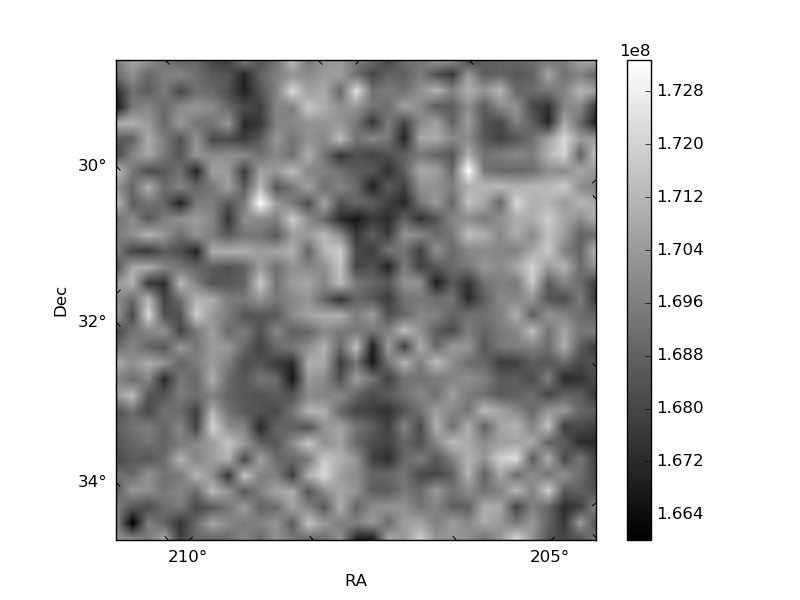
Histogram calculated using DETX and DETY for each event in the final _common_clean file
| Quadrant A | 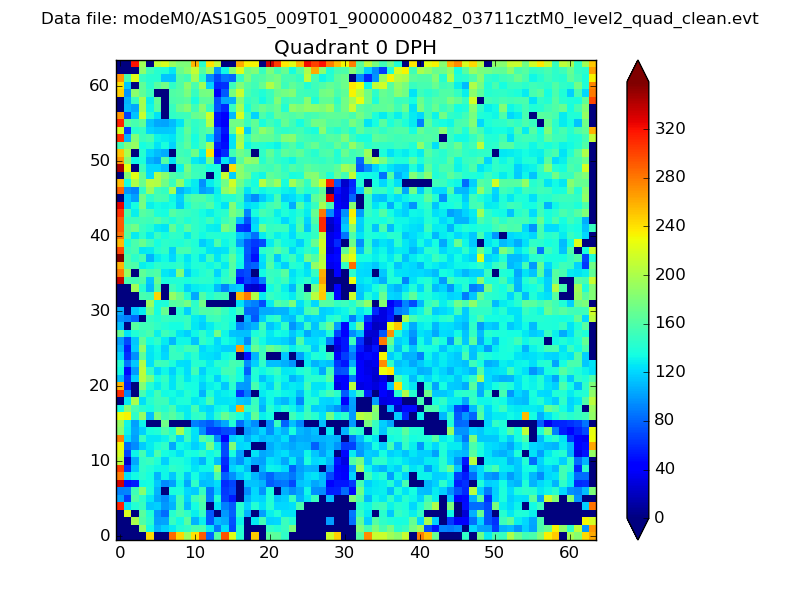 |
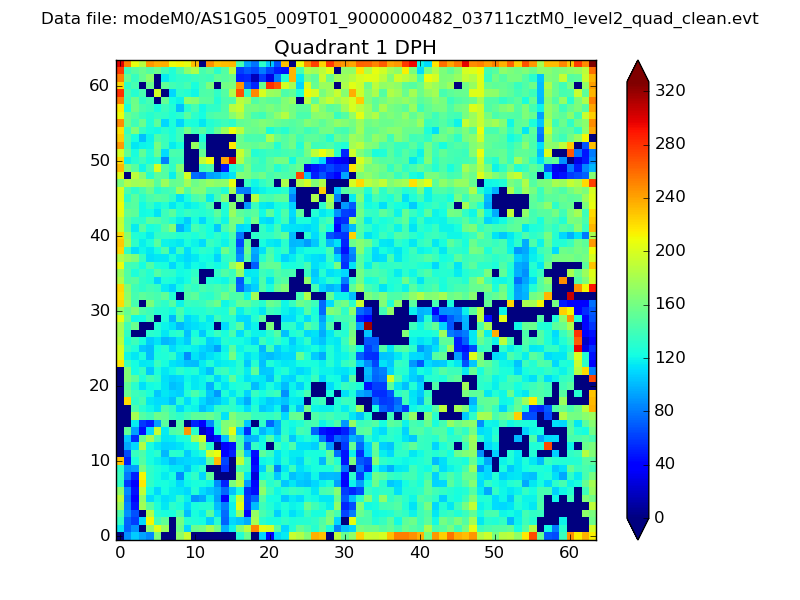 |
Quadrant B |
|---|---|---|---|
| Quadrant D | 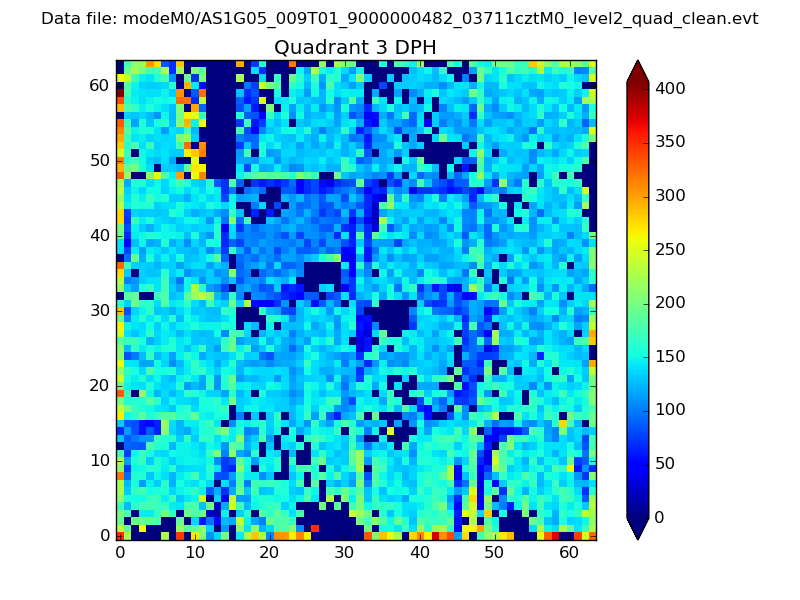 |
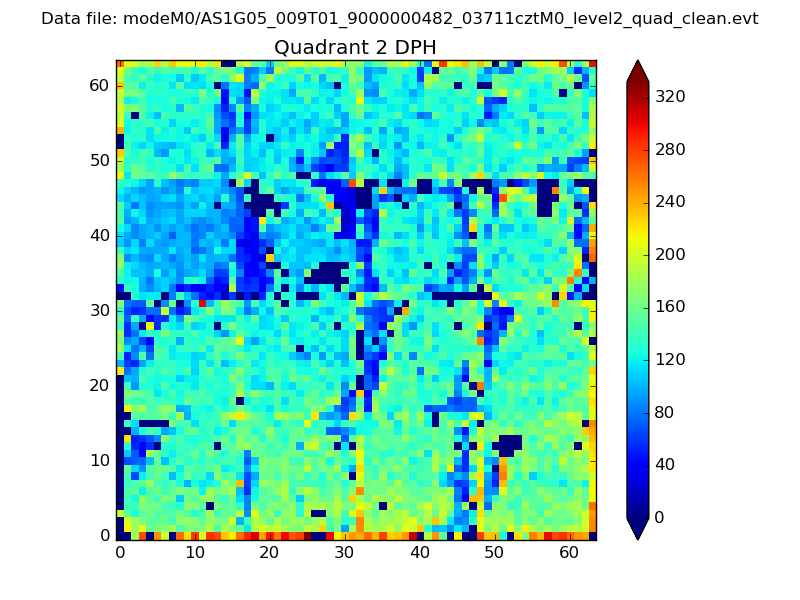 |
Quadrant C |
| Plot type | Count rate plots | Images |
|---|---|---|
| Comparison with Poisson distribution Blue bars denote a histogram of data divided into 1 sec bins. Red curve is a Poisson curve with rate = median count rate of data. |
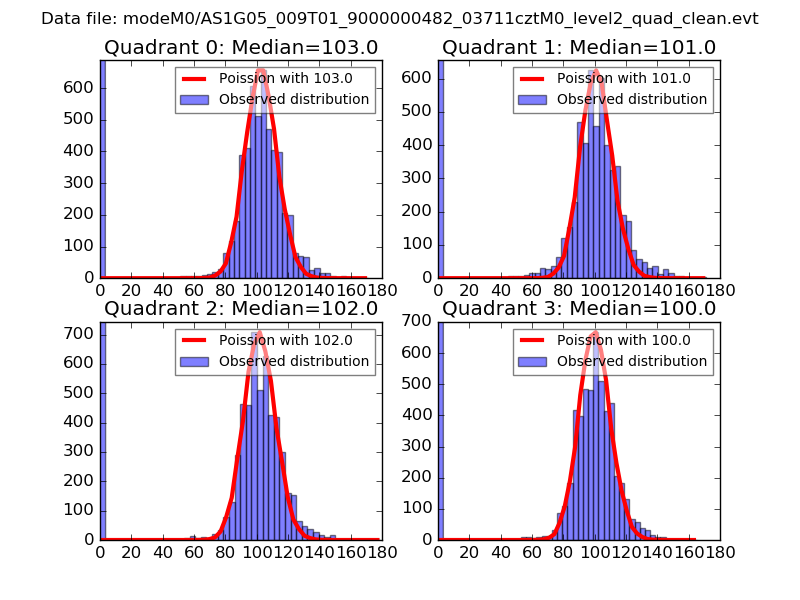 |
 |
| Quadrant-wise count rates Data is divided into 100 sec bins |
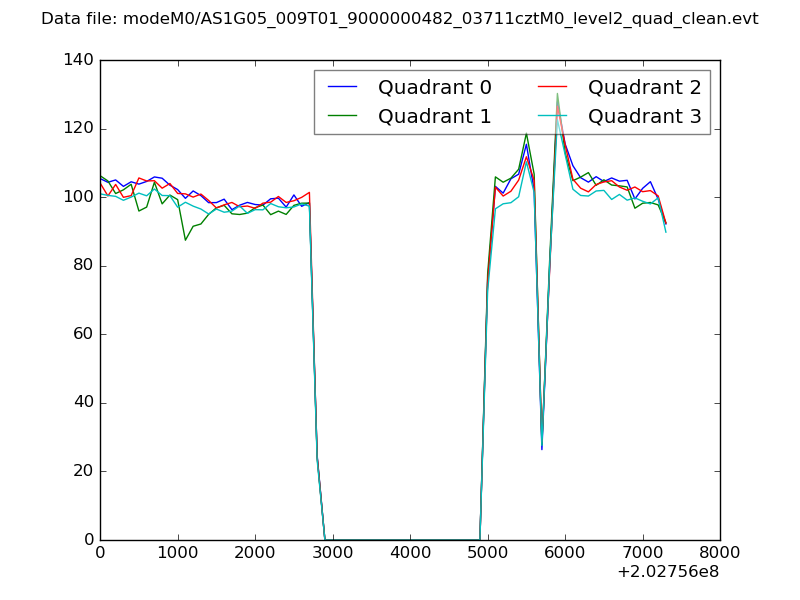 |
|
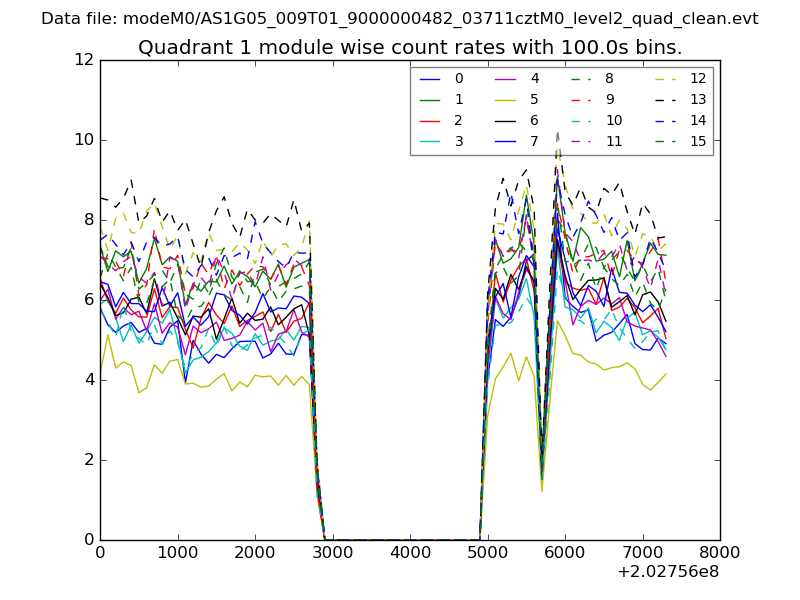
| Module-wise count rates for Quadrant A Data is divided into 100 sec bins |
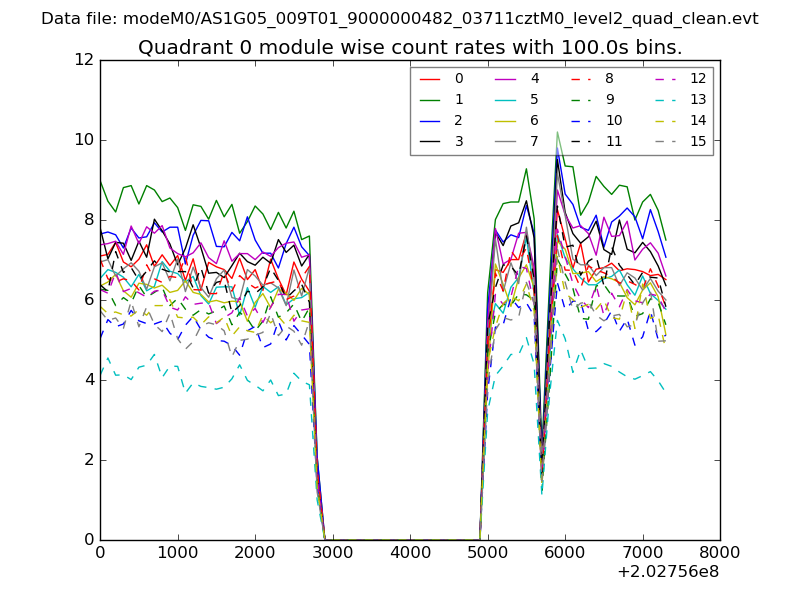 |
 |
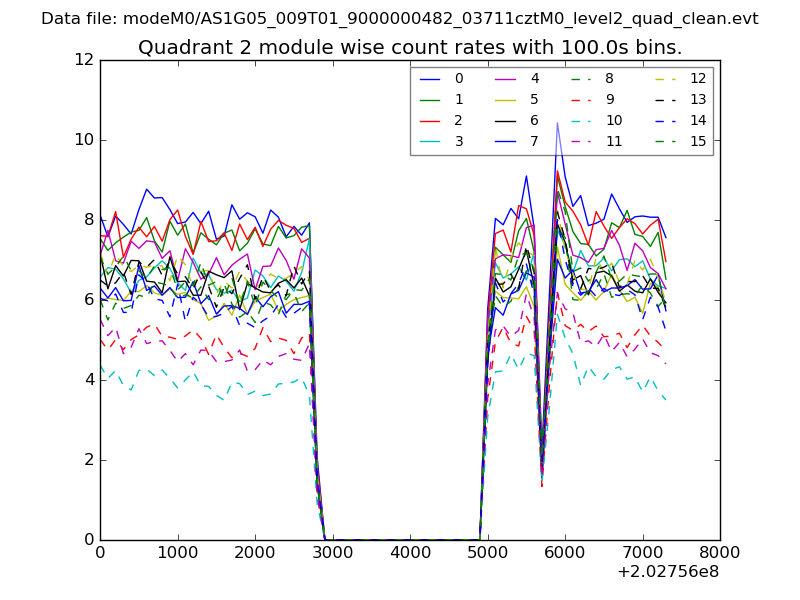
| Module-wise count rates for Quadrant B Data is divided into 100 sec bins |
 |
 |
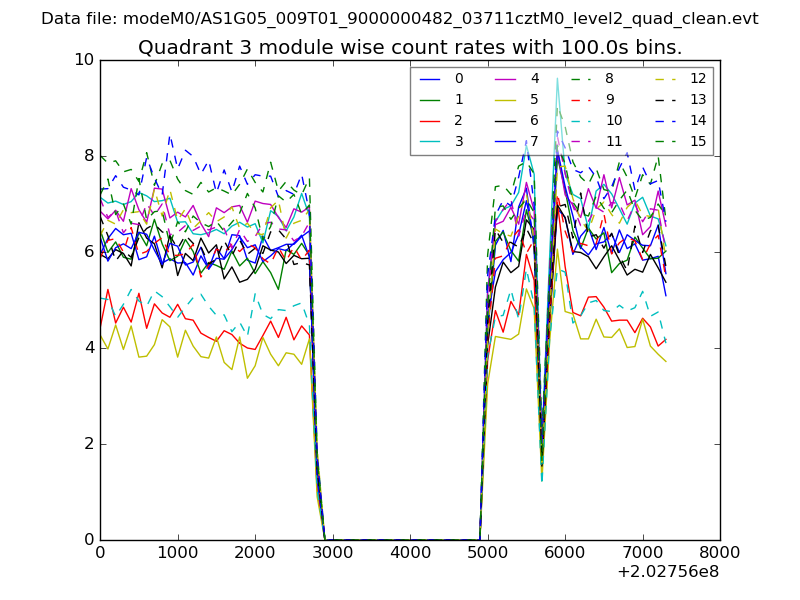
| Module-wise count rates for Quadrant C Data is divided into 100 sec bins |
 |
 |
| Module-wise count rates for Quadrant D Data is divided into 100 sec bins |
 |
 |
| Parameter | Plot |
|---|---|
| CZT HV Monitor |  |
| D_VDD | 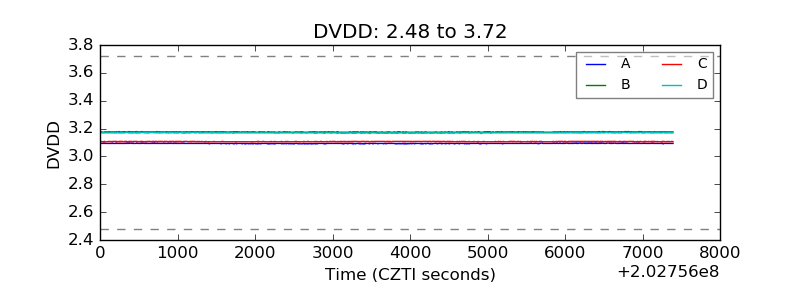 |
| Temperature 1 | 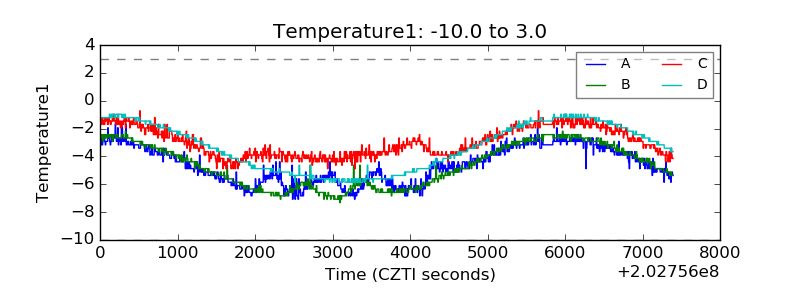 |
| Veto HV Monitor | 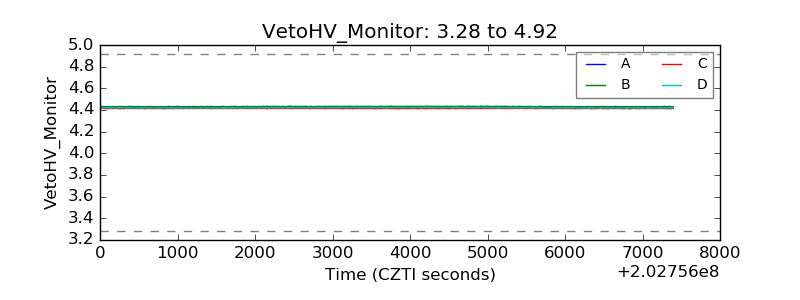 |
| Veto LLD | 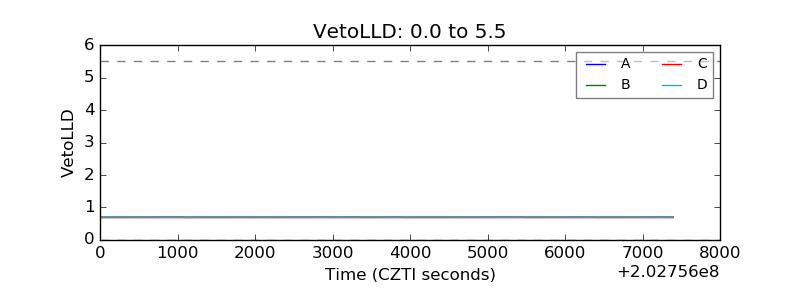 |
| Alpha Counter | 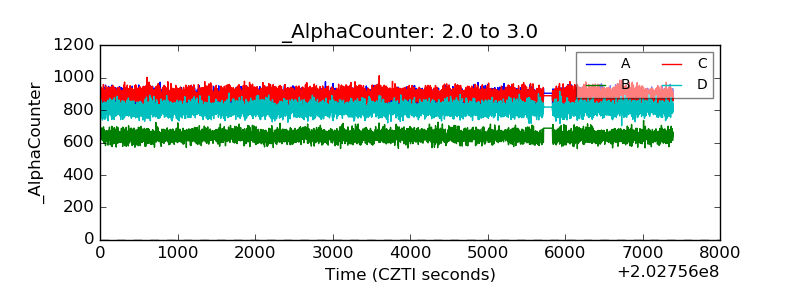 |
| _CPM_Rate | 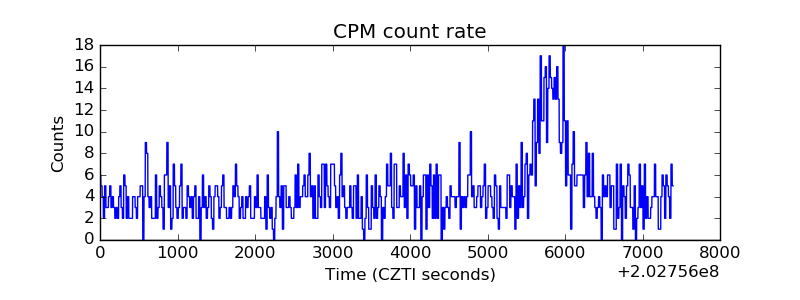 |
| CZT Counter | 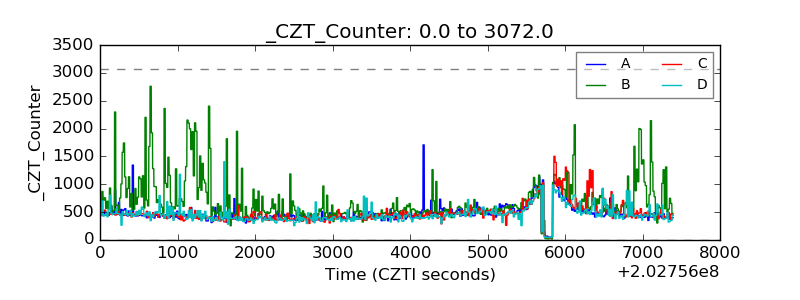 |
| +2.5 Volts monitor |  |
| +5 Volts monitor |  |
| Veto Counter | 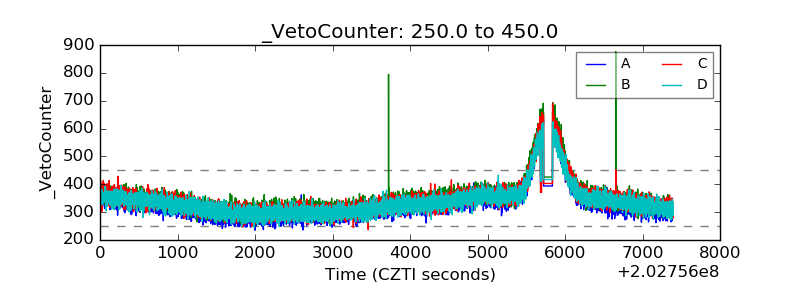 |