| Param | Original file | Final file |
|---|---|---|
| Filename | modeM0/AS1G05_182T01_9000000484cztM0_level2.fits | modeM0/AS1G05_182T01_9000000484cztM0_level2_quad_clean.evt |
| Size (bytes) | 452,027,520 | 476,236,800 |
| Size | 431.1 MB | 454.2 MB |
| Events in quadrant A | 2,757,476 | 3,024,418 |
| Events in quadrant B | 2,671,986 | 2,960,549 |
| Events in quadrant C | 2,405,952 | 2,247,211 |
| Events in quadrant D | 2,393,152 | 2,739,022 |
| Mode SS | |||
|---|---|---|---|
| Quadrant | BADHDUFLAG | Total packets | Discarded packets |
| A | 0 | 1028 | 0 |
| B | 0 | 1028 | 0 |
| C | 0 | 1028 | 0 |
| D | 0 | 1028 | 0 |
| Mode M9 | |||
|---|---|---|---|
| Quadrant | BADHDUFLAG | Total packets | Discarded packets |
| A | 0 | 94 | 0 |
| B | 0 | 94 | 0 |
| C | 0 | 94 | 0 |
| D | 0 | 94 | 0 |
| Mode M0 | |||
|---|---|---|---|
| Quadrant | BADHDUFLAG | Total packets | Discarded packets |
| A | 0 | 120137 | 0 |
| B | 0 | 125356 | 0 |
| C | 0 | 202535 | 0 |
| D | 0 | 108777 | 0 |
| Quadrant | Total seconds | Saturated seconds | Saturation percentage |
|---|---|---|---|
| A | 50294 | 2464 | 4.899193% |
| B | 50294 | 2642 | 5.253112% |
| C | 50294 | 15377 | 30.574224% |
| D | 50294 | 678 | 1.348073% |
Noise dominated data is calculated using 1-second bins in cleaned event files. If a bin has >2000 counts, and if more than 50% of those come from <1% of pixels, then it is considered to be noise-dominated and hence unusable.
| Quadrant | # 1 sec bins | Bins with >0 counts | Bins with >2000 counts | High rate bins dominated by noise | Noise dominated (total time) | Noise dominated (detector-on time) | Marked lightcurve |
|---|---|---|---|---|---|---|---|
| A | 59819 | 50048 | 0 | 0 | 0.00% | 0.00% | 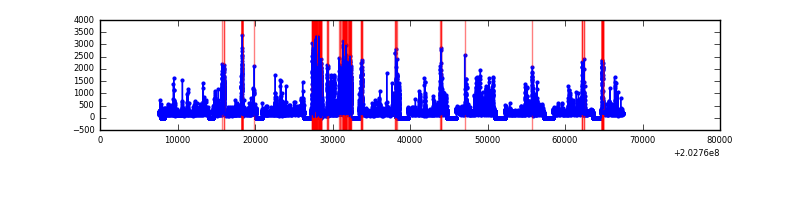 |
| B | 59819 | 50283 | 0 | 0 | 0.00% | 0.00% | 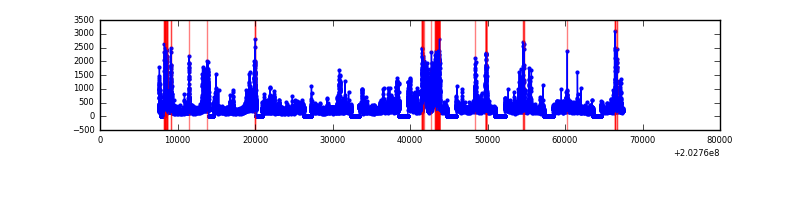 |
| C | 59819 | 50285 | 0 | 0 | 0.00% | 0.00% | 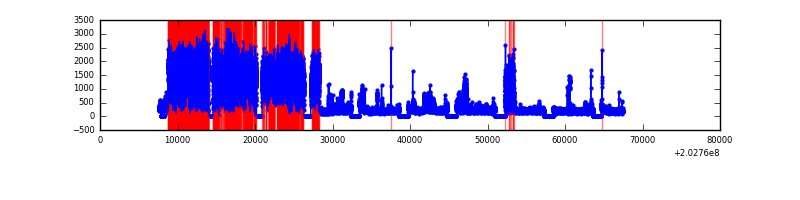 |
| D | 59818 | 50275 | 0 | 0 | 0.00% | 0.00% | 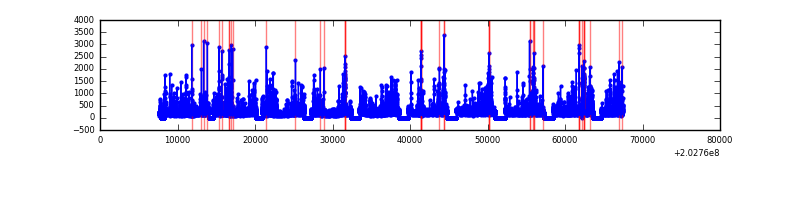 |
Top three noisy pixels from each quadrant. If the there are fewer than three noisy pixels in the level2.evt file, extra rows are filled as -1
| Pixel properties | Quadrant properties | ||||||
|---|---|---|---|---|---|---|---|
| Quadrant | DetID | PixID | Counts | Sigma | Mean | Median | Sigma |
| A | 0 | 29 | 2641 | 10.55 | 718 | 667 | 187.1 |
| A | 7 | 110 | 2250 | 8.46 | 718 | 667 | 187.1 |
| A | 0 | 30 | 2061 | 7.45 | 718 | 667 | 187.1 |
| B | 2 | 9 | 2243 | 10.84 | 705 | 669 | 145.2 |
| B | 12 | 226 | 2060 | 9.58 | 705 | 669 | 145.2 |
| B | 14 | 254 | 1858 | 8.19 | 705 | 669 | 145.2 |
| C | 1 | 80 | 1685 | 6.38 | 635 | 584 | 172.6 |
| C | 1 | 81 | 1636 | 6.1 | 635 | 584 | 172.6 |
| C | 9 | 188 | 1619 | 6.0 | 635 | 584 | 172.6 |
| D | 11 | 82 | 1997 | 7.4 | 684 | 618 | 186.4 |
| D | 6 | 231 | 1731 | 5.97 | 684 | 618 | 186.4 |
| D | 7 | 3 | 1705 | 5.83 | 684 | 618 | 186.4 |
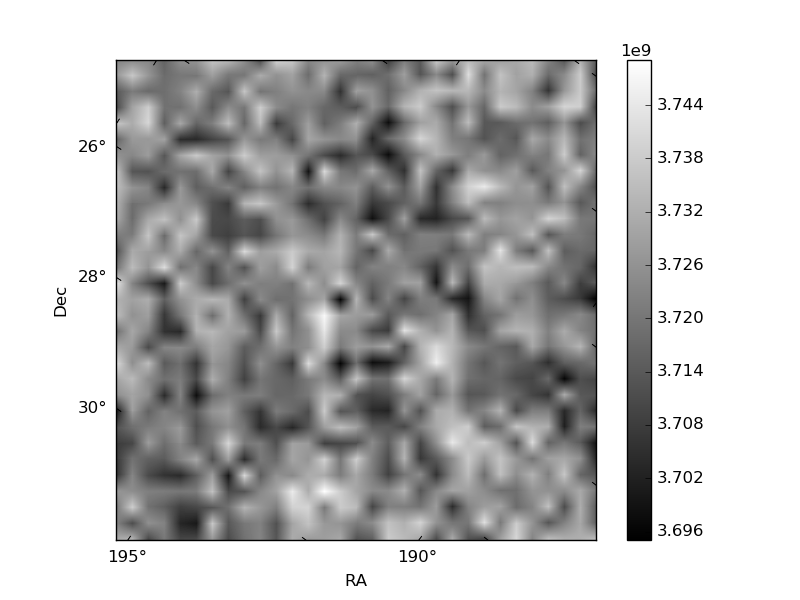
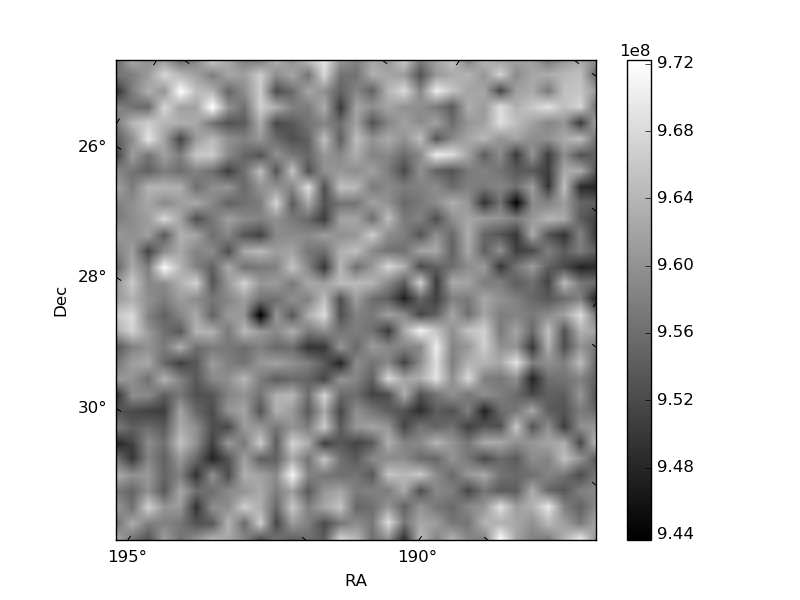
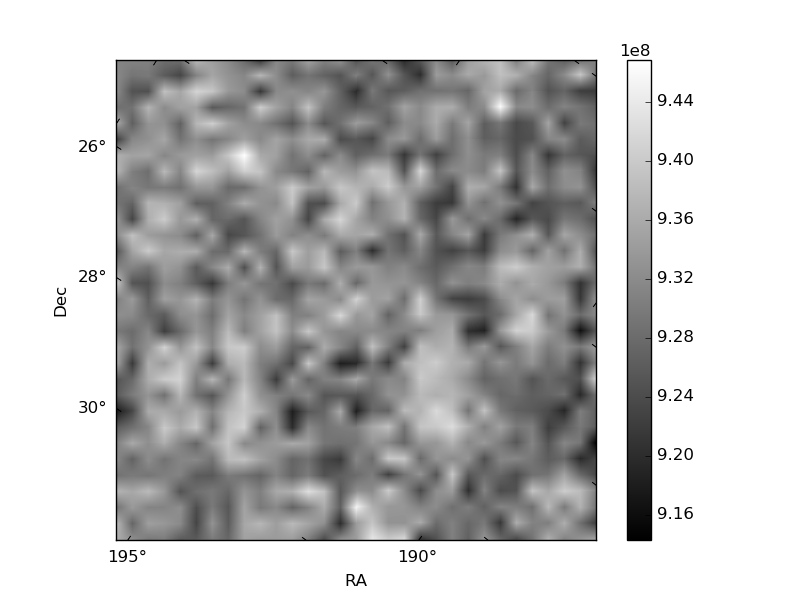
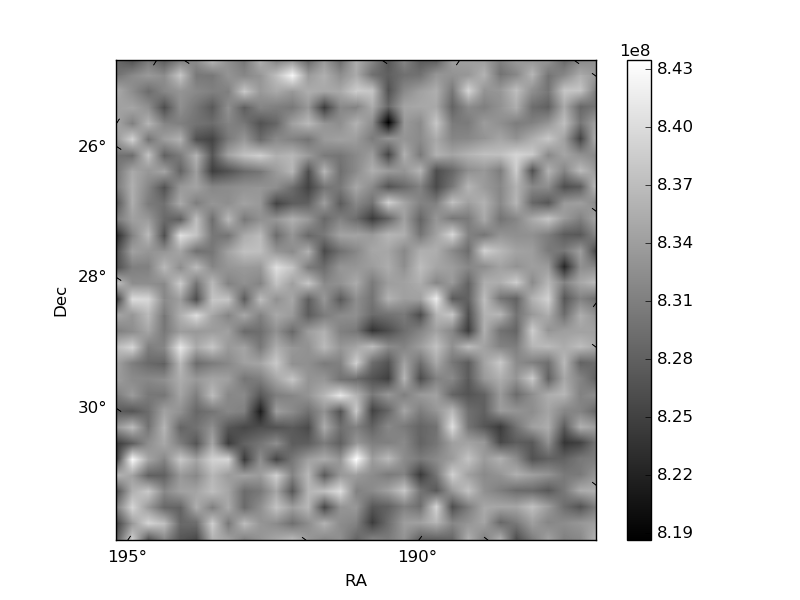
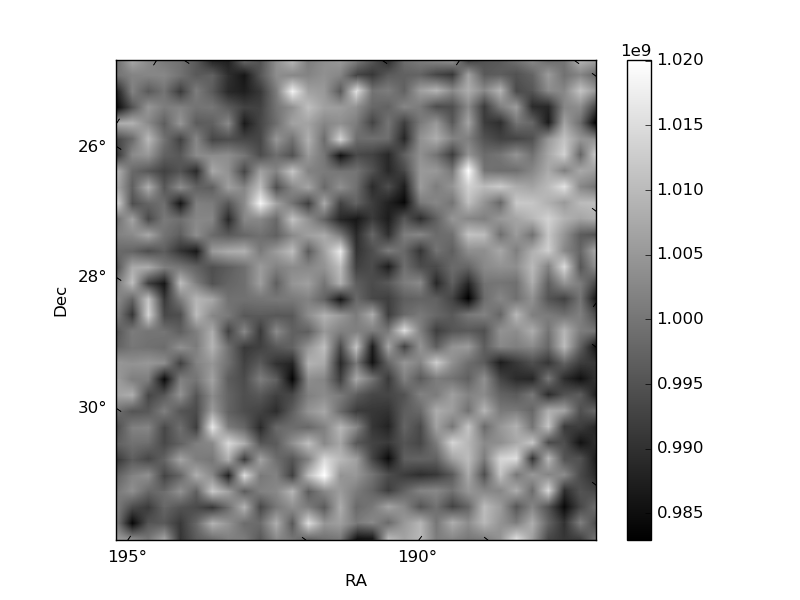
Histogram calculated using DETX and DETY for each event in the final _common_clean file
| Quadrant A | 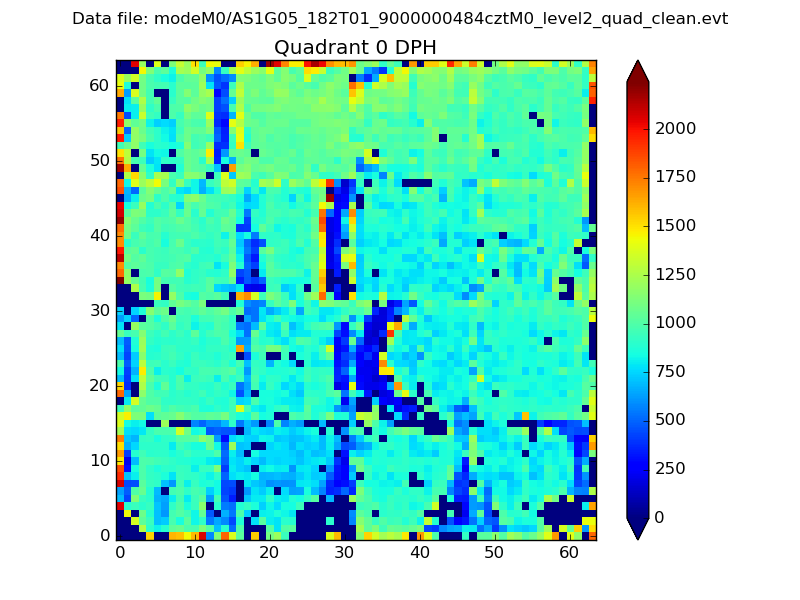 |
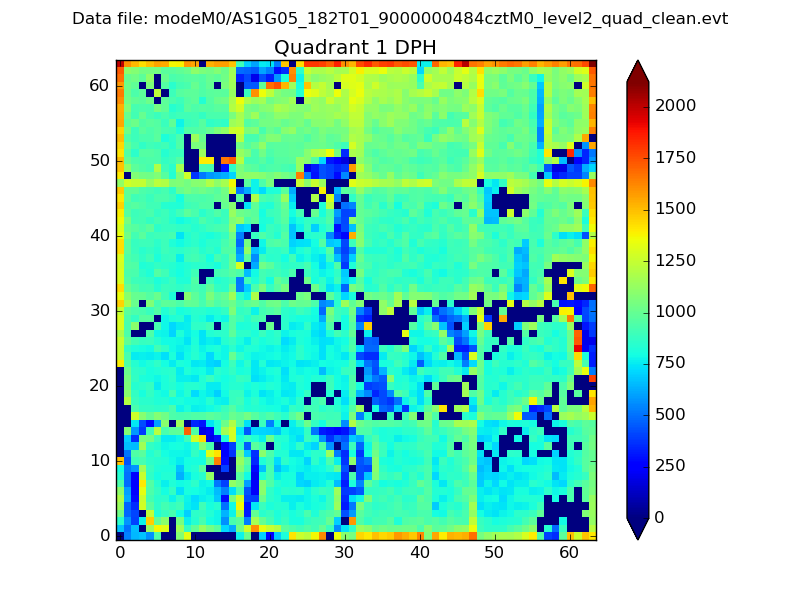 |
Quadrant B |
|---|---|---|---|
| Quadrant D | 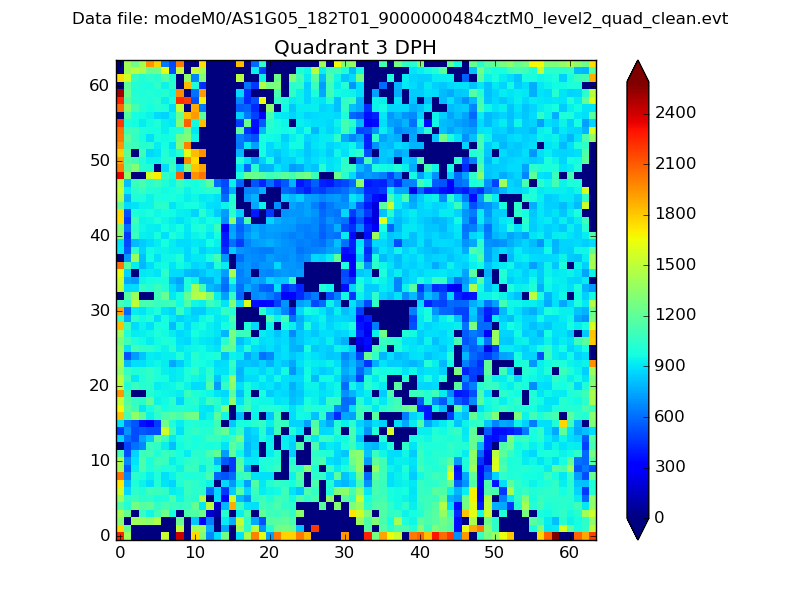 |
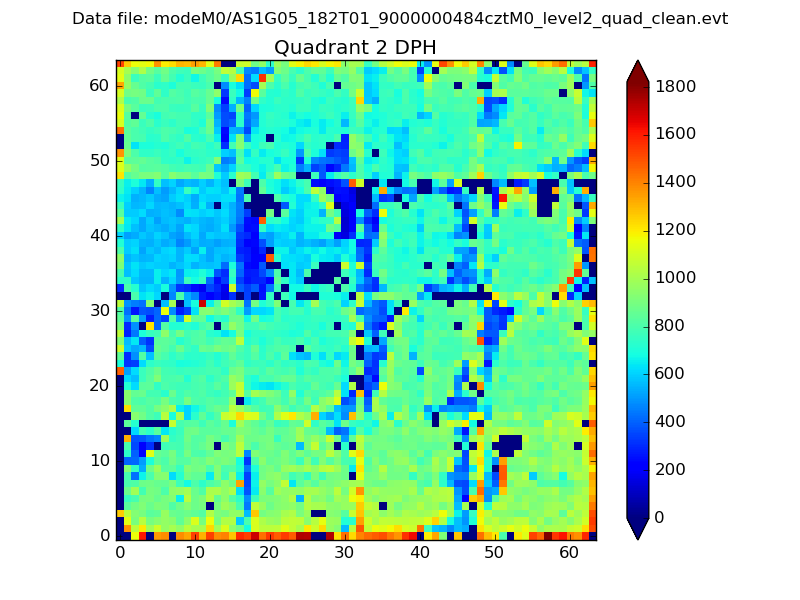 |
Quadrant C |
| Plot type | Count rate plots | Images |
|---|---|---|
| Comparison with Poisson distribution Blue bars denote a histogram of data divided into 1 sec bins. Red curve is a Poisson curve with rate = median count rate of data. |
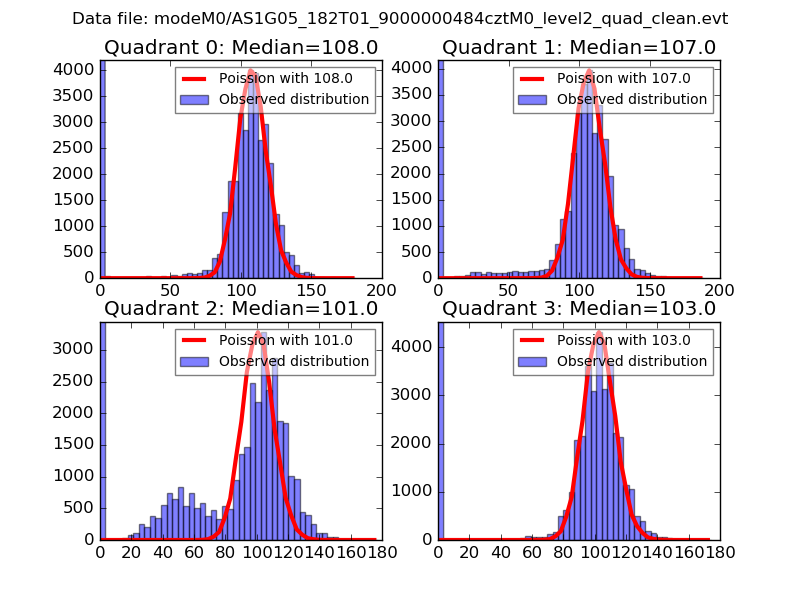 |
 |
| Quadrant-wise count rates Data is divided into 100 sec bins |
 |
|
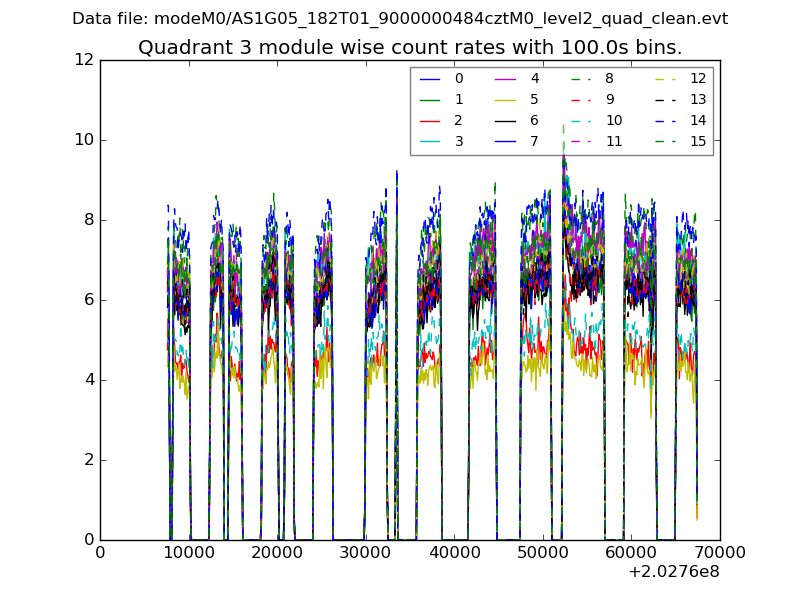
| Module-wise count rates for Quadrant A Data is divided into 100 sec bins |
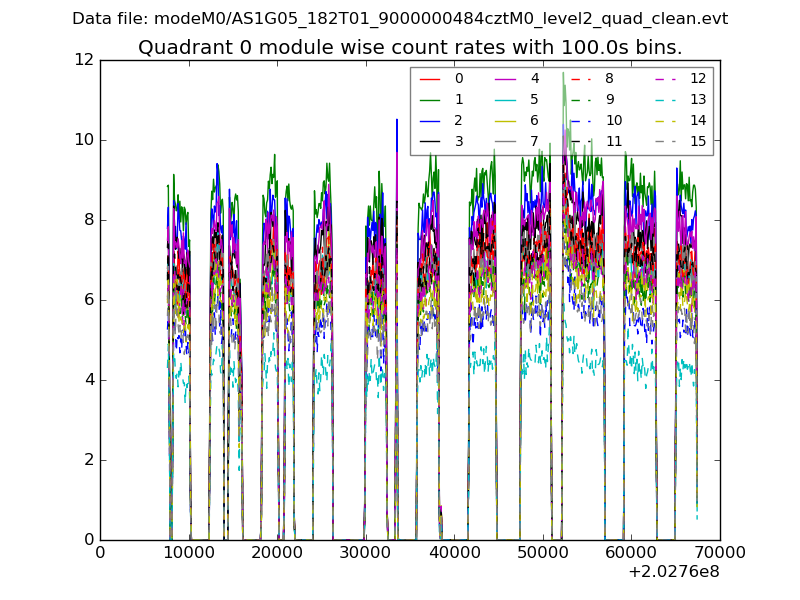 |
 |
| Module-wise count rates for Quadrant B Data is divided into 100 sec bins |
 |
 |
| Module-wise count rates for Quadrant C Data is divided into 100 sec bins |
 |
 |
| Module-wise count rates for Quadrant D Data is divided into 100 sec bins |
 |
 |
| Parameter | Plot |
|---|---|
| CZT HV Monitor |  |
| D_VDD | 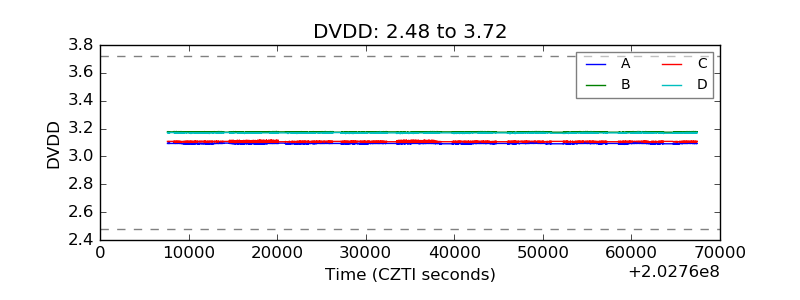 |
| Temperature 1 |  |
| Veto HV Monitor | 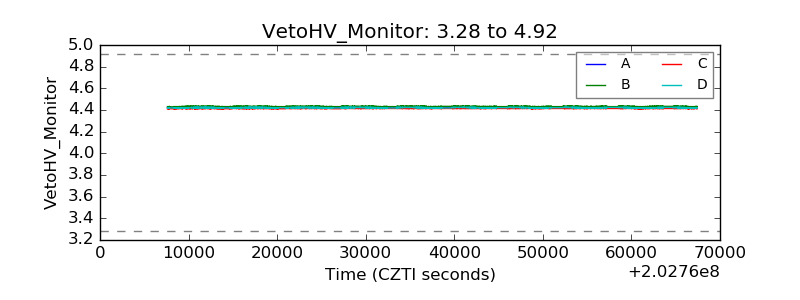 |
| Veto LLD | 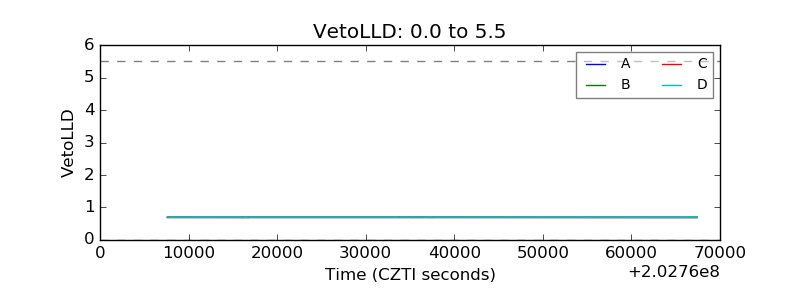 |
| Alpha Counter | 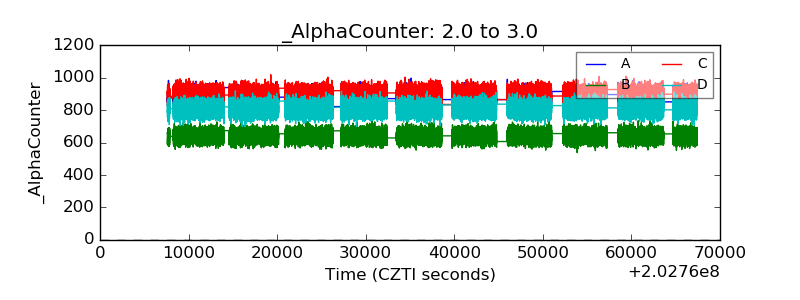 |
| _CPM_Rate | 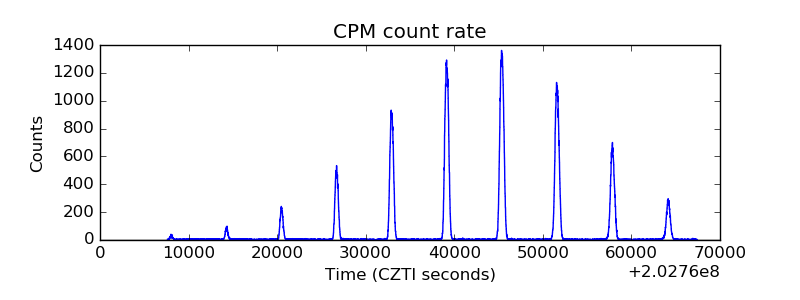 |
| CZT Counter |  |
| +2.5 Volts monitor | 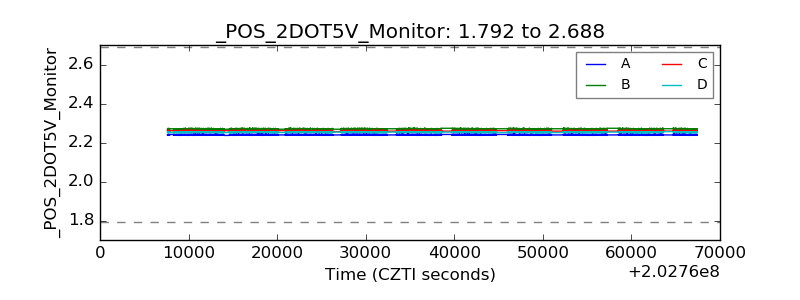 |
| +5 Volts monitor | 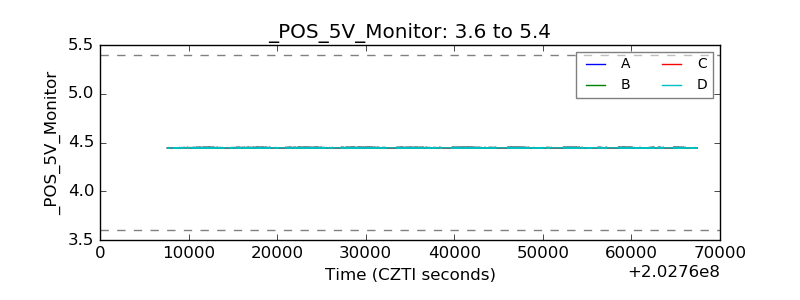 |
| _ROLL_ROT |  |
| _Roll_DEC |  |
| _Roll_RA | 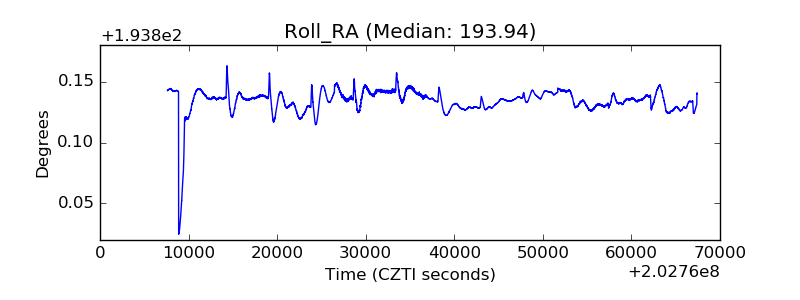 |
| Veto Counter | 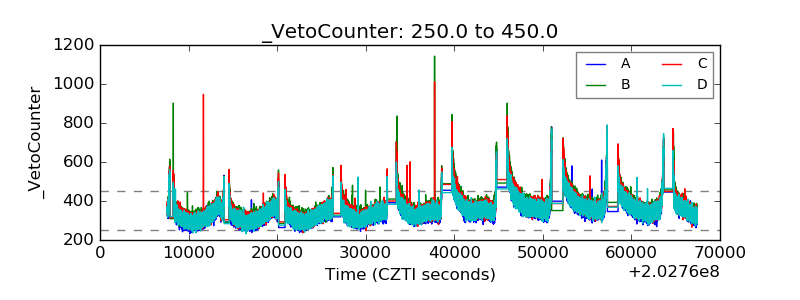 |