| Param | Original file | Final file |
|---|---|---|
| Filename | modeM0/AS1G05_182T01_9000000484_03713cztM0_level2.evt | modeM0/AS1G05_182T01_9000000484_03713cztM0_level2_quad_clean.evt |
| Size (bytes) | 708,024,960 | 58,867,200 |
| Size | 675.2 MB | 56.1 MB |
| Events in quadrant A | 2,735,396 | 375,984 |
| Events in quadrant B | 3,348,243 | 371,990 |
| Events in quadrant C | 12,255,441 | 261,452 |
| Events in quadrant D | 2,706,867 | 362,996 |
| Mode SS | |||
|---|---|---|---|
| Quadrant | BADHDUFLAG | Total packets | Discarded packets |
| A | 0 | 118 | 0 |
| B | 0 | 118 | 0 |
| C | 0 | 118 | 0 |
| D | 0 | 118 | 0 |
| Mode M9 | |||
|---|---|---|---|
| Quadrant | BADHDUFLAG | Total packets | Discarded packets |
| A | 0 | 4 | 0 |
| B | 0 | 4 | 0 |
| C | 0 | 4 | 0 |
| D | 0 | 4 | 0 |
| Mode M0 | |||
|---|---|---|---|
| Quadrant | BADHDUFLAG | Total packets | Discarded packets |
| A | 0 | 12229 | 2 |
| B | 0 | 14130 | 1 |
| C | 0 | 40374 | 1 |
| D | 0 | 12442 | 1 |
| Quadrant | Total seconds | Saturated seconds | Saturation percentage |
|---|---|---|---|
| A | 5849 | 40 | 0.683878% |
| B | 5849 | 125 | 2.137117% |
| C | 5849 | 4540 | 77.620106% |
| D | 5849 | 28 | 0.478714% |
Noise dominated data is calculated using 1-second bins in cleaned event files. If a bin has >2000 counts, and if more than 50% of those come from <1% of pixels, then it is considered to be noise-dominated and hence unusable.
| Quadrant | # 1 sec bins | Bins with >0 counts | Bins with >2000 counts | High rate bins dominated by noise | Noise dominated (total time) | Noise dominated (detector-on time) | Marked lightcurve |
|---|---|---|---|---|---|---|---|
| A | 6249 | 5850 | 11 | 11 | 0.18% | 0.19% | 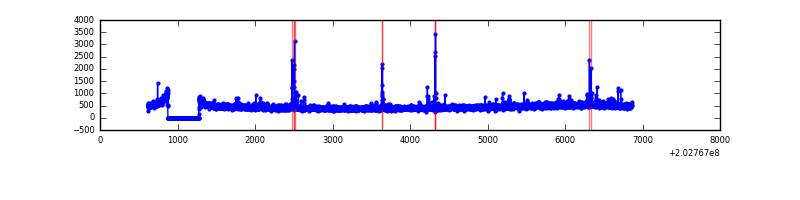 |
| B | 6249 | 5850 | 49 | 49 | 0.78% | 0.84% | 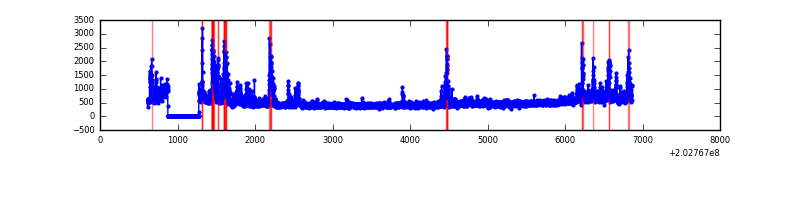 |
| C | 6248 | 5849 | 3969 | 3969 | 63.52% | 67.86% | 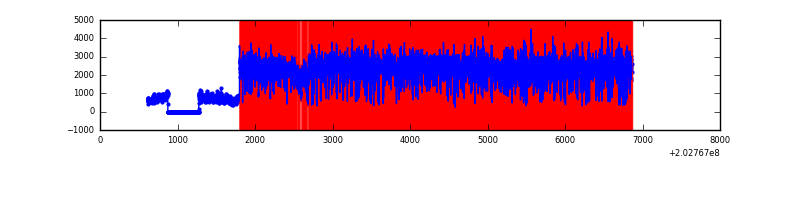 |
| D | 6249 | 5850 | 20 | 20 | 0.32% | 0.34% | 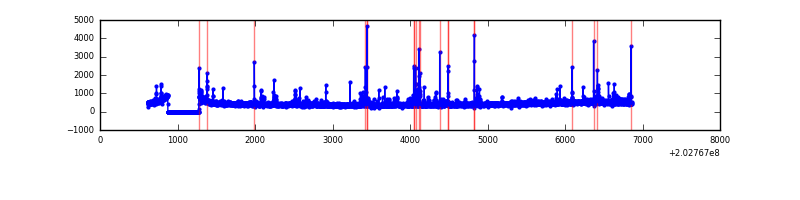 |
Top three noisy pixels from each quadrant. If the there are fewer than three noisy pixels in the level2.evt file, extra rows are filled as -1
| Pixel properties | Quadrant properties | ||||||
|---|---|---|---|---|---|---|---|
| Quadrant | DetID | PixID | Counts | Sigma | Mean | Median | Sigma |
| A | 8 | 15 | 59732 | 427.01 | 669 | 654 | 138.4 |
| A | 0 | 50 | 28653 | 202.37 | 669 | 654 | 138.4 |
| A | 0 | 118 | 27077 | 190.98 | 669 | 654 | 138.4 |
| B | 14 | 167 | 422610 | 3121.23 | 679 | 660 | 135.2 |
| B | 15 | 204 | 147432 | 1085.69 | 679 | 660 | 135.2 |
| B | 5 | 70 | 67153 | 491.86 | 679 | 660 | 135.2 |
| C | 2 | 53 | 10332094 | 88941.95 | 490 | 492 | 116.2 |
| C | 13 | 61 | 4046 | 30.6 | 490 | 492 | 116.2 |
| C | 1 | 16 | 2357 | 16.06 | 490 | 492 | 116.2 |
| D | 13 | 239 | 88781 | 548.87 | 651 | 633 | 160.6 |
| D | 5 | 233 | 40121 | 245.88 | 651 | 633 | 160.6 |
| D | 14 | 34 | 22349 | 135.22 | 651 | 633 | 160.6 |
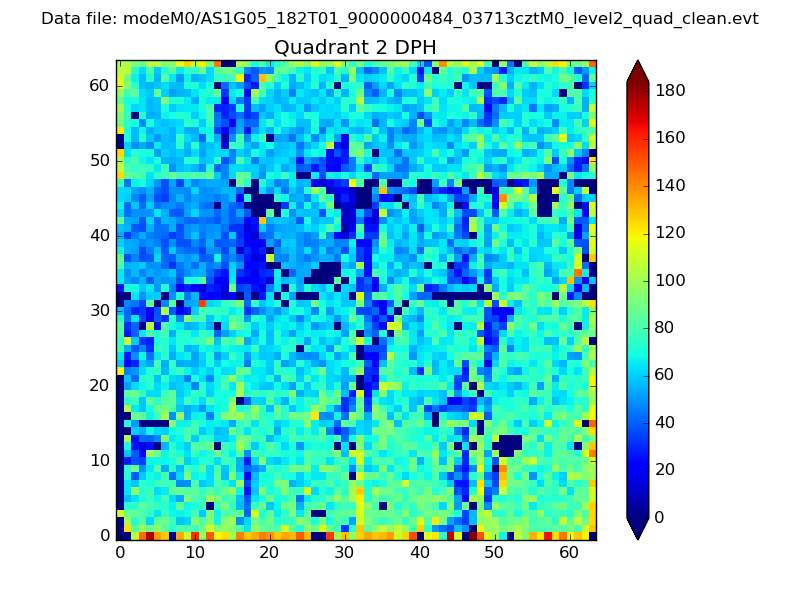
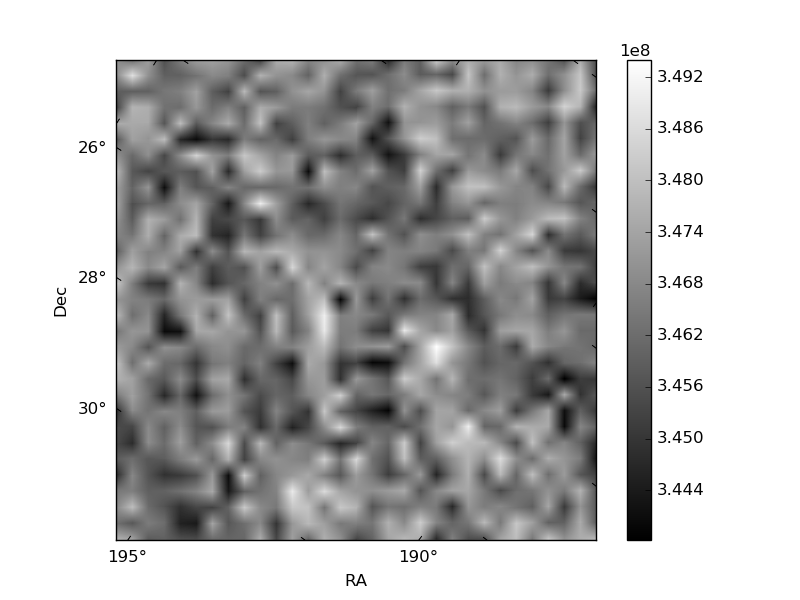
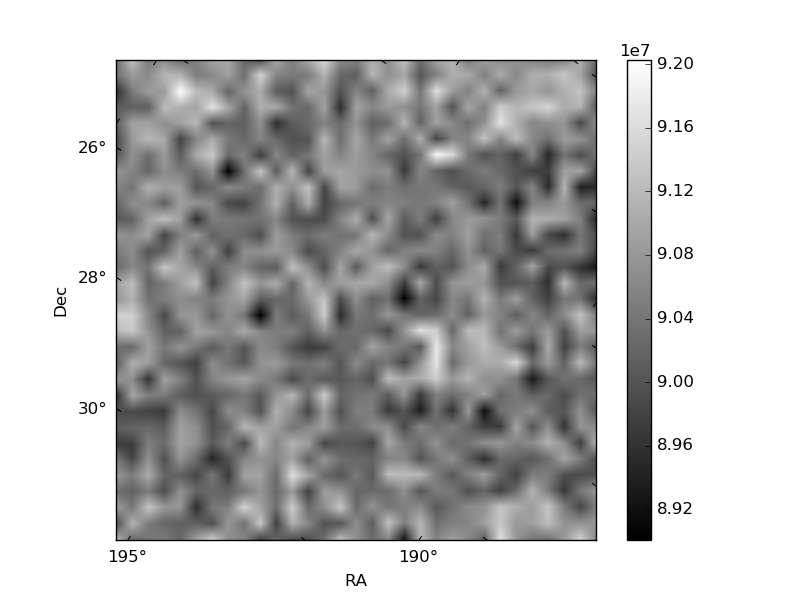
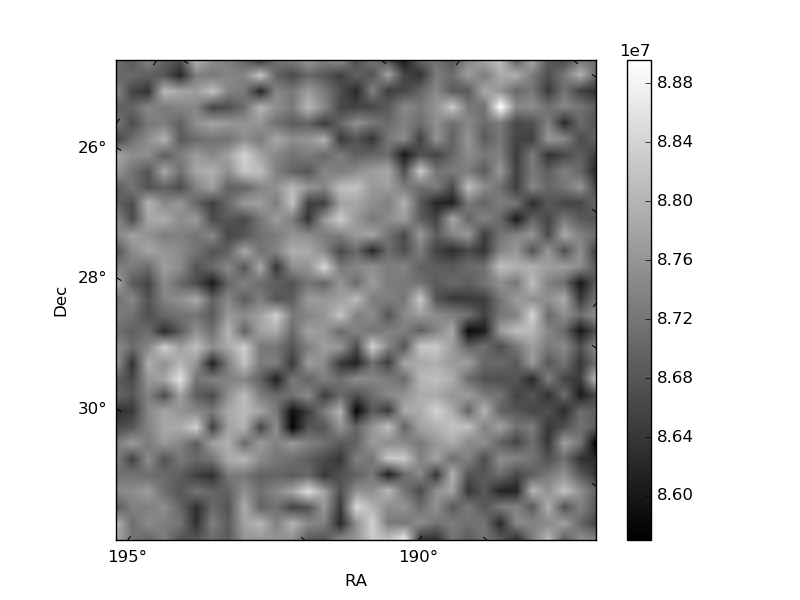
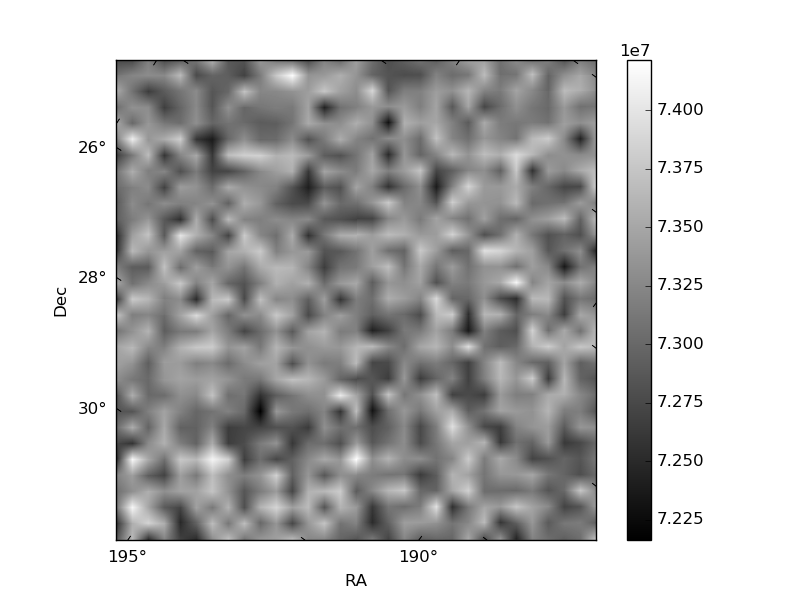
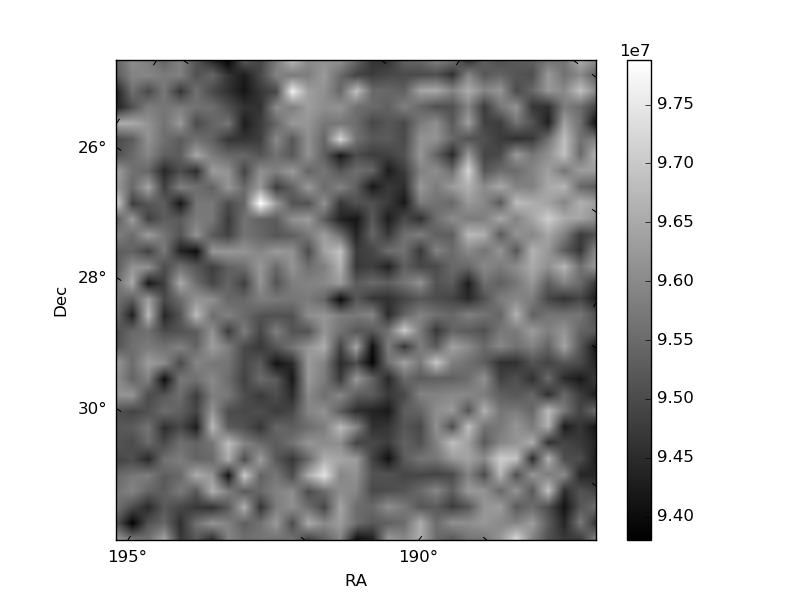
Histogram calculated using DETX and DETY for each event in the final _common_clean file
| Quadrant A | 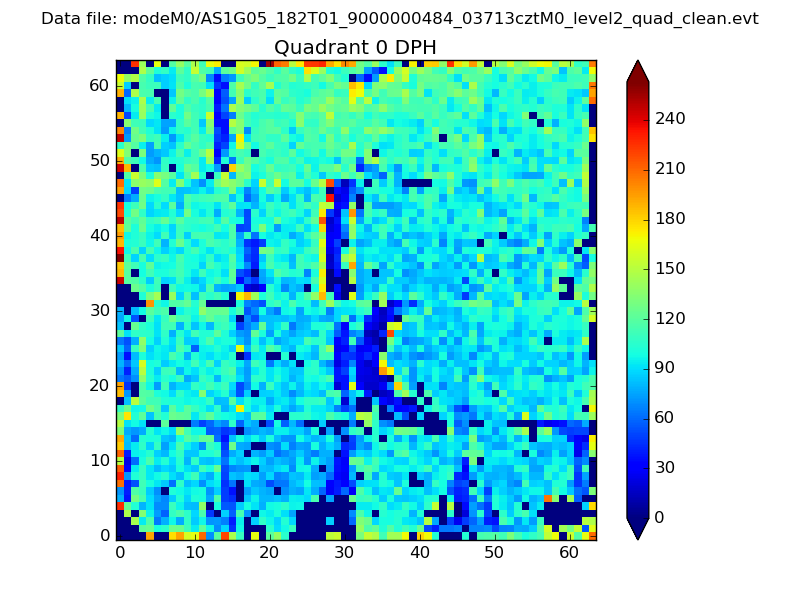 |
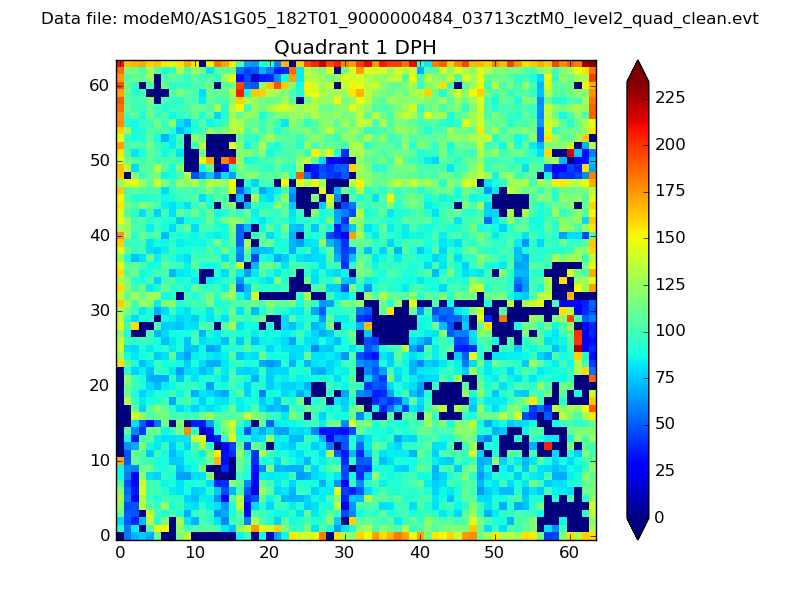 |
Quadrant B |
|---|---|---|---|
| Quadrant D | 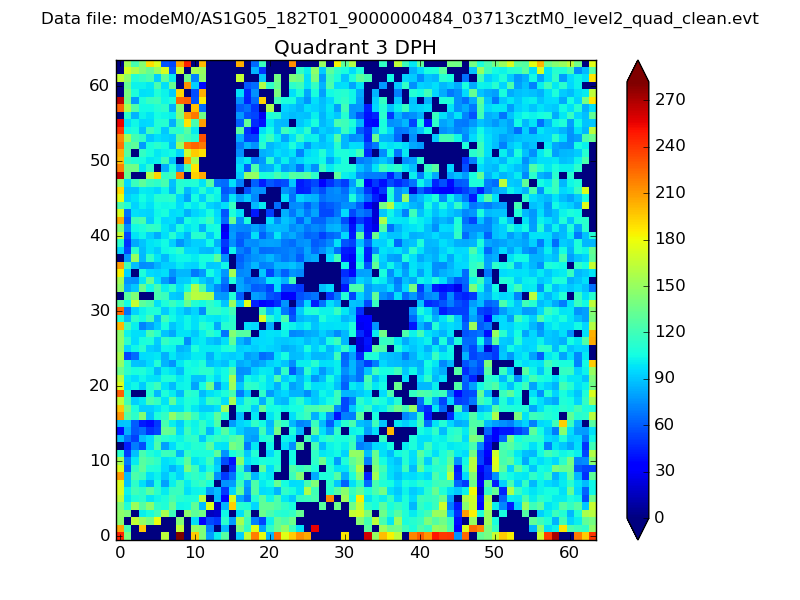 |
 |
Quadrant C |
| Plot type | Count rate plots | Images |
|---|---|---|
| Comparison with Poisson distribution Blue bars denote a histogram of data divided into 1 sec bins. Red curve is a Poisson curve with rate = median count rate of data. |
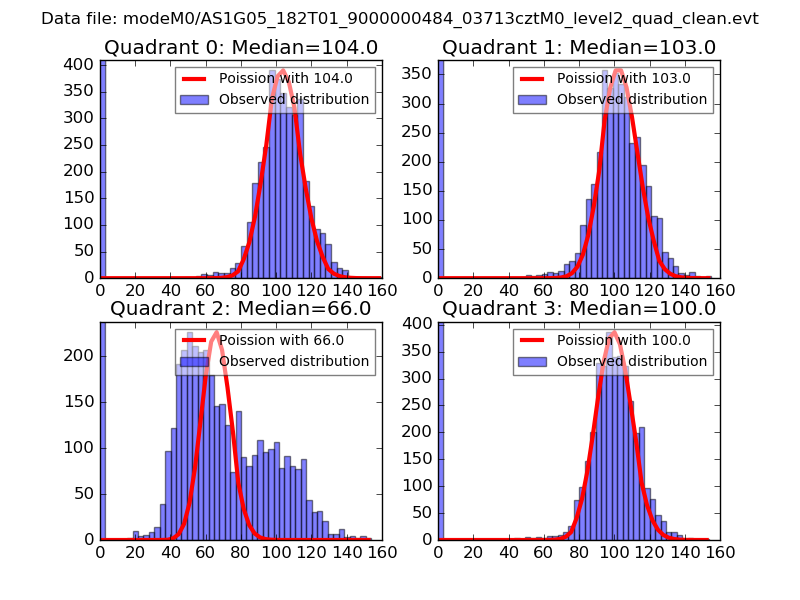 |
 |
| Quadrant-wise count rates Data is divided into 100 sec bins |
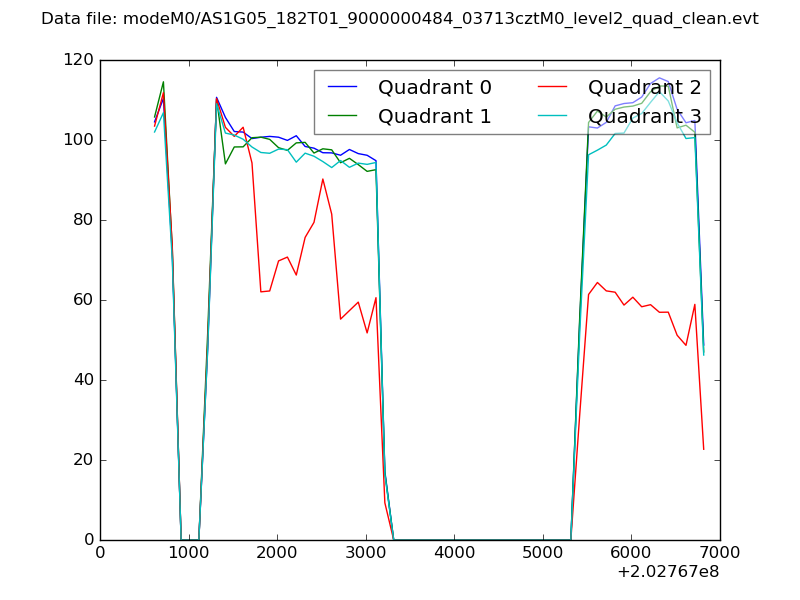 |
|
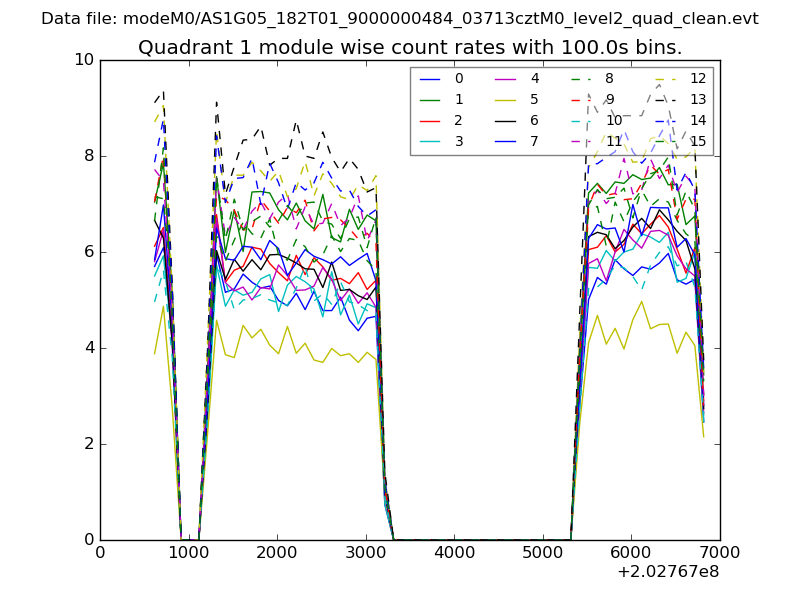
| Module-wise count rates for Quadrant A Data is divided into 100 sec bins |
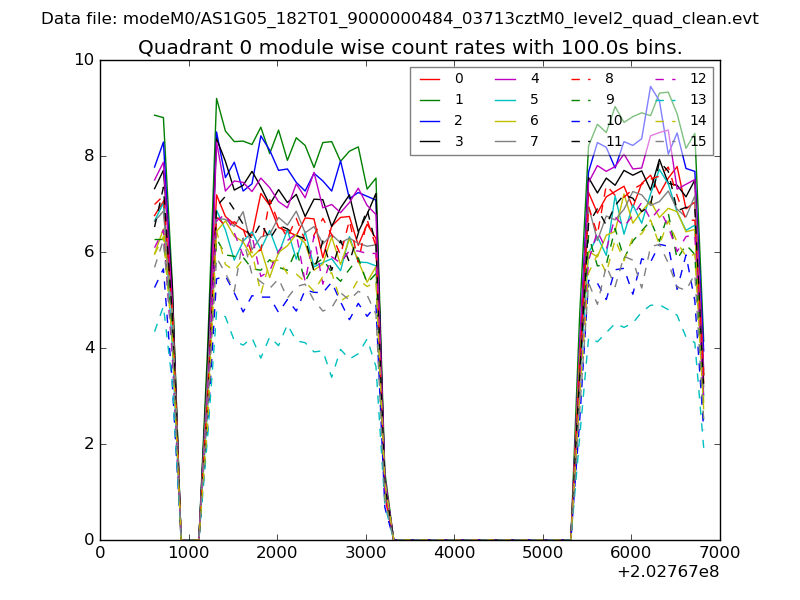 |
 |
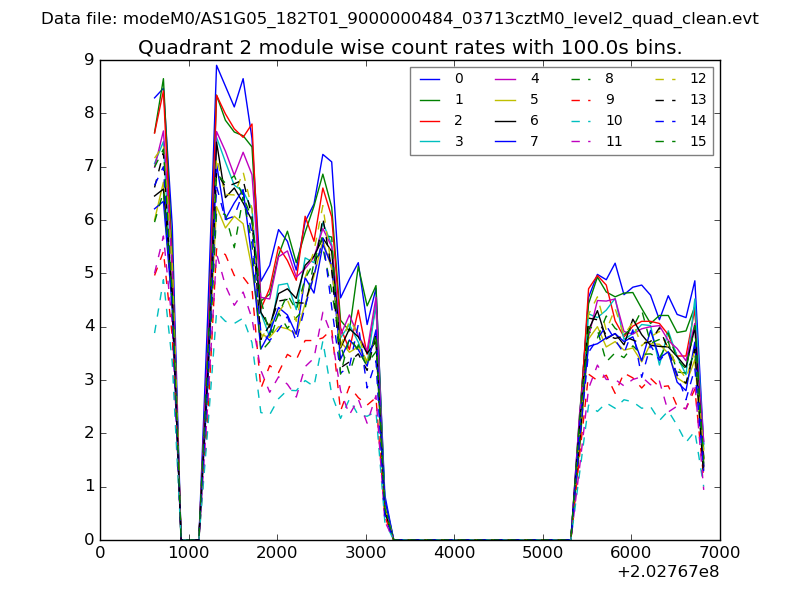
| Module-wise count rates for Quadrant B Data is divided into 100 sec bins |
 |
 |
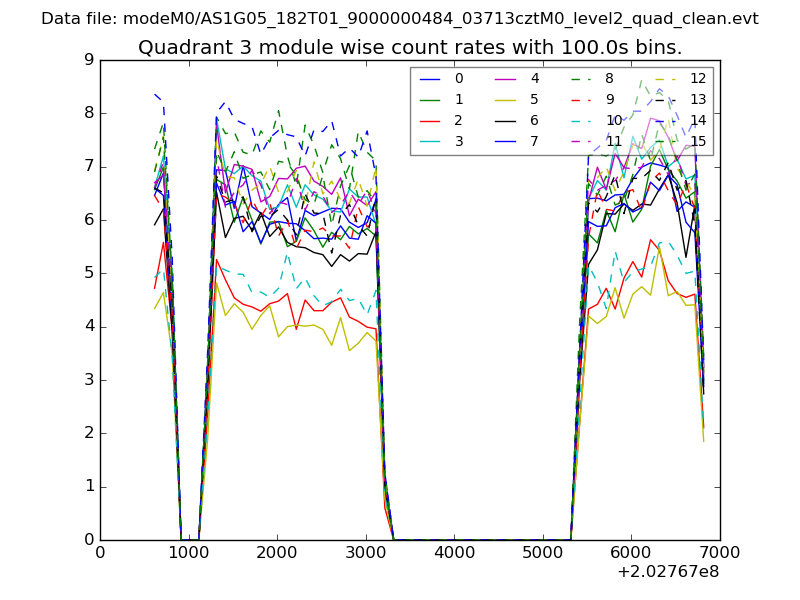
| Module-wise count rates for Quadrant C Data is divided into 100 sec bins |
 |
 |
| Module-wise count rates for Quadrant D Data is divided into 100 sec bins |
 |
 |
| Parameter | Plot |
|---|---|
| CZT HV Monitor | 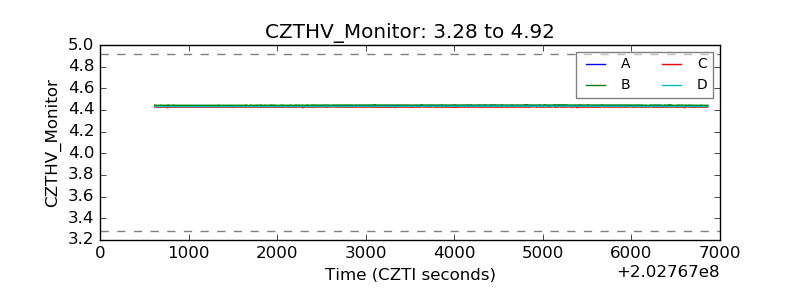 |
| D_VDD | 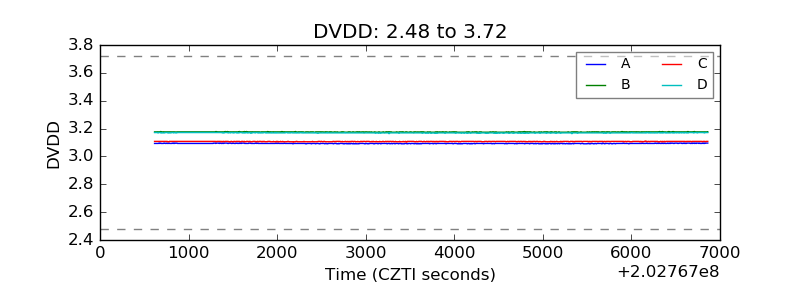 |
| Temperature 1 | 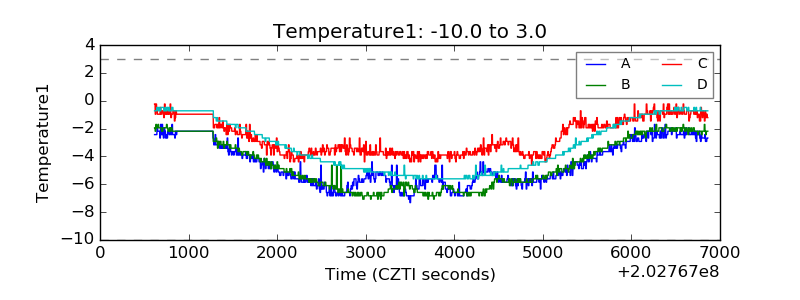 |
| Veto HV Monitor | 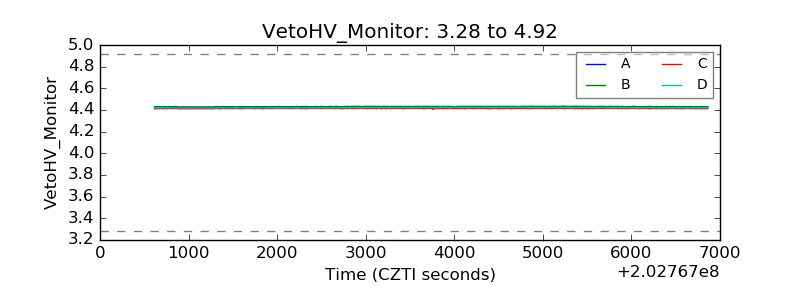 |
| Veto LLD | 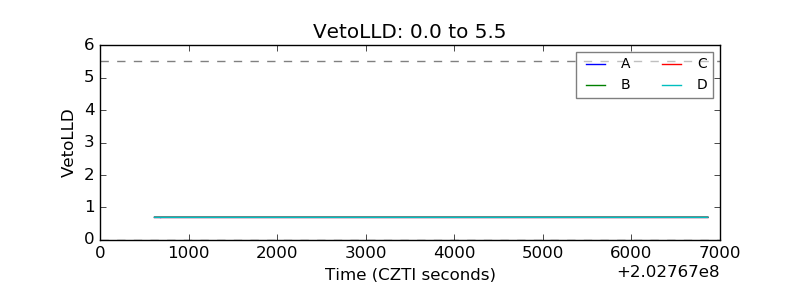 |
| Alpha Counter | 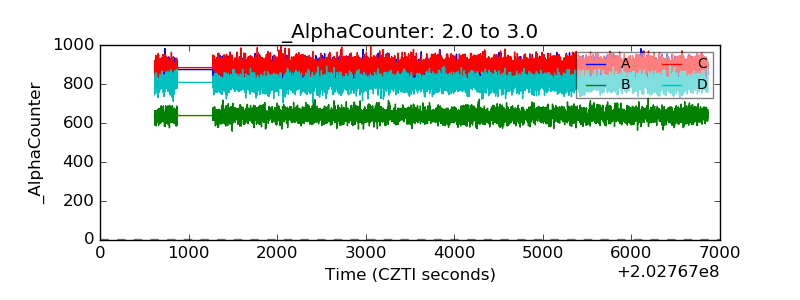 |
| _CPM_Rate | 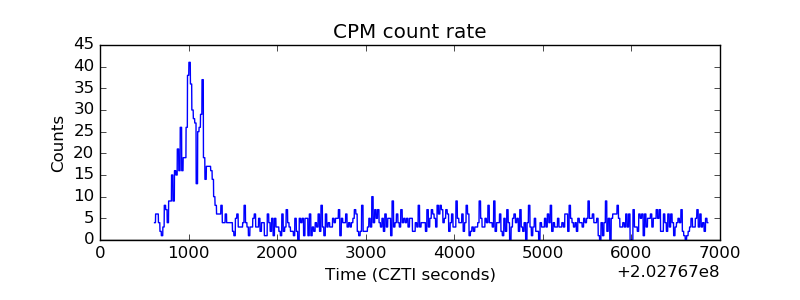 |
| CZT Counter | 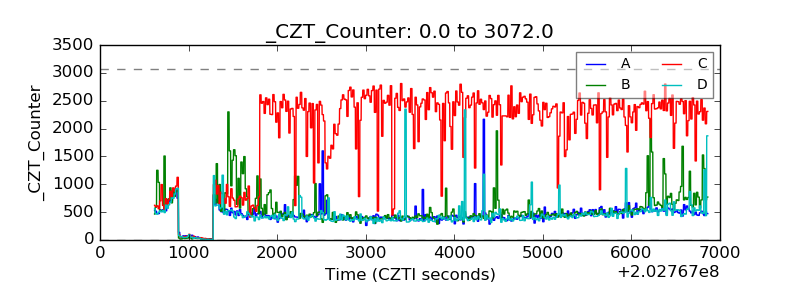 |
| +2.5 Volts monitor |  |
| +5 Volts monitor |  |
| Veto Counter | 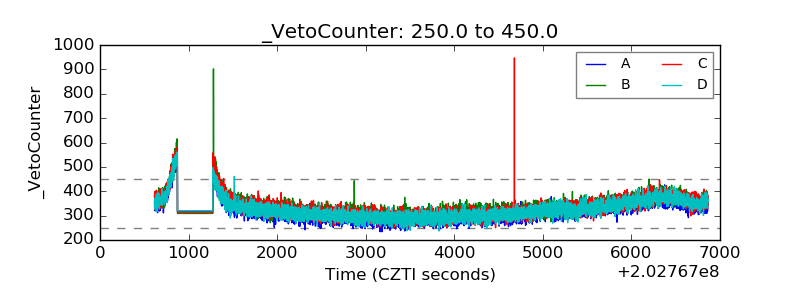 |