| Param | Original file | Final file |
|---|---|---|
| Filename | modeM0/AS1G05_182T01_9000000484_03714cztM0_level2.evt | modeM0/AS1G05_182T01_9000000484_03714cztM0_level2_quad_clean.evt |
| Size (bytes) | 1,733,273,280 | 125,544,960 |
| Size | 1.6 GB | 119.7 MB |
| Events in quadrant A | 8,748,477 | 791,114 |
| Events in quadrant B | 7,222,004 | 824,515 |
| Events in quadrant C | 29,357,917 | 473,868 |
| Events in quadrant D | 6,271,836 | 794,013 |
| Mode SS | |||
|---|---|---|---|
| Quadrant | BADHDUFLAG | Total packets | Discarded packets |
| A | 0 | 272 | 0 |
| B | 0 | 272 | 0 |
| C | 0 | 272 | 0 |
| D | 0 | 272 | 0 |
| Mode M9 | |||
|---|---|---|---|
| Quadrant | BADHDUFLAG | Total packets | Discarded packets |
| A | 0 | 21 | 0 |
| B | 0 | 21 | 0 |
| C | 0 | 21 | 0 |
| D | 0 | 21 | 0 |
| Mode M0 | |||
|---|---|---|---|
| Quadrant | BADHDUFLAG | Total packets | Discarded packets |
| A | 0 | 34908 | 4 |
| B | 0 | 30367 | 3 |
| C | 0 | 96281 | 3 |
| D | 0 | 28428 | 3 |
| Quadrant | Total seconds | Saturated seconds | Saturation percentage |
|---|---|---|---|
| A | 13236 | 1045 | 7.895134% |
| B | 13236 | 134 | 1.012390% |
| C | 13236 | 10788 | 81.504986% |
| D | 13236 | 94 | 0.710184% |
Noise dominated data is calculated using 1-second bins in cleaned event files. If a bin has >2000 counts, and if more than 50% of those come from <1% of pixels, then it is considered to be noise-dominated and hence unusable.
| Quadrant | # 1 sec bins | Bins with >0 counts | Bins with >2000 counts | High rate bins dominated by noise | Noise dominated (total time) | Noise dominated (detector-on time) | Marked lightcurve |
|---|---|---|---|---|---|---|---|
| A | 15446 | 13239 | 946 | 946 | 6.12% | 7.15% | 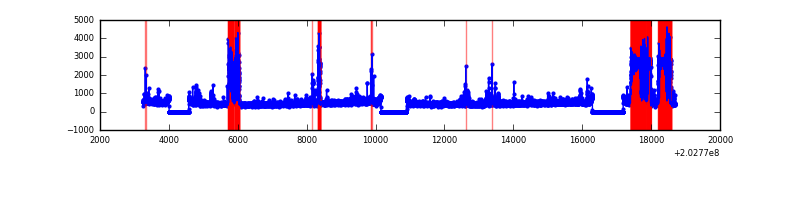 |
| B | 15446 | 13239 | 24 | 24 | 0.16% | 0.18% | 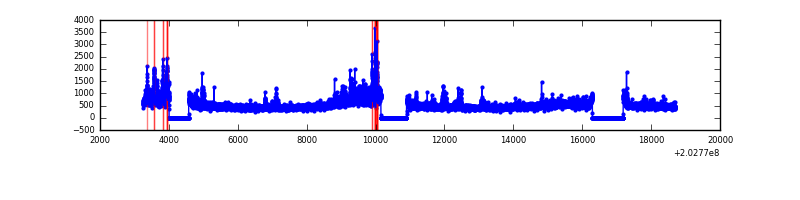 |
| C | 15446 | 13236 | 9457 | 9457 | 61.23% | 71.45% | 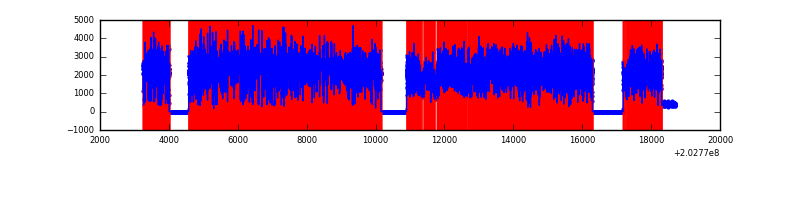 |
| D | 15446 | 13239 | 47 | 47 | 0.30% | 0.36% | 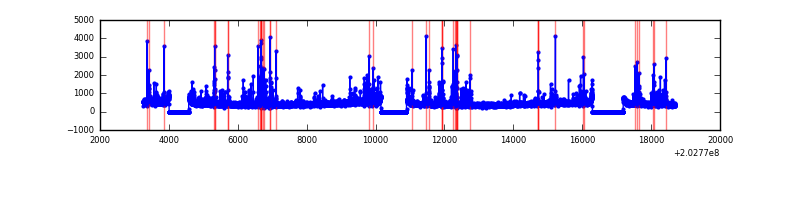 |
Top three noisy pixels from each quadrant. If the there are fewer than three noisy pixels in the level2.evt file, extra rows are filled as -1
| Pixel properties | Quadrant properties | ||||||
|---|---|---|---|---|---|---|---|
| Quadrant | DetID | PixID | Counts | Sigma | Mean | Median | Sigma |
| A | 13 | 251 | 2126948 | 7077.65 | 1454 | 1423 | 300.3 |
| A | 0 | 50 | 636791 | 2115.67 | 1454 | 1423 | 300.3 |
| A | 8 | 15 | 287104 | 951.27 | 1454 | 1423 | 300.3 |
| B | 15 | 204 | 690543 | 2318.72 | 1540 | 1506 | 297.2 |
| B | 14 | 167 | 287470 | 962.31 | 1540 | 1506 | 297.2 |
| B | 5 | 70 | 109068 | 361.96 | 1540 | 1506 | 297.2 |
| C | 2 | 53 | 25382221 | 107730.68 | 1003 | 1006 | 235.6 |
| C | 1 | 16 | 13041 | 51.08 | 1003 | 1006 | 235.6 |
| C | 9 | 144 | 12924 | 50.59 | 1003 | 1006 | 235.6 |
| D | 13 | 239 | 254563 | 710.95 | 1472 | 1427 | 356.1 |
| D | 14 | 34 | 84082 | 232.14 | 1472 | 1427 | 356.1 |
| D | 2 | 37 | 71432 | 196.61 | 1472 | 1427 | 356.1 |
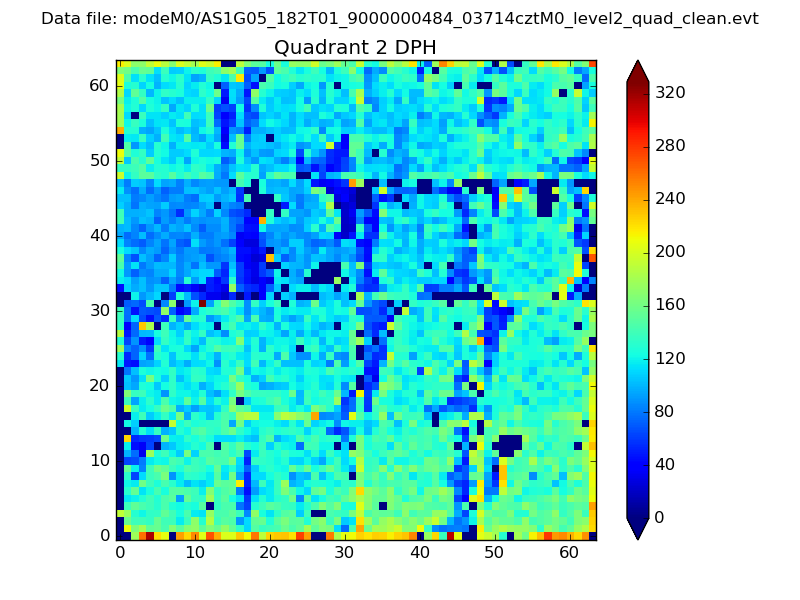
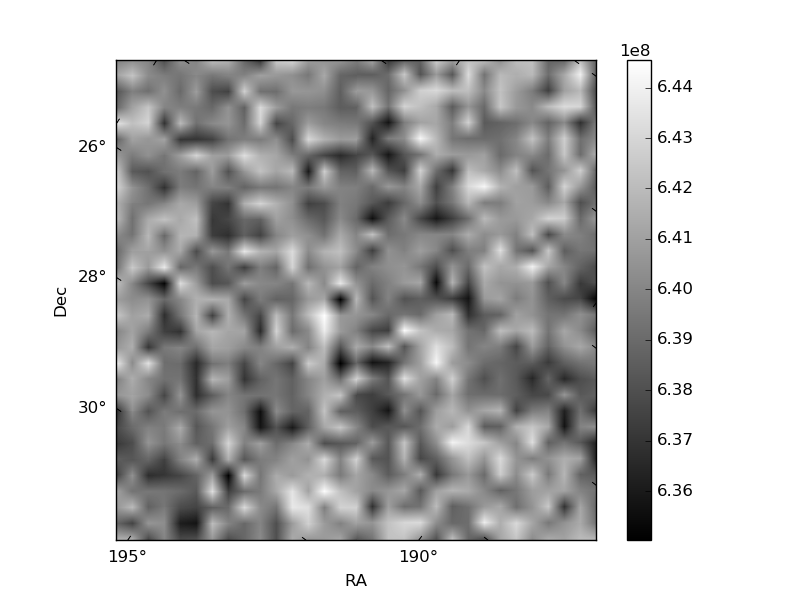
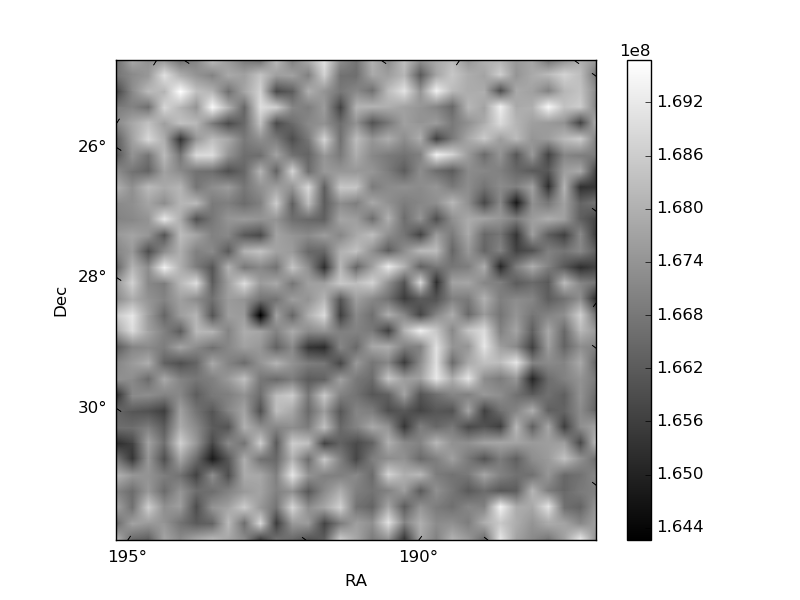
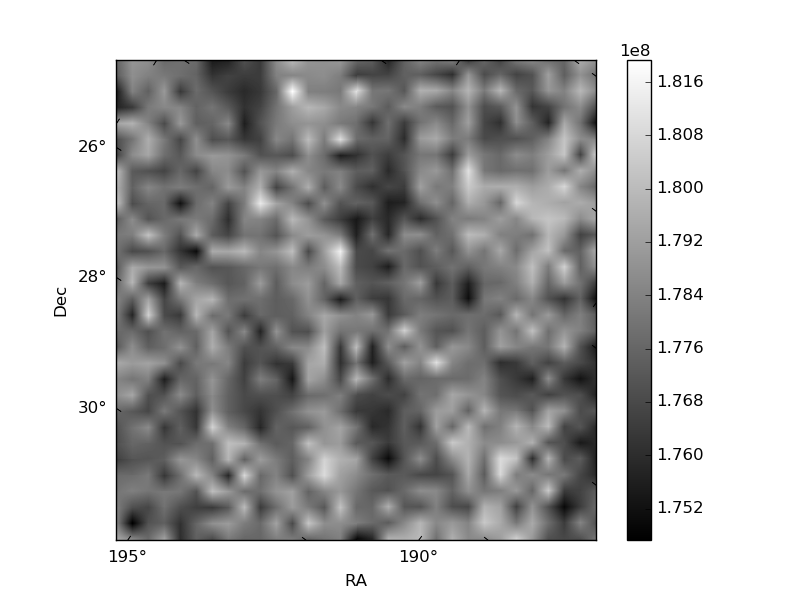
Histogram calculated using DETX and DETY for each event in the final _common_clean file
| Quadrant A | 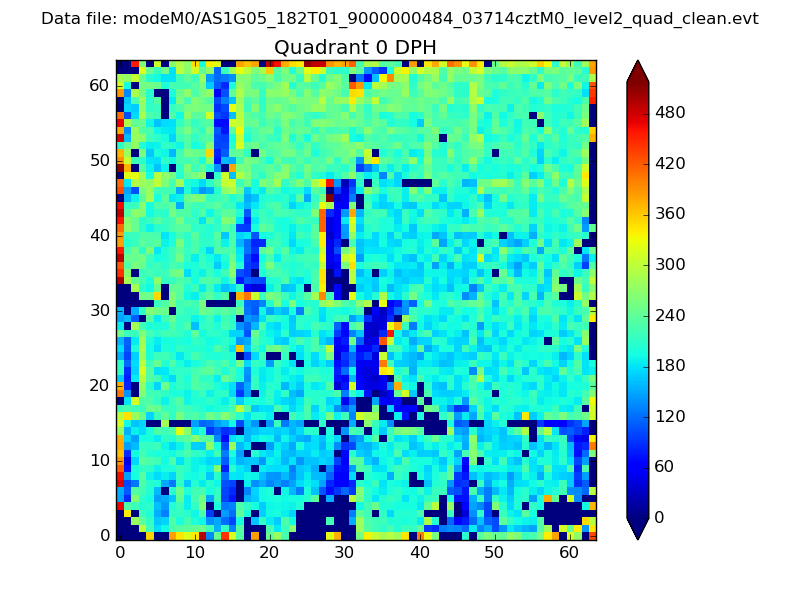 |
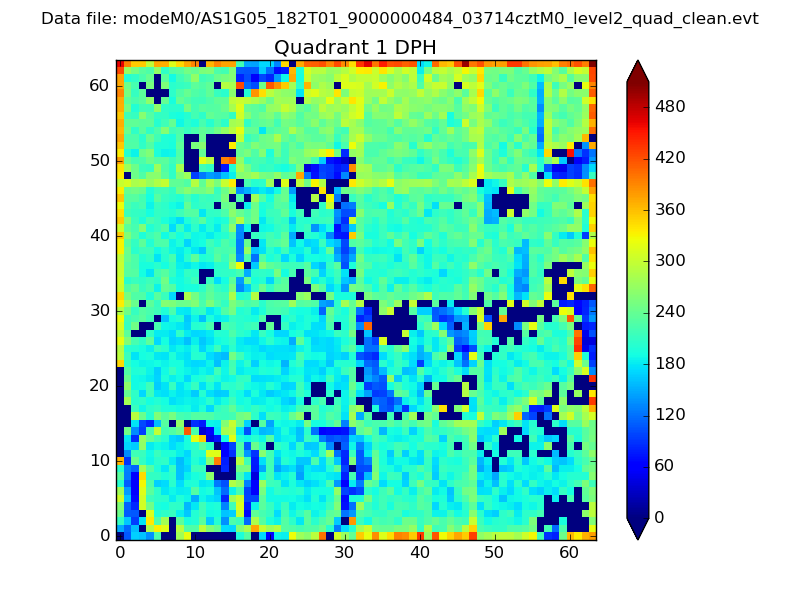 |
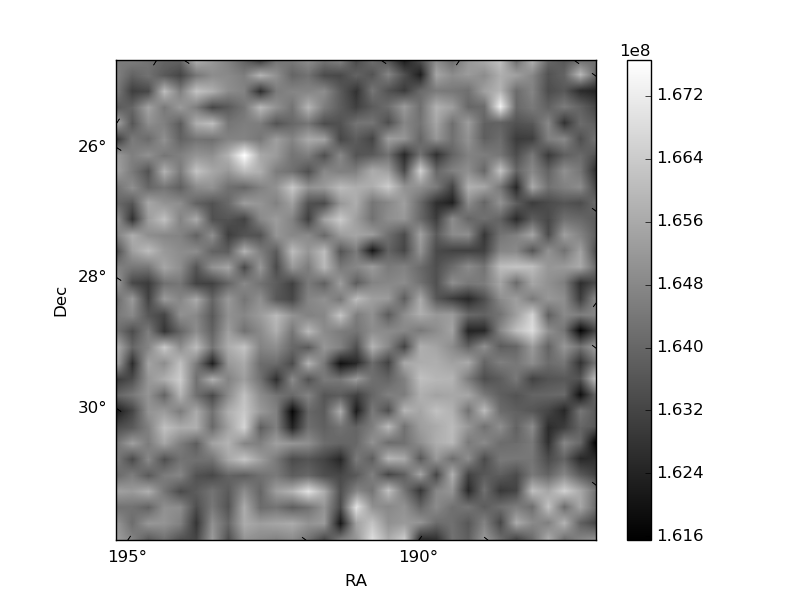
Quadrant B |
|---|---|---|---|
| Quadrant D | 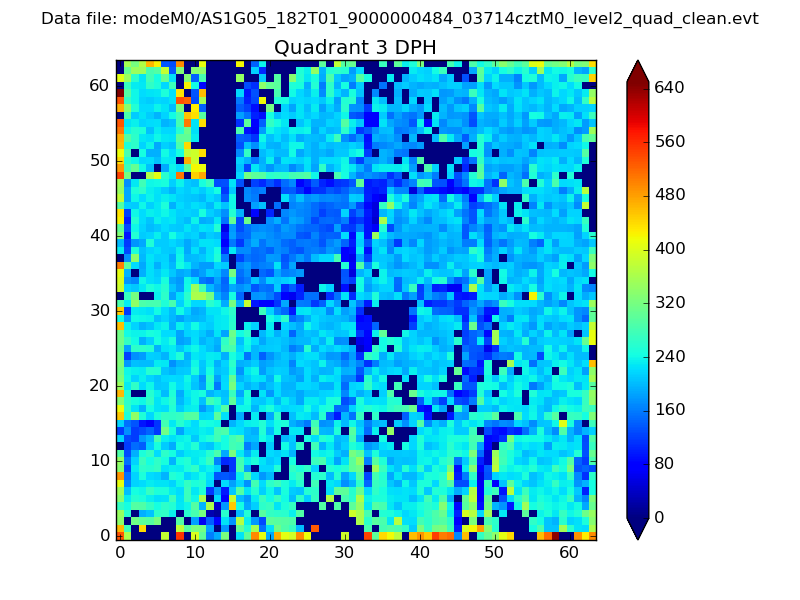 |
 |
Quadrant C |
| Plot type | Count rate plots | Images |
|---|---|---|
| Comparison with Poisson distribution Blue bars denote a histogram of data divided into 1 sec bins. Red curve is a Poisson curve with rate = median count rate of data. |
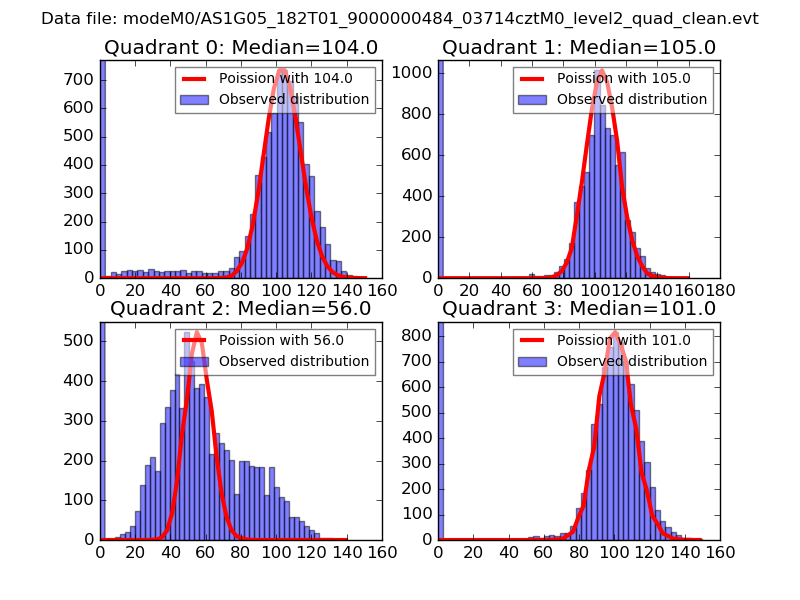 |
 |
| Quadrant-wise count rates Data is divided into 100 sec bins |
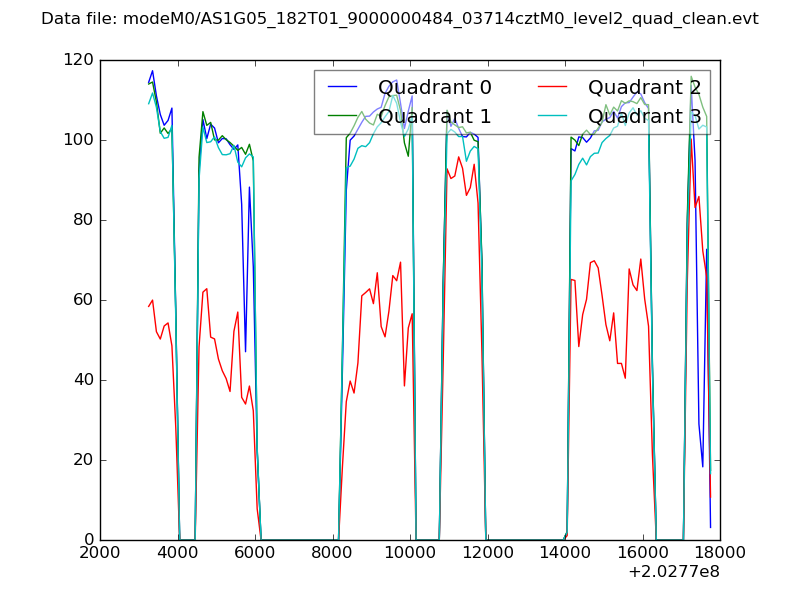 |
|
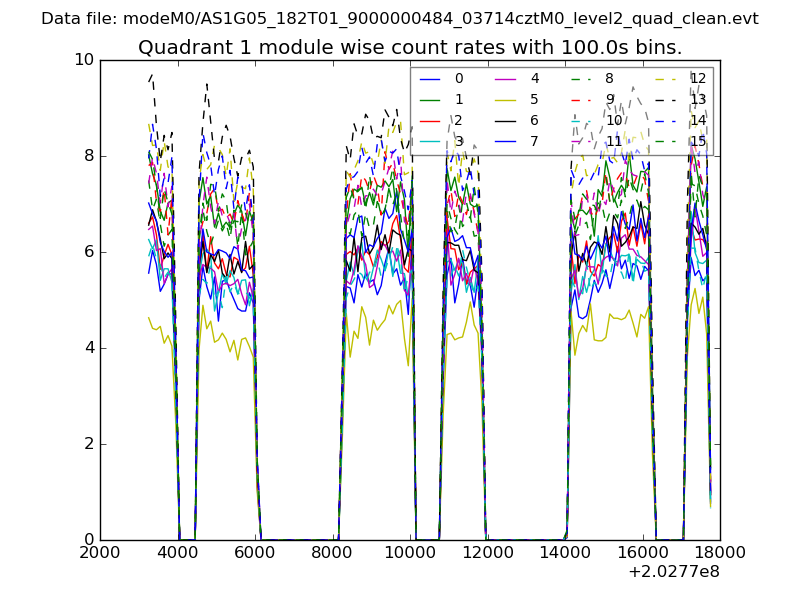
| Module-wise count rates for Quadrant A Data is divided into 100 sec bins |
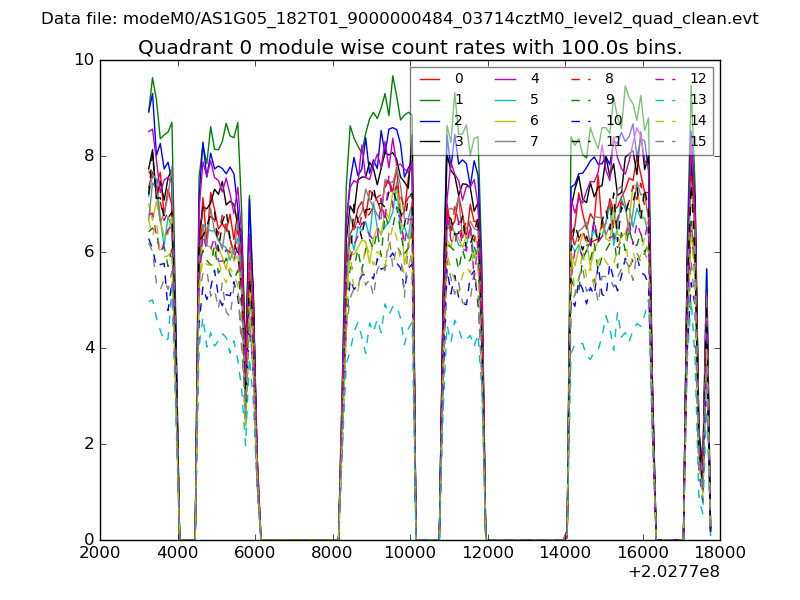 |
 |
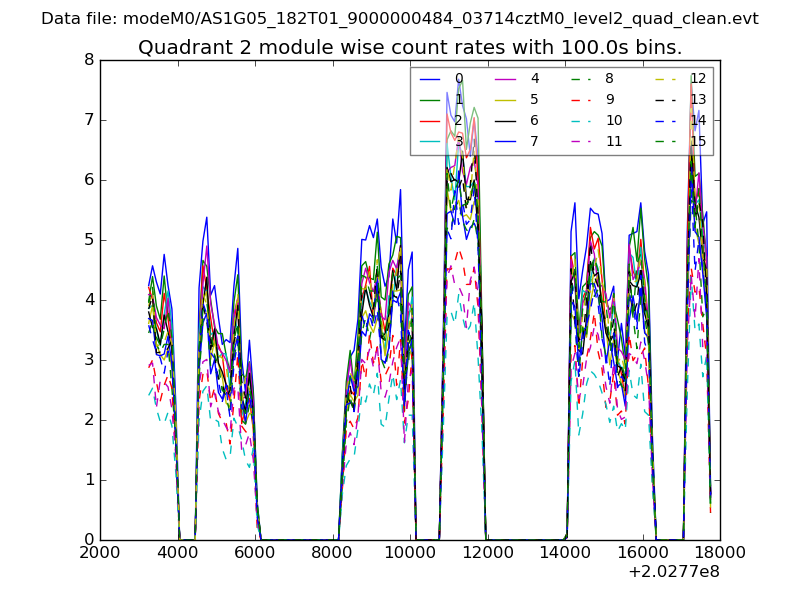
| Module-wise count rates for Quadrant B Data is divided into 100 sec bins |
 |
 |
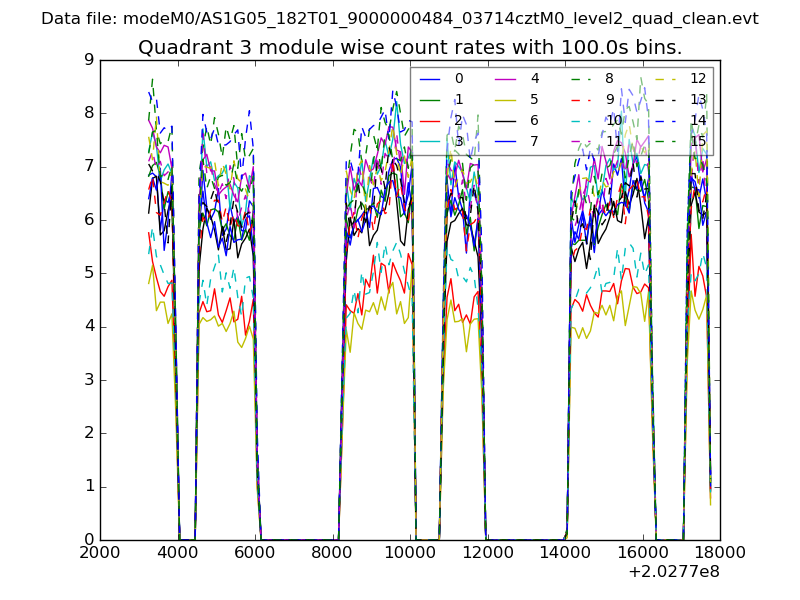
| Module-wise count rates for Quadrant C Data is divided into 100 sec bins |
 |
 |
| Module-wise count rates for Quadrant D Data is divided into 100 sec bins |
 |
 |
| Parameter | Plot |
|---|---|
| CZT HV Monitor | 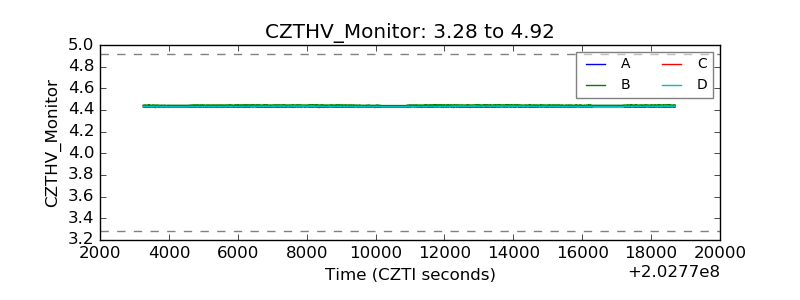 |
| D_VDD |  |
| Temperature 1 | 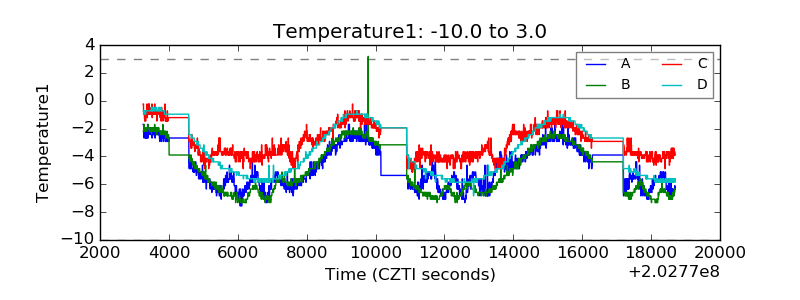 |
| Veto HV Monitor | 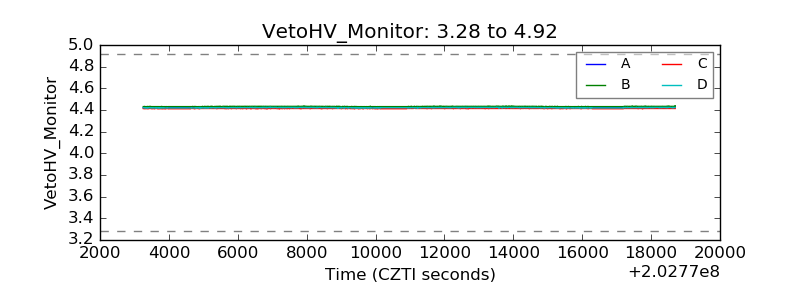 |
| Veto LLD | 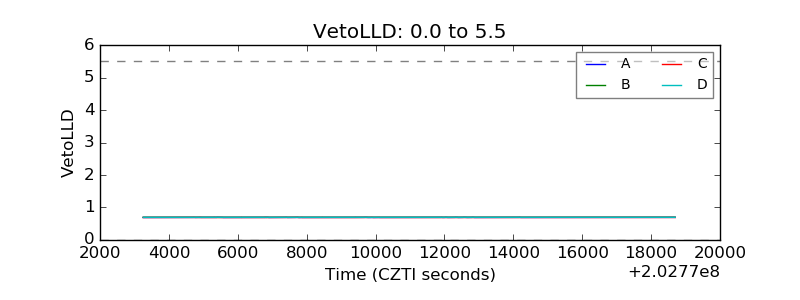 |
| Alpha Counter | 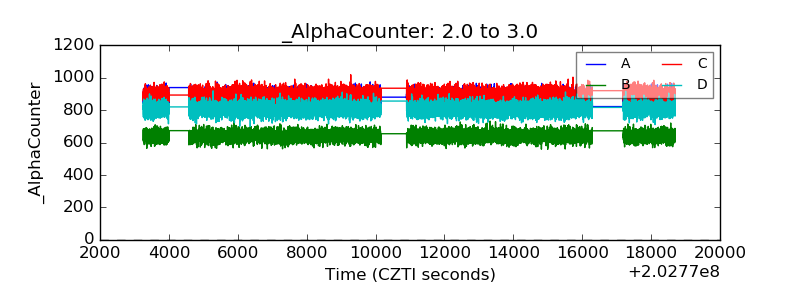 |
| _CPM_Rate | 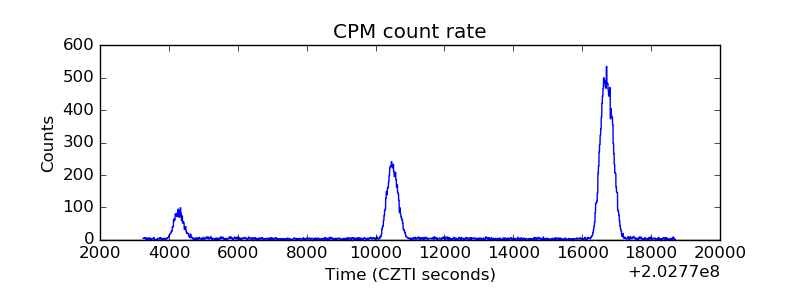 |
| CZT Counter | 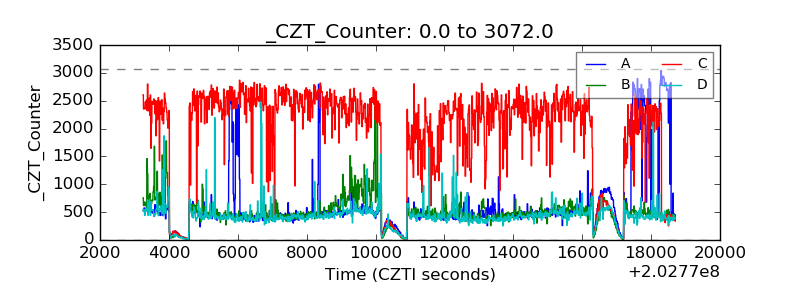 |
| +2.5 Volts monitor |  |
| +5 Volts monitor |  |
| Veto Counter | 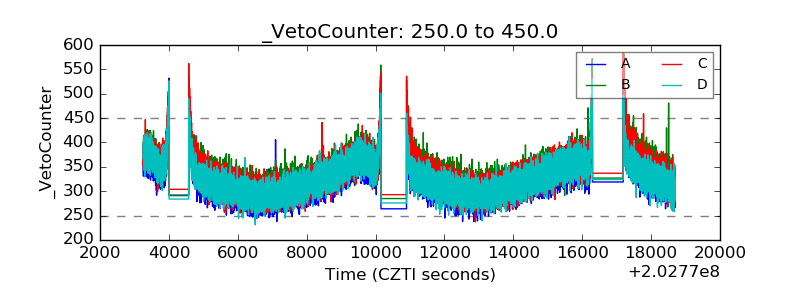 |