| Param | Original file | Final file |
|---|---|---|
| Filename | modeM0/AS1G05_182T01_9000000484_03715cztM0_level2.evt | modeM0/AS1G05_182T01_9000000484_03715cztM0_level2_quad_clean.evt |
| Size (bytes) | 595,143,360 | 57,398,400 |
| Size | 567.6 MB | 54.7 MB |
| Events in quadrant A | 6,055,130 | 300,578 |
| Events in quadrant B | 3,340,831 | 341,418 |
| Events in quadrant C | 5,144,499 | 318,722 |
| Events in quadrant D | 3,044,562 | 324,691 |
| Mode SS | |||
|---|---|---|---|
| Quadrant | BADHDUFLAG | Total packets | Discarded packets |
| A | 0 | 132 | 0 |
| B | 0 | 132 | 0 |
| C | 0 | 132 | 0 |
| D | 0 | 132 | 0 |
| Mode M9 | |||
|---|---|---|---|
| Quadrant | BADHDUFLAG | Total packets | Discarded packets |
| A | 0 | 15 | 0 |
| B | 0 | 15 | 0 |
| C | 0 | 15 | 0 |
| D | 0 | 16 | 0 |
| Mode M0 | |||
|---|---|---|---|
| Quadrant | BADHDUFLAG | Total packets | Discarded packets |
| A | 0 | 22374 | 3 |
| B | 0 | 13926 | 2 |
| C | 0 | 19639 | 2 |
| D | 0 | 13813 | 2 |
| Quadrant | Total seconds | Saturated seconds | Saturation percentage |
|---|---|---|---|
| A | 6473 | 1169 | 18.059632% |
| B | 6473 | 78 | 1.205005% |
| C | 6473 | 821 | 12.683454% |
| D | 6473 | 25 | 0.386220% |
Noise dominated data is calculated using 1-second bins in cleaned event files. If a bin has >2000 counts, and if more than 50% of those come from <1% of pixels, then it is considered to be noise-dominated and hence unusable.
| Quadrant | # 1 sec bins | Bins with >0 counts | Bins with >2000 counts | High rate bins dominated by noise | Noise dominated (total time) | Noise dominated (detector-on time) | Marked lightcurve |
|---|---|---|---|---|---|---|---|
| A | 7503 | 6473 | 1025 | 1025 | 13.66% | 15.84% | 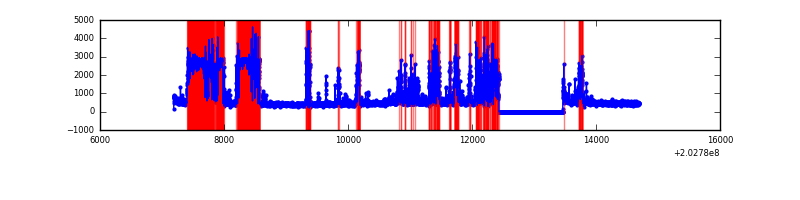 |
| B | 7503 | 6474 | 22 | 22 | 0.29% | 0.34% | 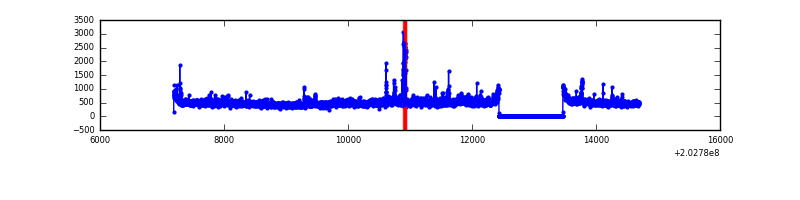 |
| C | 7503 | 6474 | 672 | 672 | 8.96% | 10.38% | 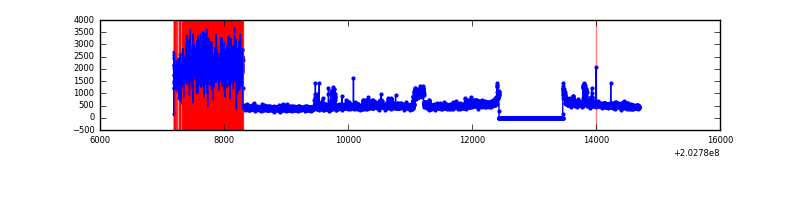 |
| D | 7503 | 6474 | 22 | 22 | 0.29% | 0.34% | 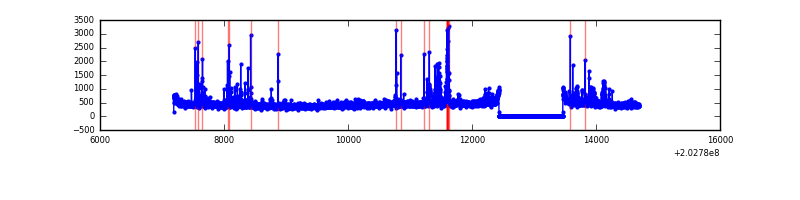 |
Top three noisy pixels from each quadrant. If the there are fewer than three noisy pixels in the level2.evt file, extra rows are filled as -1
| Pixel properties | Quadrant properties | ||||||
|---|---|---|---|---|---|---|---|
| Quadrant | DetID | PixID | Counts | Sigma | Mean | Median | Sigma |
| A | 13 | 251 | 3263745 | 23203.61 | 682 | 666 | 140.6 |
| A | 0 | 50 | 120943 | 855.28 | 682 | 666 | 140.6 |
| A | 8 | 15 | 19878 | 136.62 | 682 | 666 | 140.6 |
| B | 15 | 204 | 172082 | 1158.28 | 769 | 751 | 147.9 |
| B | 0 | 173 | 110029 | 738.77 | 769 | 751 | 147.9 |
| B | 4 | 81 | 27119 | 178.26 | 769 | 751 | 147.9 |
| C | 2 | 53 | 2349173 | 14009.62 | 710 | 711 | 167.6 |
| C | 8 | 128 | 6937 | 37.14 | 710 | 711 | 167.6 |
| C | 13 | 61 | 6061 | 31.92 | 710 | 711 | 167.6 |
| D | 9 | 35 | 86241 | 483.09 | 727 | 706 | 177.1 |
| D | 2 | 37 | 71574 | 400.25 | 727 | 706 | 177.1 |
| D | 13 | 239 | 68800 | 384.58 | 727 | 706 | 177.1 |
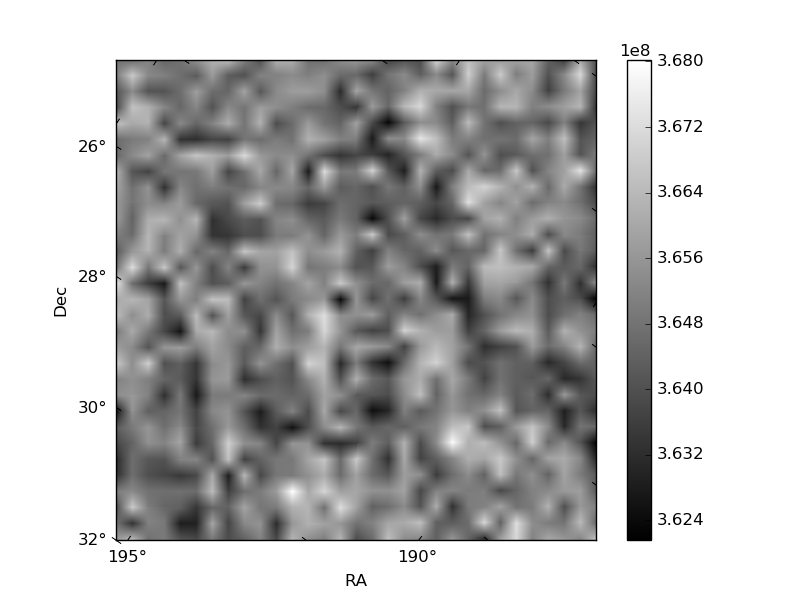
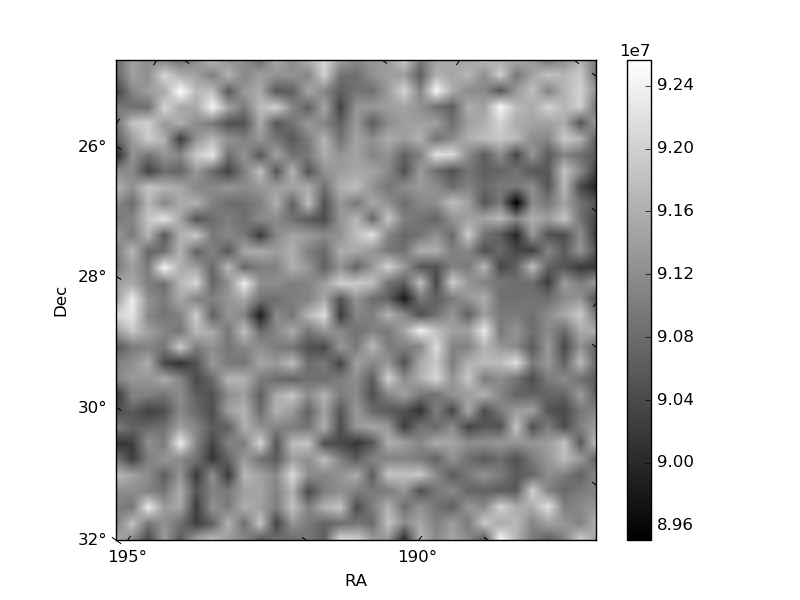
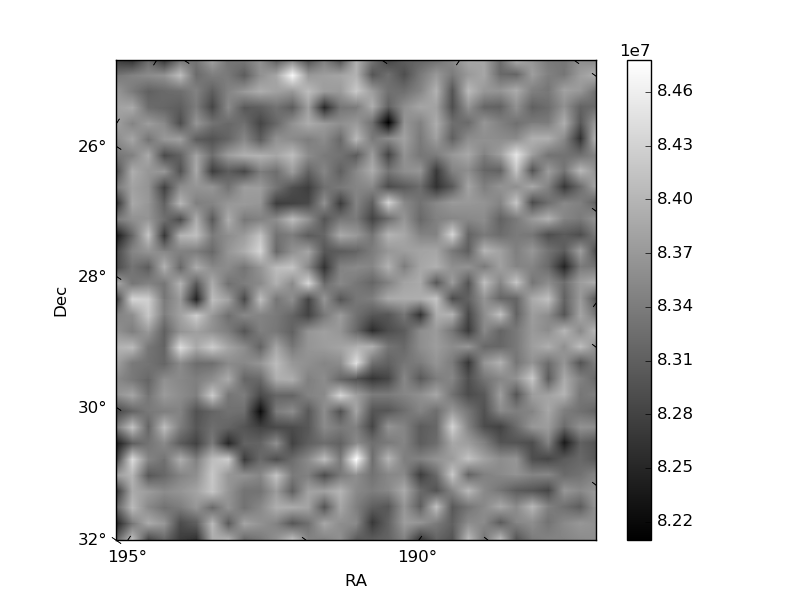
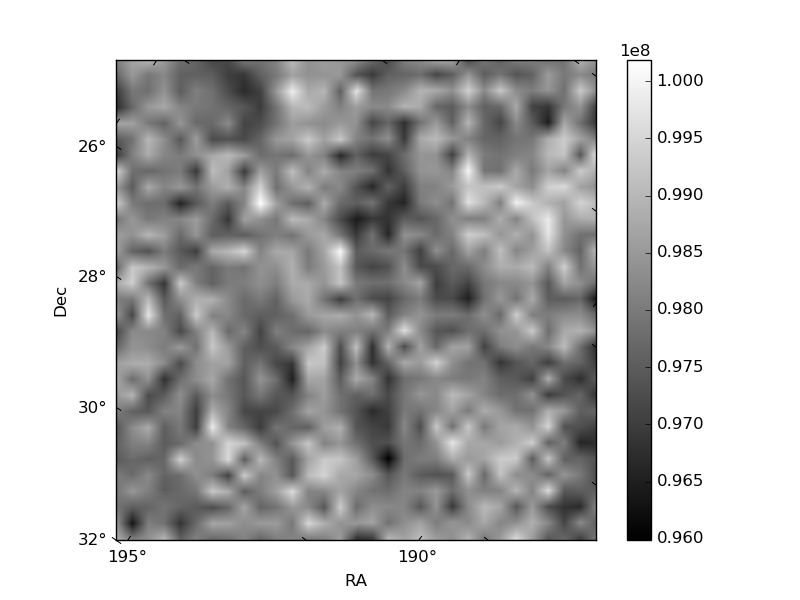
Histogram calculated using DETX and DETY for each event in the final _common_clean file
| Quadrant A | 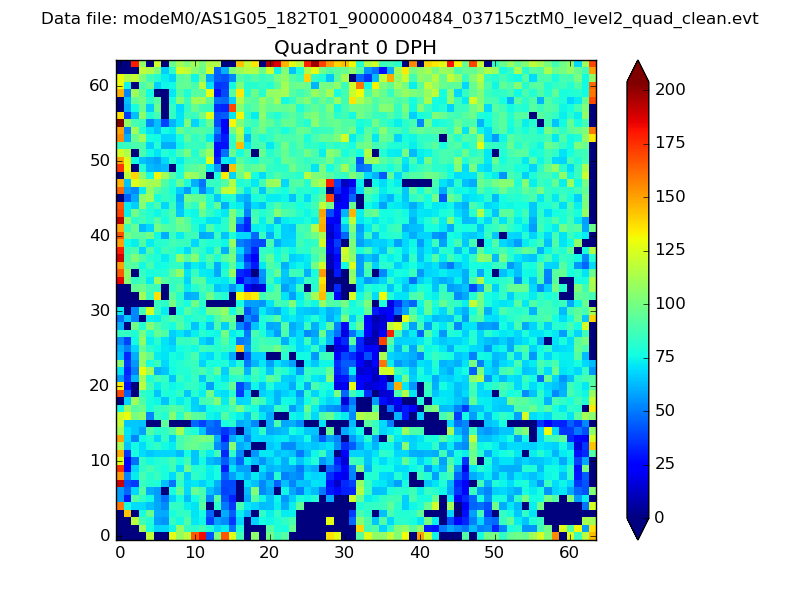 |
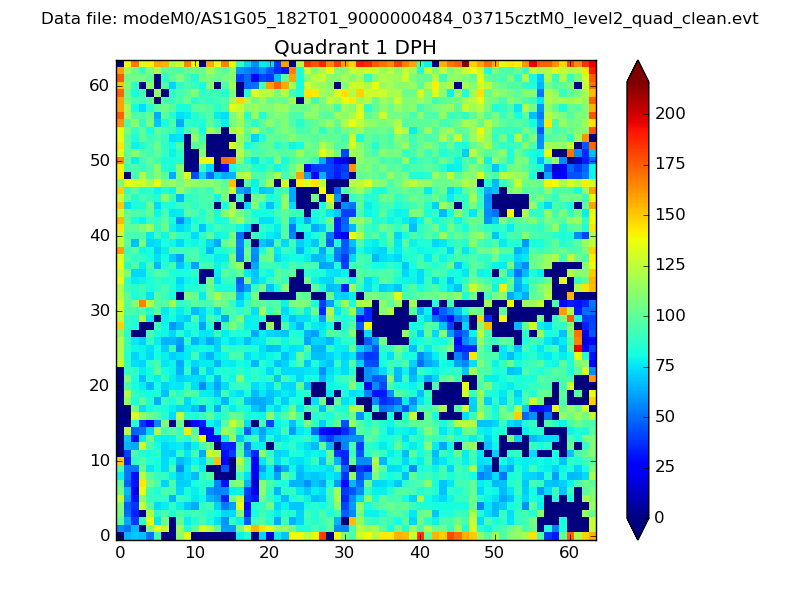 |
Quadrant B |
|---|---|---|---|
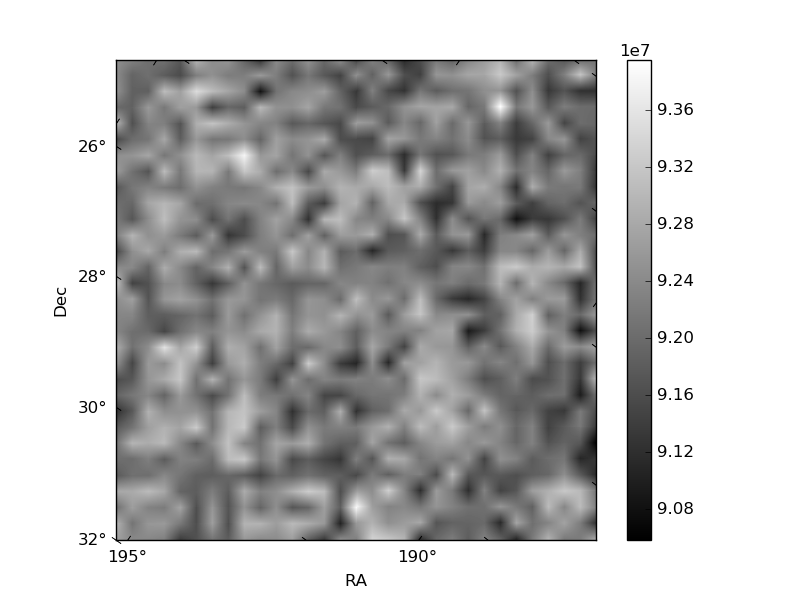
| Quadrant D | 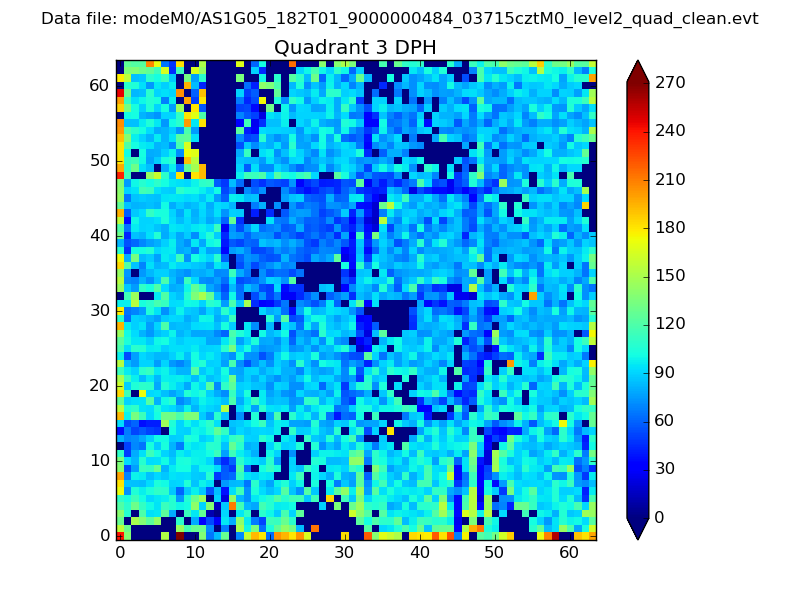 |
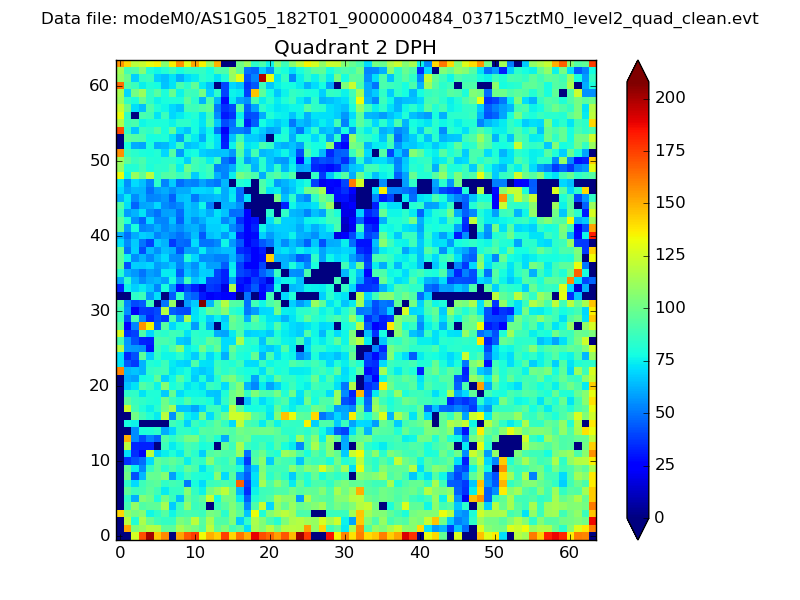 |
Quadrant C |
| Plot type | Count rate plots | Images |
|---|---|---|
| Comparison with Poisson distribution Blue bars denote a histogram of data divided into 1 sec bins. Red curve is a Poisson curve with rate = median count rate of data. |
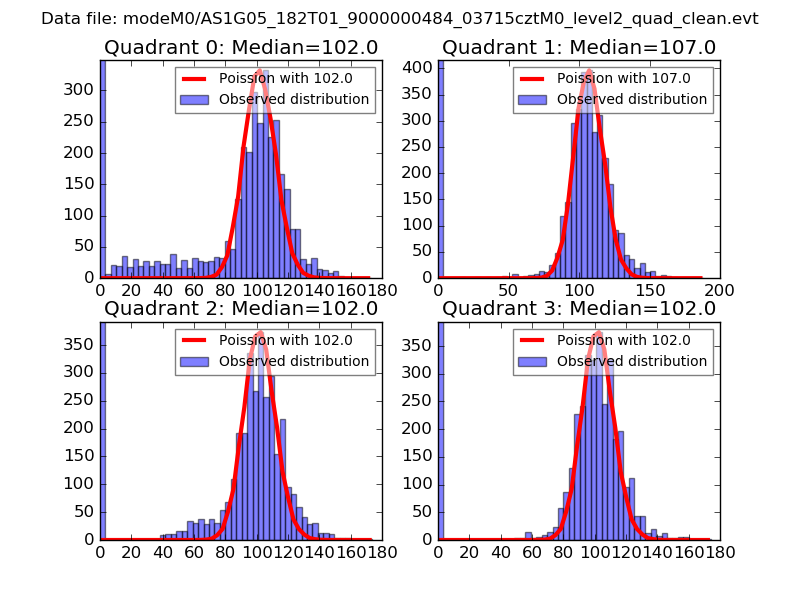 |
 |
| Quadrant-wise count rates Data is divided into 100 sec bins |
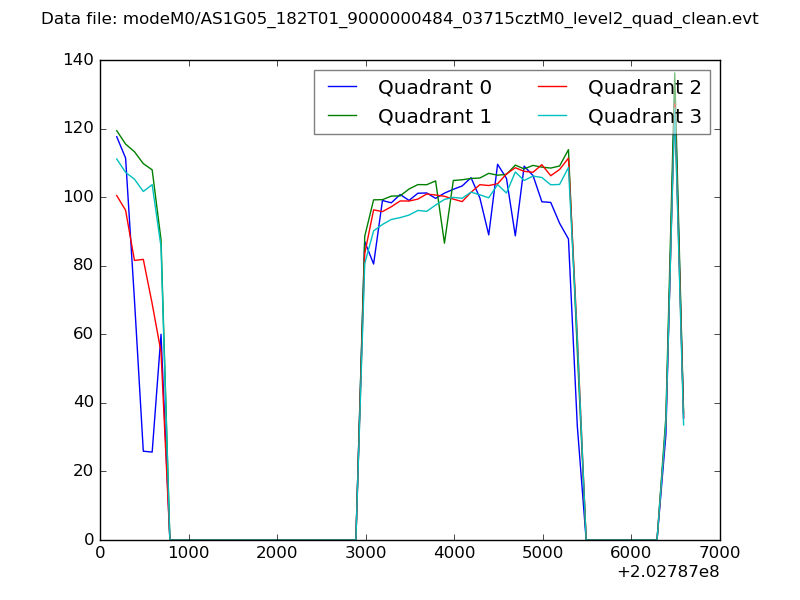 |
|
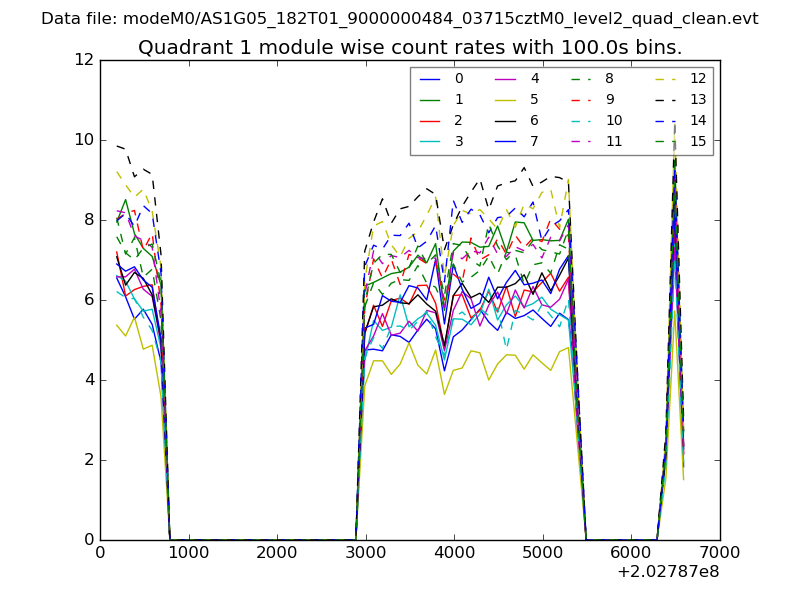
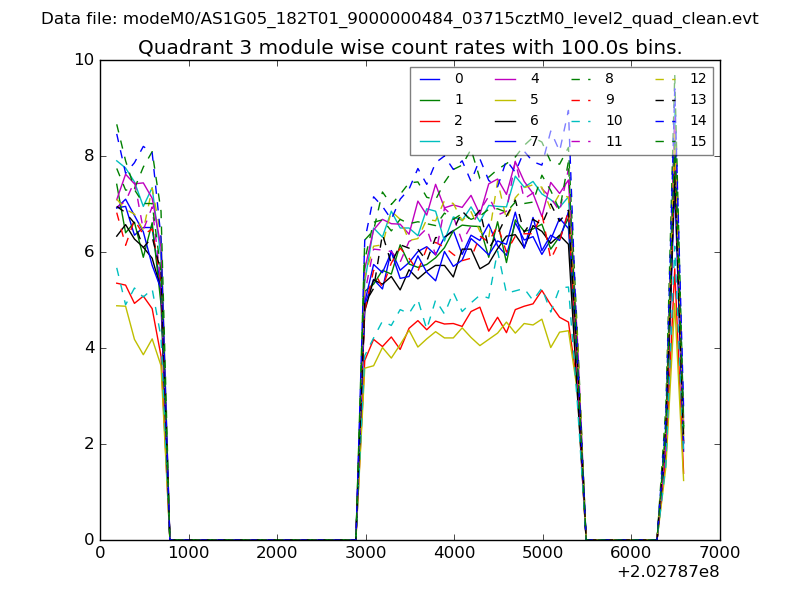
| Module-wise count rates for Quadrant A Data is divided into 100 sec bins |
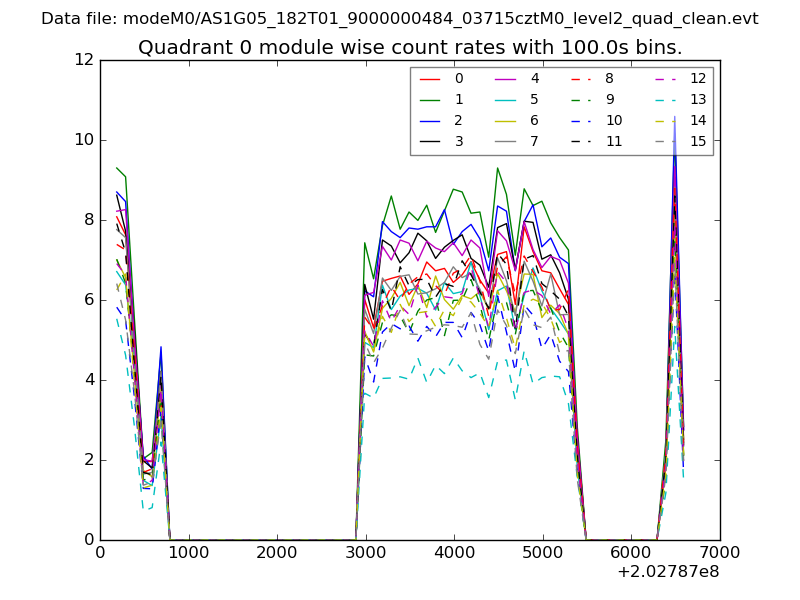 |
 |
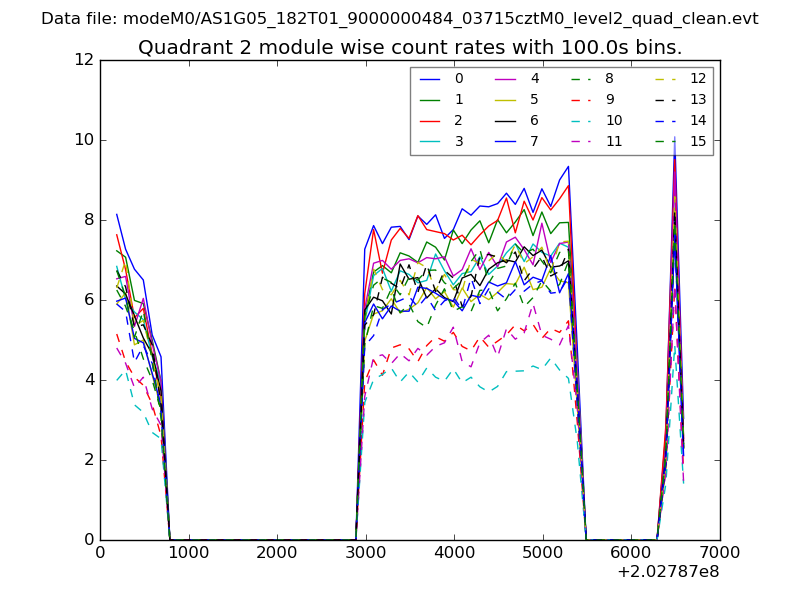
| Module-wise count rates for Quadrant B Data is divided into 100 sec bins |
 |
 |
| Module-wise count rates for Quadrant C Data is divided into 100 sec bins |
 |
 |
| Module-wise count rates for Quadrant D Data is divided into 100 sec bins |
 |
 |
| Parameter | Plot |
|---|---|
| CZT HV Monitor | 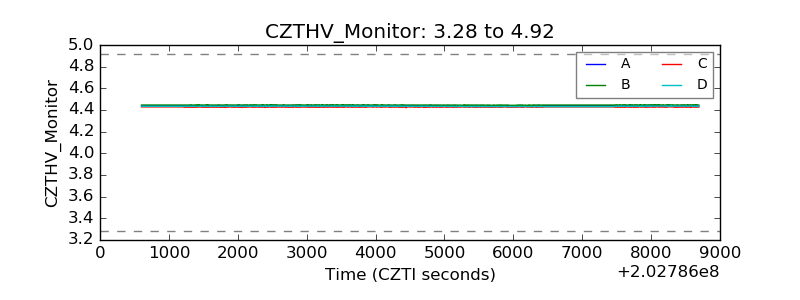 |
| D_VDD | 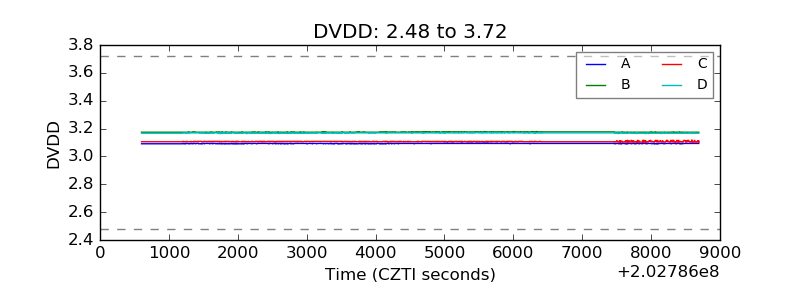 |
| Temperature 1 | 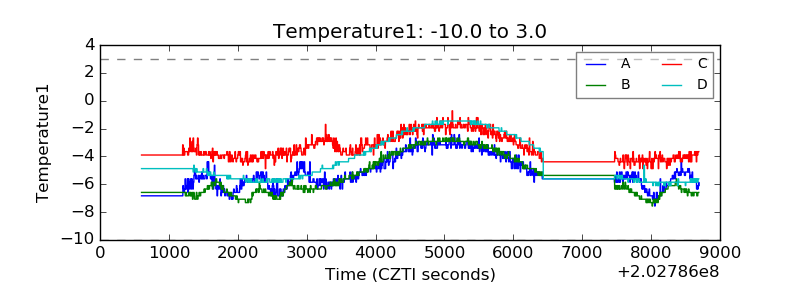 |
| Veto HV Monitor | 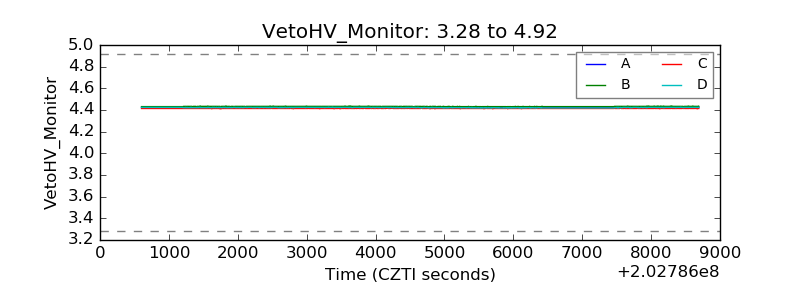 |
| Veto LLD | 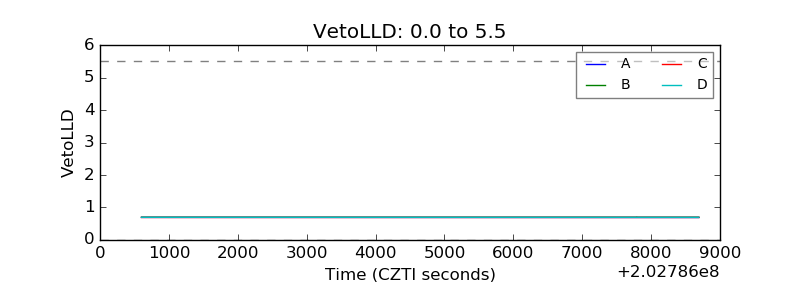 |
| Alpha Counter | 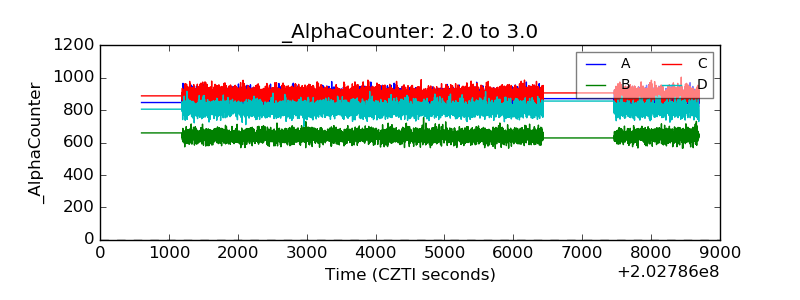 |
| _CPM_Rate | 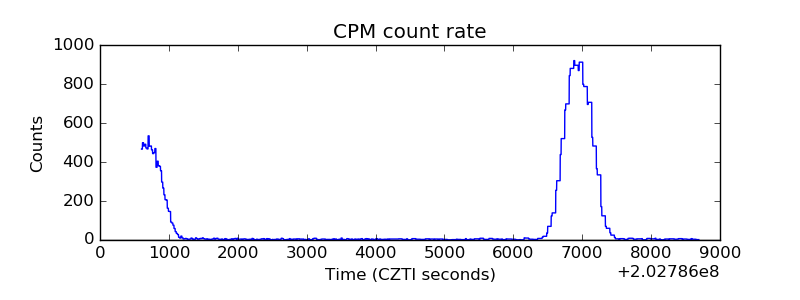 |
| CZT Counter | 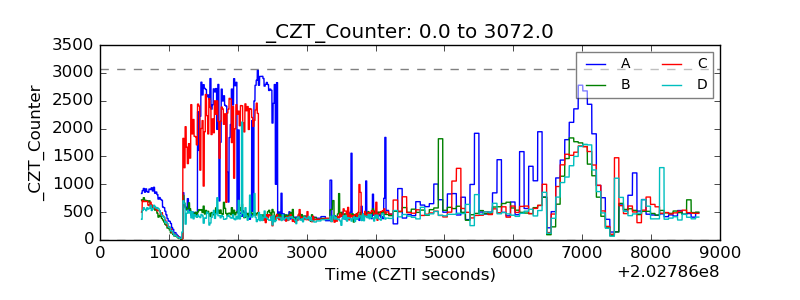 |
| +2.5 Volts monitor |  |
| +5 Volts monitor | 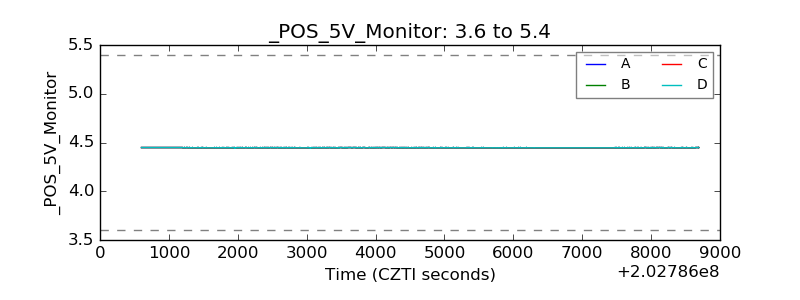 |
| Veto Counter | 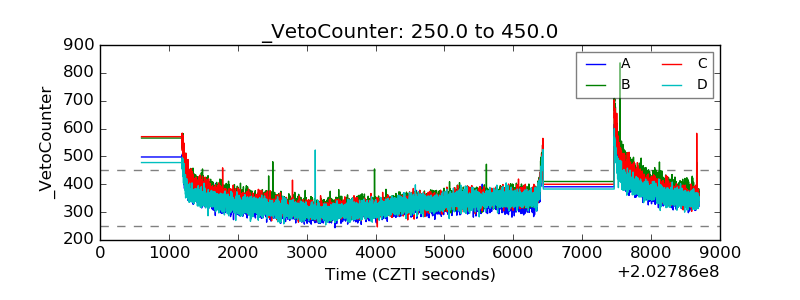 |