| Param | Original file | Final file |
|---|---|---|
| Filename | modeM0/AS1G05_182T01_9000000484_03717cztM0_level2.evt | modeM0/AS1G05_182T01_9000000484_03717cztM0_level2_quad_clean.evt |
| Size (bytes) | 493,943,040 | 55,008,000 |
| Size | 471.1 MB | 52.5 MB |
| Events in quadrant A | 4,000,708 | 280,059 |
| Events in quadrant B | 3,870,807 | 313,166 |
| Events in quadrant C | 3,364,792 | 305,522 |
| Events in quadrant D | 3,264,601 | 295,788 |
| Mode SS | |||
|---|---|---|---|
| Quadrant | BADHDUFLAG | Total packets | Discarded packets |
| A | 0 | 136 | 0 |
| B | 0 | 136 | 0 |
| C | 0 | 136 | 0 |
| D | 0 | 136 | 0 |
| Mode M9 | |||
|---|---|---|---|
| Quadrant | BADHDUFLAG | Total packets | Discarded packets |
| A | 0 | 21 | 0 |
| B | 0 | 21 | 0 |
| C | 0 | 21 | 0 |
| D | 0 | 21 | 0 |
| Mode M0 | |||
|---|---|---|---|
| Quadrant | BADHDUFLAG | Total packets | Discarded packets |
| A | 0 | 16136 | 3 |
| B | 0 | 15829 | 2 |
| C | 0 | 14403 | 2 |
| D | 0 | 14488 | 2 |
| Quadrant | Total seconds | Saturated seconds | Saturation percentage |
|---|---|---|---|
| A | 6753 | 369 | 5.464238% |
| B | 6753 | 94 | 1.391974% |
| C | 6753 | 36 | 0.533096% |
| D | 6753 | 30 | 0.444247% |
Noise dominated data is calculated using 1-second bins in cleaned event files. If a bin has >2000 counts, and if more than 50% of those come from <1% of pixels, then it is considered to be noise-dominated and hence unusable.
| Quadrant | # 1 sec bins | Bins with >0 counts | Bins with >2000 counts | High rate bins dominated by noise | Noise dominated (total time) | Noise dominated (detector-on time) | Marked lightcurve |
|---|---|---|---|---|---|---|---|
| A | 7888 | 6753 | 243 | 243 | 3.08% | 3.60% | 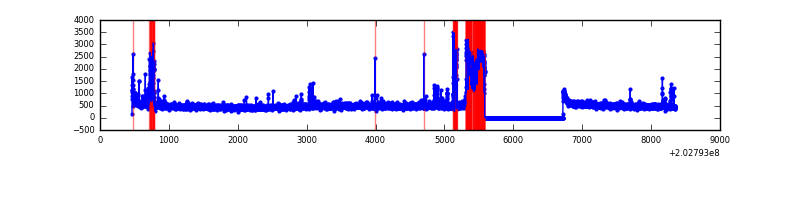 |
| B | 7888 | 6754 | 0 | 0 | 0.00% | 0.00% | 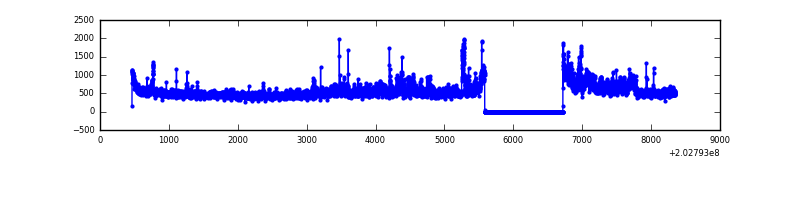 |
| C | 7888 | 6754 | 3 | 3 | 0.04% | 0.04% | 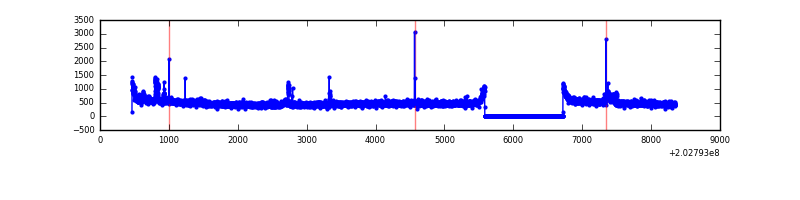 |
| D | 7888 | 6754 | 11 | 11 | 0.14% | 0.16% | 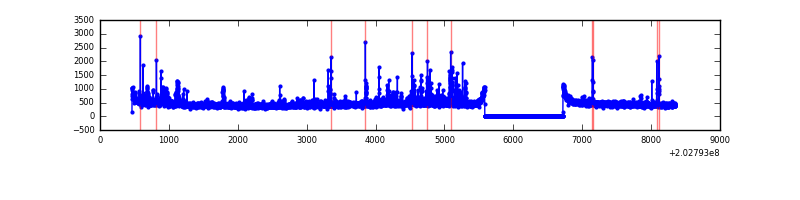 |
Top three noisy pixels from each quadrant. If the there are fewer than three noisy pixels in the level2.evt file, extra rows are filled as -1
| Pixel properties | Quadrant properties | ||||||
|---|---|---|---|---|---|---|---|
| Quadrant | DetID | PixID | Counts | Sigma | Mean | Median | Sigma |
| A | 13 | 251 | 789267 | 4940.28 | 782 | 765 | 159.6 |
| A | 8 | 15 | 71991 | 446.26 | 782 | 765 | 159.6 |
| A | 3 | 1 | 38891 | 238.87 | 782 | 765 | 159.6 |
| B | 0 | 173 | 373233 | 2338.13 | 830 | 813 | 159.3 |
| B | 15 | 204 | 213114 | 1332.87 | 830 | 813 | 159.3 |
| B | 0 | 228 | 33235 | 203.55 | 830 | 813 | 159.3 |
| C | 2 | 53 | 236688 | 1274.43 | 788 | 794 | 185.1 |
| C | 8 | 128 | 19343 | 100.21 | 788 | 794 | 185.1 |
| C | 1 | 16 | 10032 | 49.91 | 788 | 794 | 185.1 |
| D | 14 | 34 | 100016 | 521.99 | 781 | 757 | 190.2 |
| D | 9 | 35 | 46862 | 242.46 | 781 | 757 | 190.2 |
| D | 2 | 37 | 37645 | 193.99 | 781 | 757 | 190.2 |
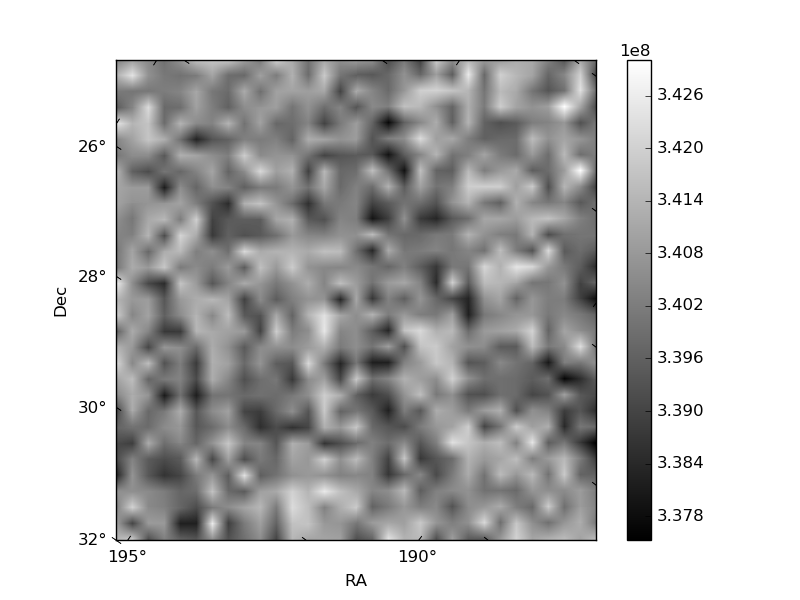
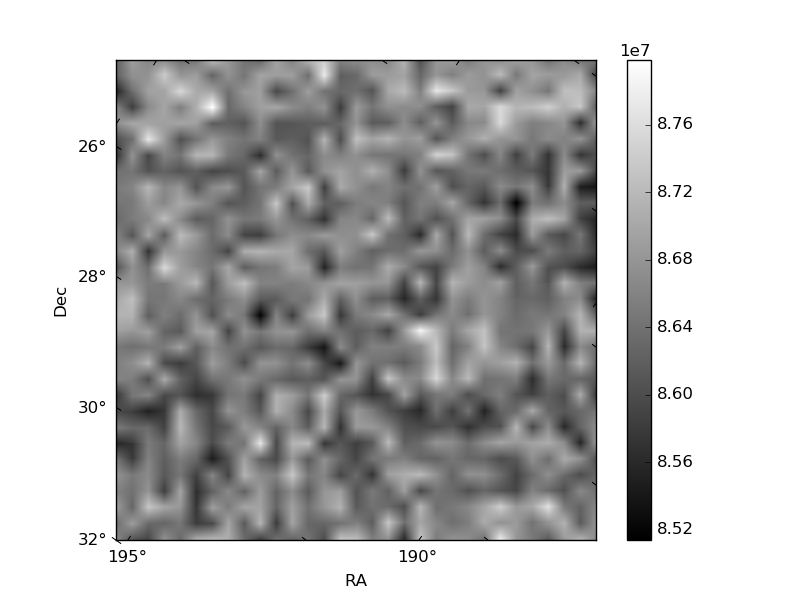
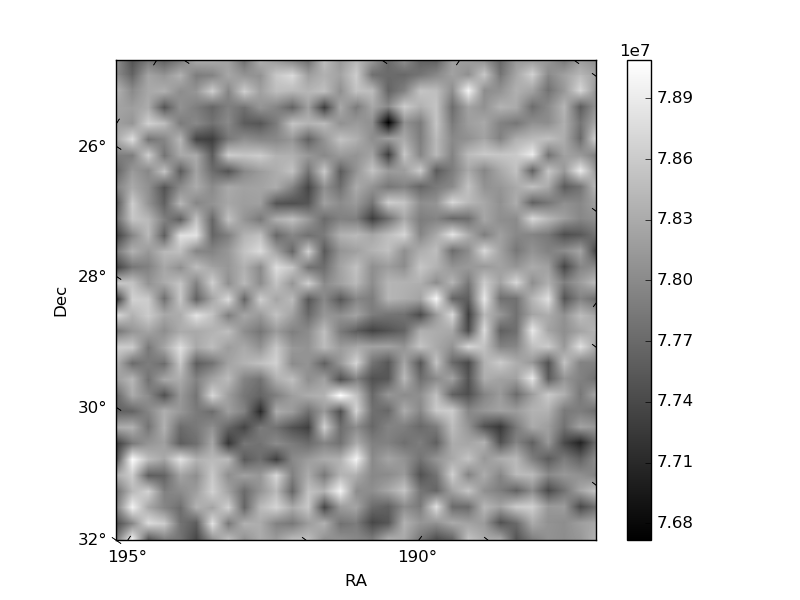
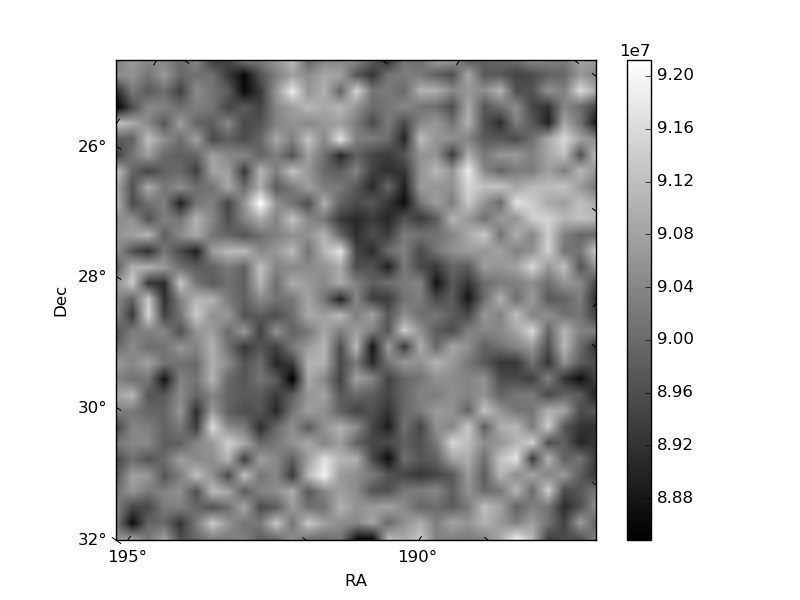
Histogram calculated using DETX and DETY for each event in the final _common_clean file
| Quadrant A | 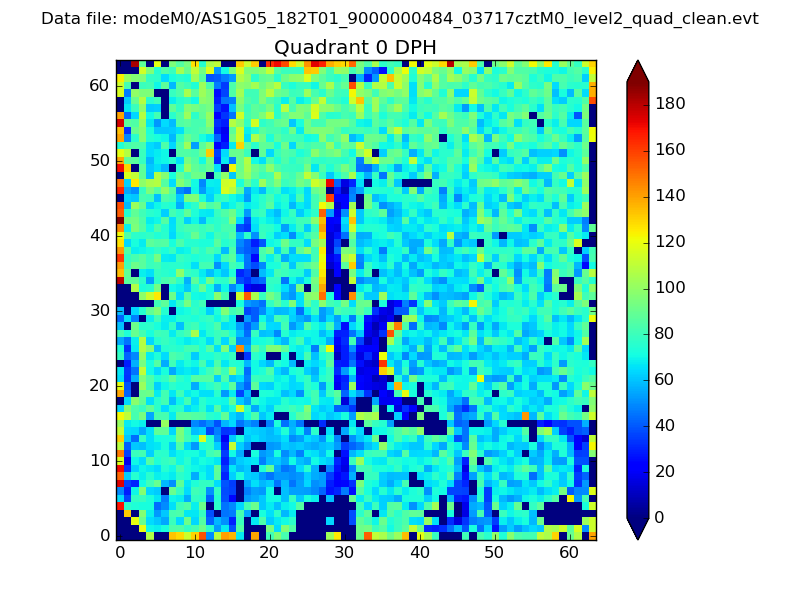 |
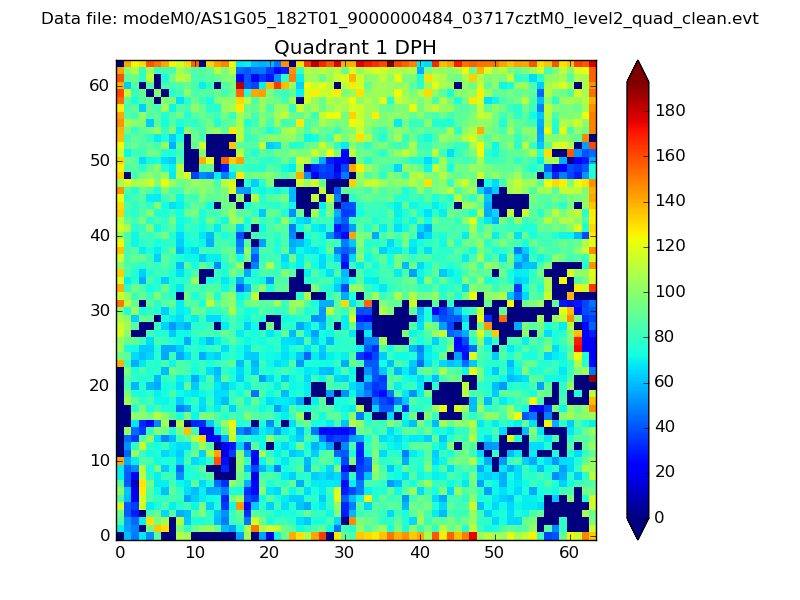 |
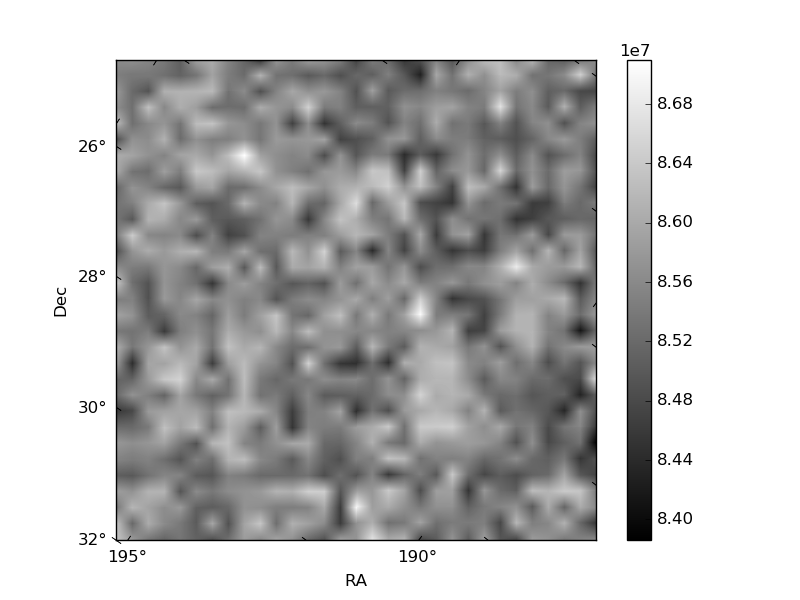
Quadrant B |
|---|---|---|---|
| Quadrant D | 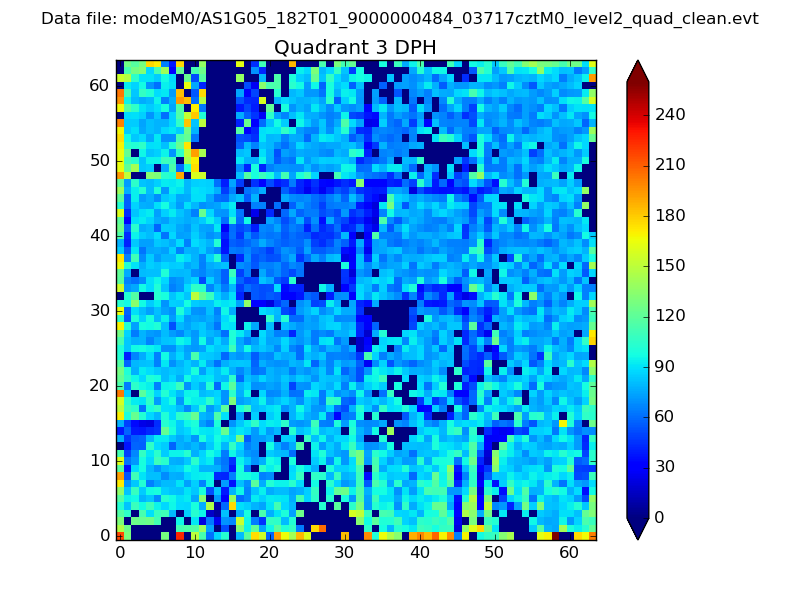 |
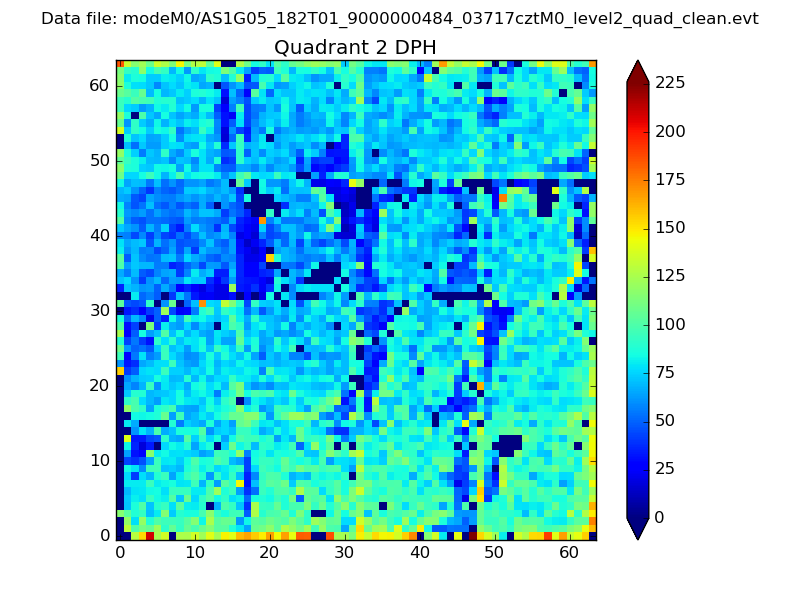 |
Quadrant C |
| Plot type | Count rate plots | Images |
|---|---|---|
| Comparison with Poisson distribution Blue bars denote a histogram of data divided into 1 sec bins. Red curve is a Poisson curve with rate = median count rate of data. |
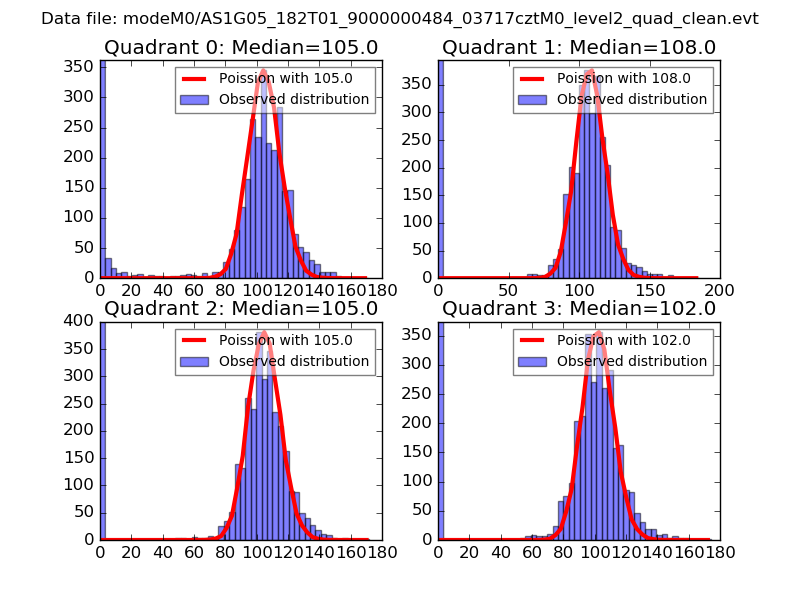 |
 |
| Quadrant-wise count rates Data is divided into 100 sec bins |
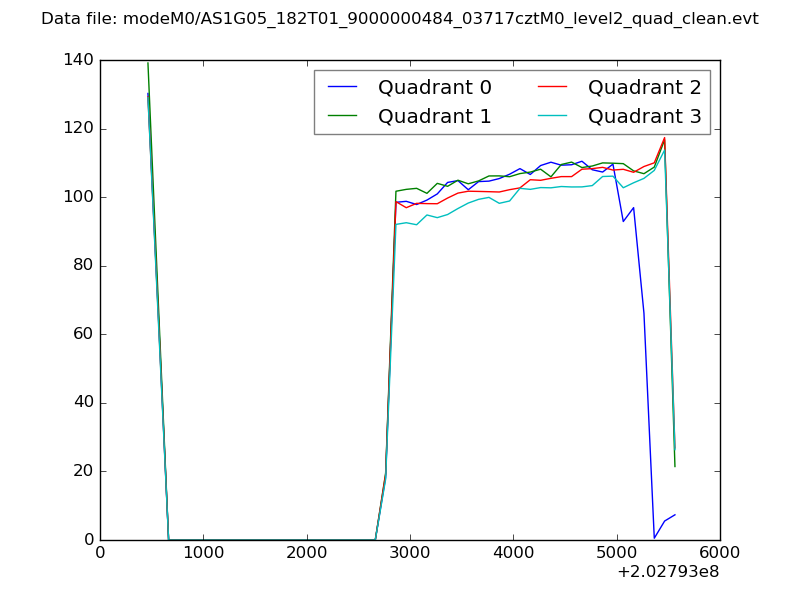 |
|
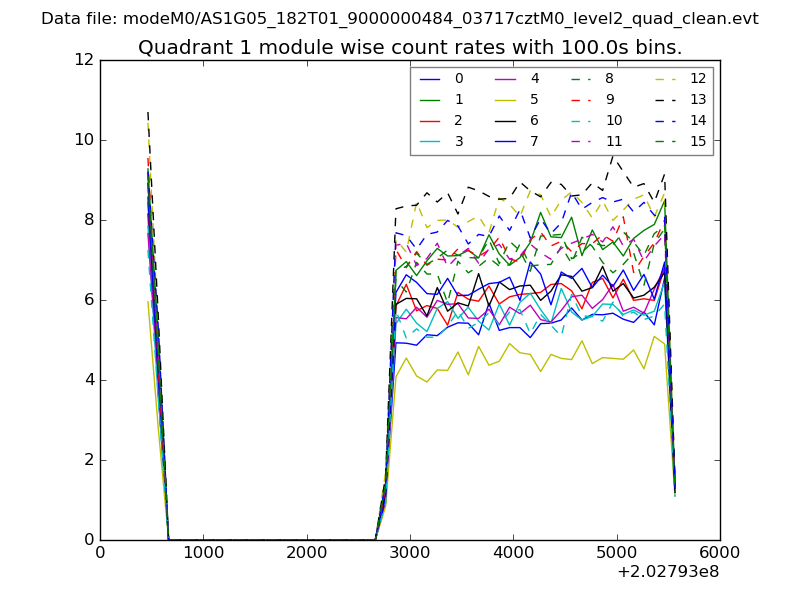
| Module-wise count rates for Quadrant A Data is divided into 100 sec bins |
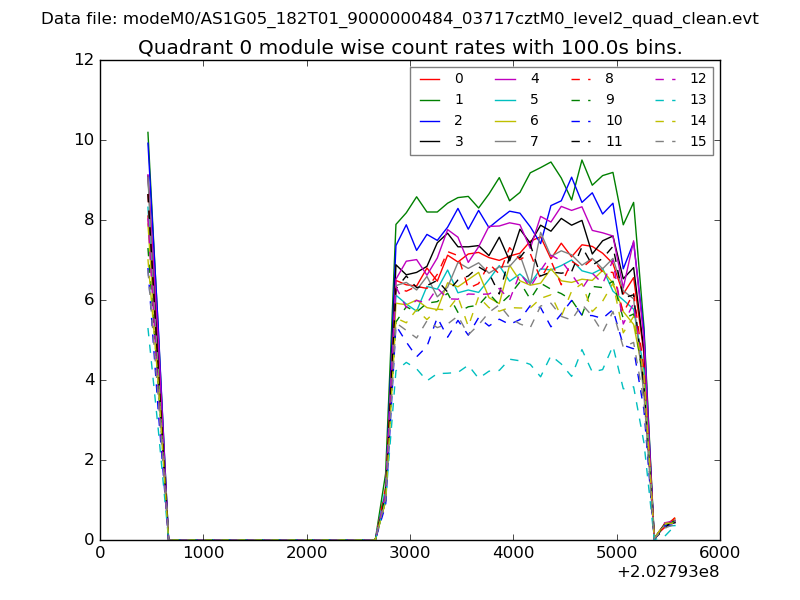 |
 |
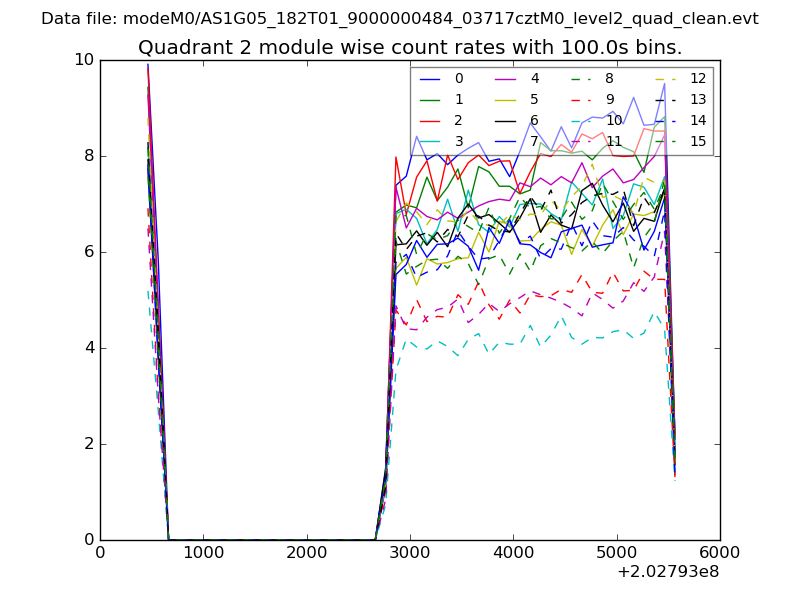
| Module-wise count rates for Quadrant B Data is divided into 100 sec bins |
 |
 |
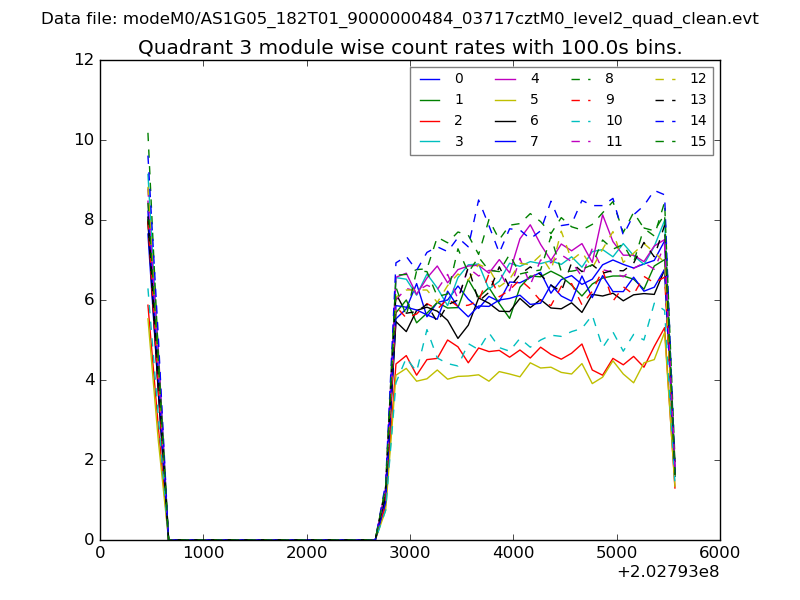
| Module-wise count rates for Quadrant C Data is divided into 100 sec bins |
 |
 |
| Module-wise count rates for Quadrant D Data is divided into 100 sec bins |
 |
 |
| Parameter | Plot |
|---|---|
| CZT HV Monitor | 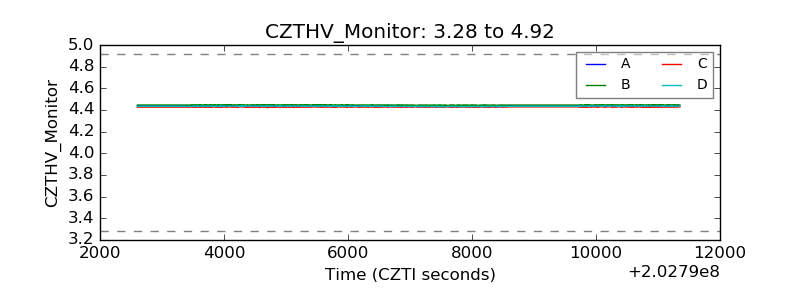 |
| D_VDD | 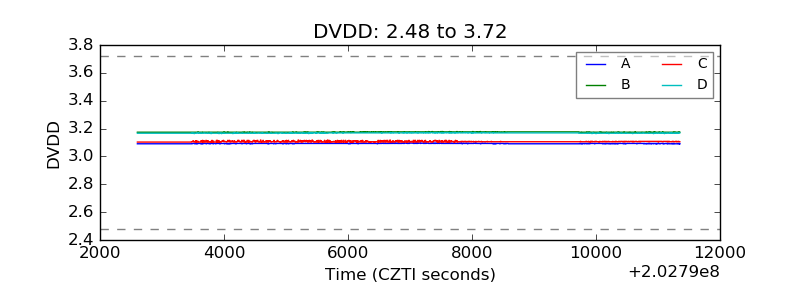 |
| Temperature 1 | 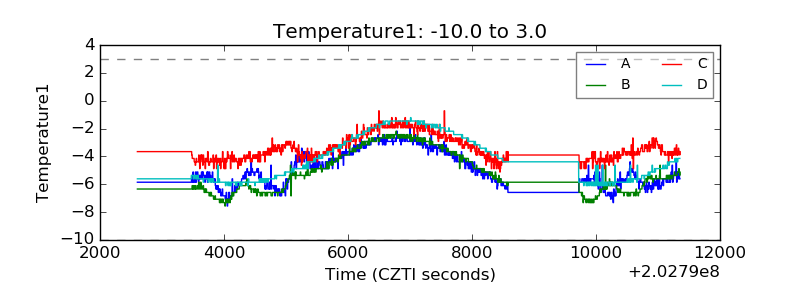 |
| Veto HV Monitor | 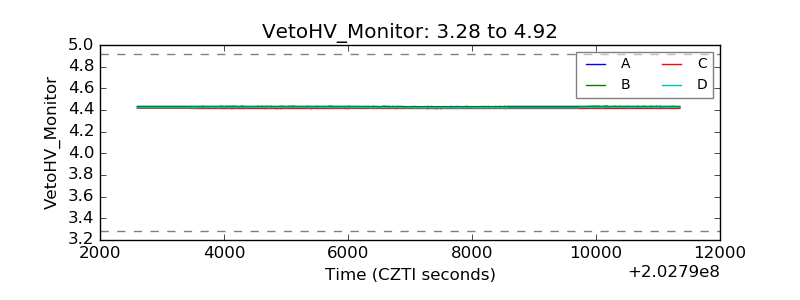 |
| Veto LLD | 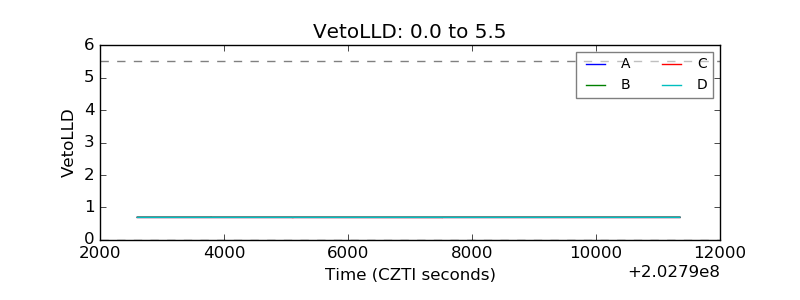 |
| Alpha Counter |  |
| _CPM_Rate | 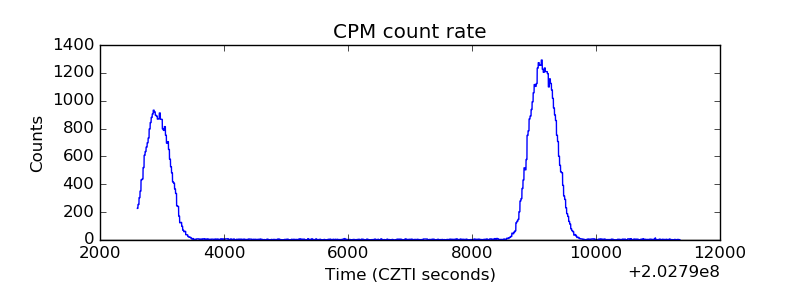 |
| CZT Counter | 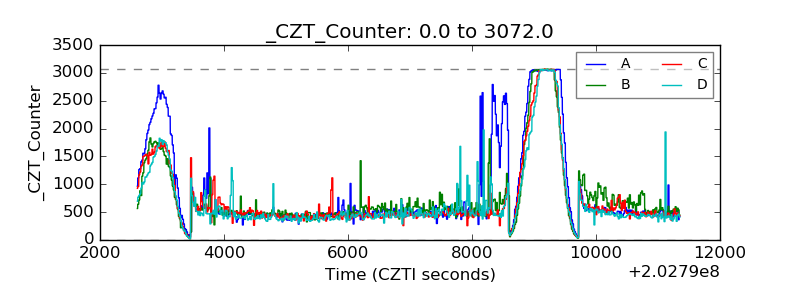 |
| +2.5 Volts monitor | 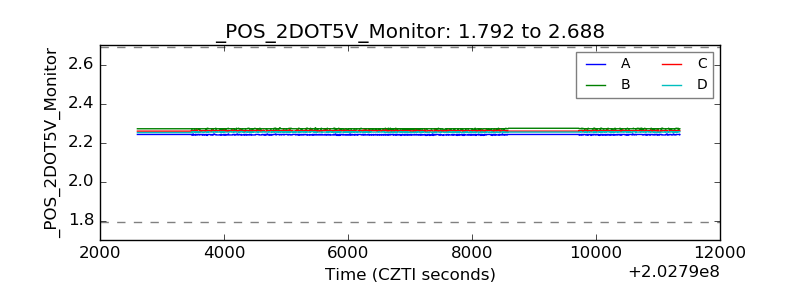 |
| +5 Volts monitor |  |
| Veto Counter | 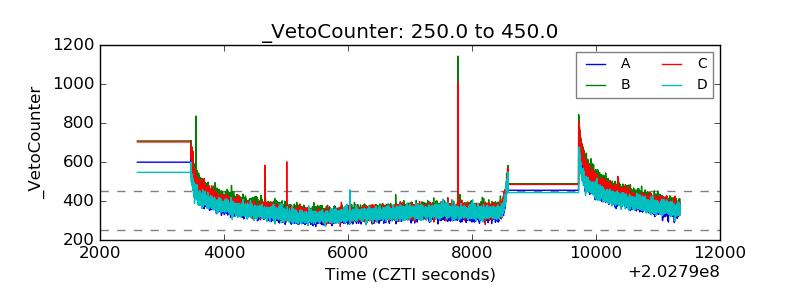 |