| Param | Original file | Final file |
|---|---|---|
| Filename | modeM0/AS1G05_182T01_9000000484_03718cztM0_level2.evt | modeM0/AS1G05_182T01_9000000484_03718cztM0_level2_quad_clean.evt |
| Size (bytes) | 594,429,120 | 55,687,680 |
| Size | 566.9 MB | 53.1 MB |
| Events in quadrant A | 3,467,814 | 335,564 |
| Events in quadrant B | 7,054,822 | 244,684 |
| Events in quadrant C | 3,791,958 | 329,032 |
| Events in quadrant D | 3,244,226 | 319,729 |
| Mode SS | |||
|---|---|---|---|
| Quadrant | BADHDUFLAG | Total packets | Discarded packets |
| A | 0 | 132 | 0 |
| B | 0 | 132 | 0 |
| C | 0 | 132 | 0 |
| D | 0 | 132 | 0 |
| Mode M9 | |||
|---|---|---|---|
| Quadrant | BADHDUFLAG | Total packets | Discarded packets |
| A | 0 | 18 | 0 |
| B | 0 | 18 | 0 |
| C | 0 | 18 | 0 |
| D | 0 | 19 | 0 |
| Mode M0 | |||
|---|---|---|---|
| Quadrant | BADHDUFLAG | Total packets | Discarded packets |
| A | 0 | 14350 | 3 |
| B | 0 | 25188 | 2 |
| C | 0 | 15487 | 2 |
| D | 0 | 14036 | 2 |
| Quadrant | Total seconds | Saturated seconds | Saturation percentage |
|---|---|---|---|
| A | 6541 | 137 | 2.094481% |
| B | 6541 | 1760 | 26.907201% |
| C | 6541 | 103 | 1.574683% |
| D | 6541 | 83 | 1.268919% |
Noise dominated data is calculated using 1-second bins in cleaned event files. If a bin has >2000 counts, and if more than 50% of those come from <1% of pixels, then it is considered to be noise-dominated and hence unusable.
| Quadrant | # 1 sec bins | Bins with >0 counts | Bins with >2000 counts | High rate bins dominated by noise | Noise dominated (total time) | Noise dominated (detector-on time) | Marked lightcurve |
|---|---|---|---|---|---|---|---|
| A | 7746 | 6541 | 26 | 26 | 0.34% | 0.40% | 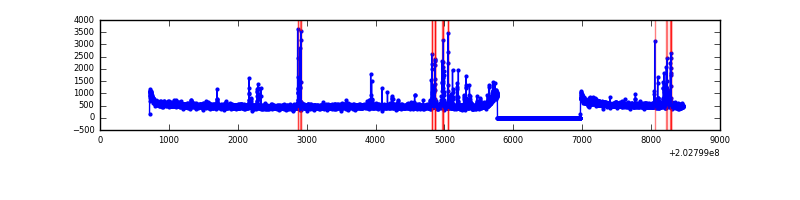 |
| B | 7746 | 6542 | 1518 | 1518 | 19.60% | 23.20% | 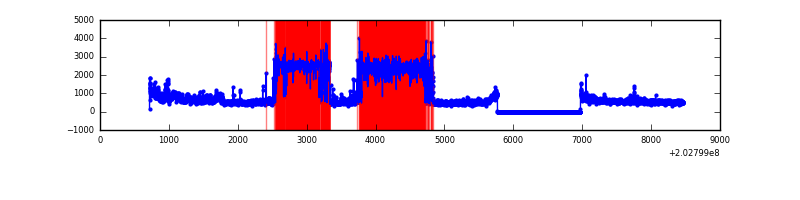 |
| C | 7746 | 6542 | 30 | 30 | 0.39% | 0.46% | 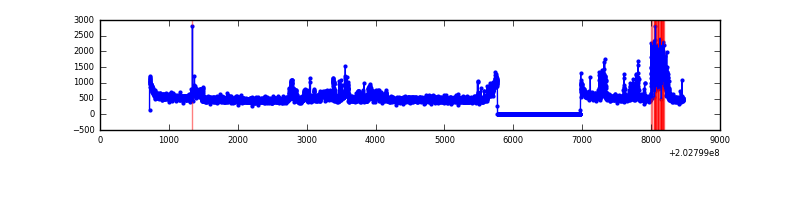 |
| D | 7746 | 6541 | 38 | 38 | 0.49% | 0.58% | 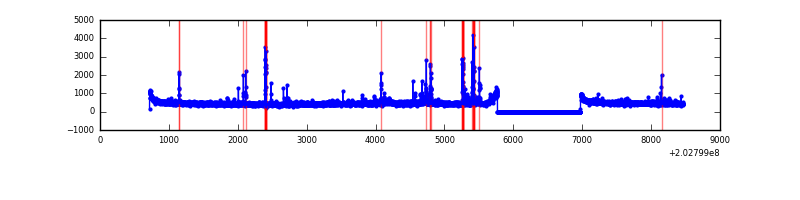 |
Top three noisy pixels from each quadrant. If the there are fewer than three noisy pixels in the level2.evt file, extra rows are filled as -1
| Pixel properties | Quadrant properties | ||||||
|---|---|---|---|---|---|---|---|
| Quadrant | DetID | PixID | Counts | Sigma | Mean | Median | Sigma |
| A | 13 | 251 | 79758 | 468.88 | 830 | 811 | 168.4 |
| A | 0 | 118 | 69490 | 407.89 | 830 | 811 | 168.4 |
| A | 0 | 50 | 61475 | 360.29 | 830 | 811 | 168.4 |
| B | 0 | 173 | 3769000 | 26446.18 | 742 | 725 | 142.5 |
| B | 2 | 249 | 188710 | 1319.3 | 742 | 725 | 142.5 |
| B | 15 | 204 | 179660 | 1255.79 | 742 | 725 | 142.5 |
| C | 2 | 53 | 691402 | 3737.25 | 792 | 797 | 184.8 |
| C | 13 | 61 | 6906 | 33.06 | 792 | 797 | 184.8 |
| C | 10 | 65 | 4500 | 20.04 | 792 | 797 | 184.8 |
| D | 12 | 221 | 47271 | 244.03 | 790 | 767 | 190.6 |
| D | 5 | 233 | 43940 | 226.55 | 790 | 767 | 190.6 |
| D | 6 | 112 | 41204 | 212.2 | 790 | 767 | 190.6 |
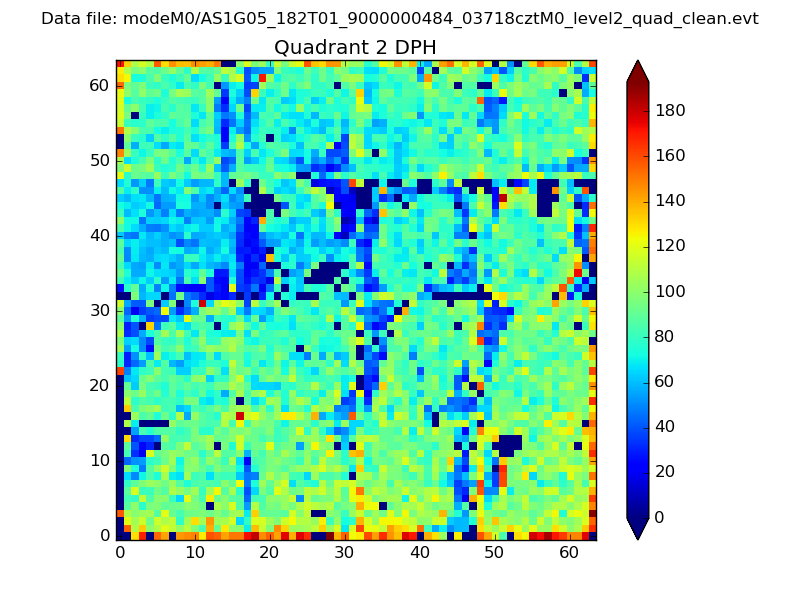
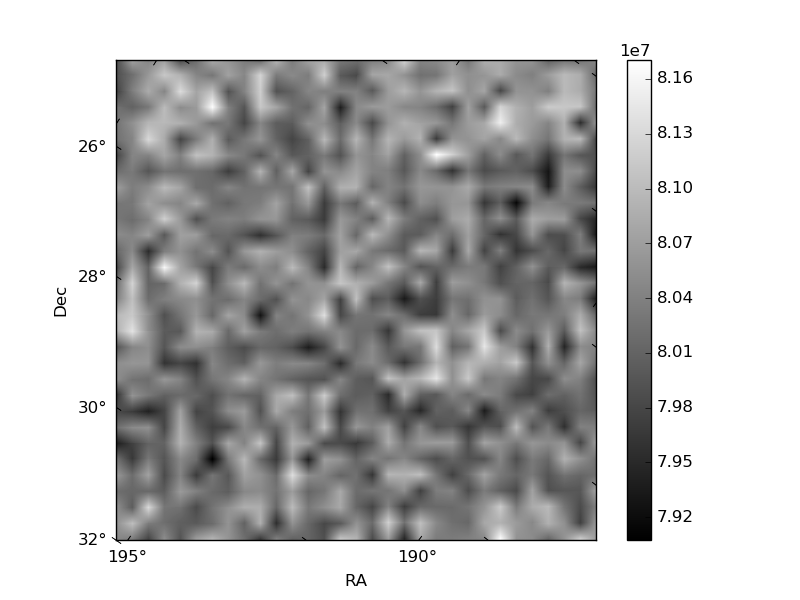
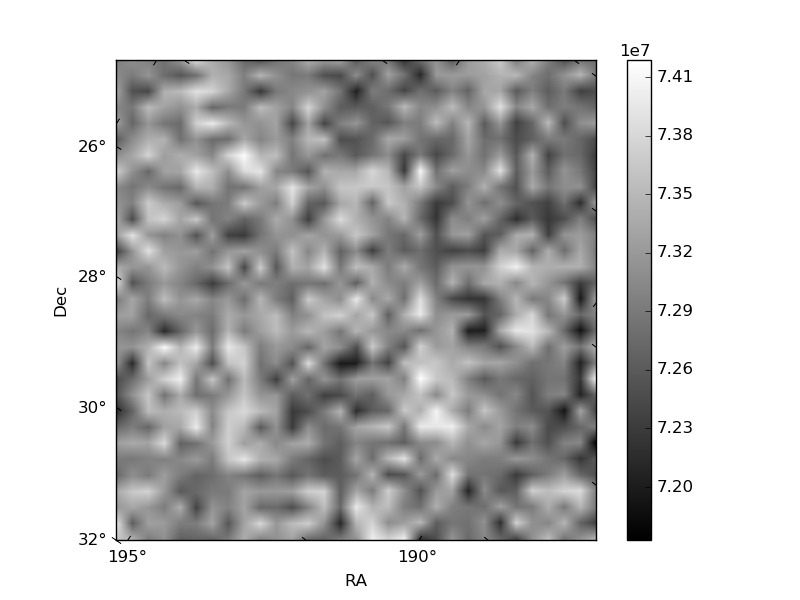
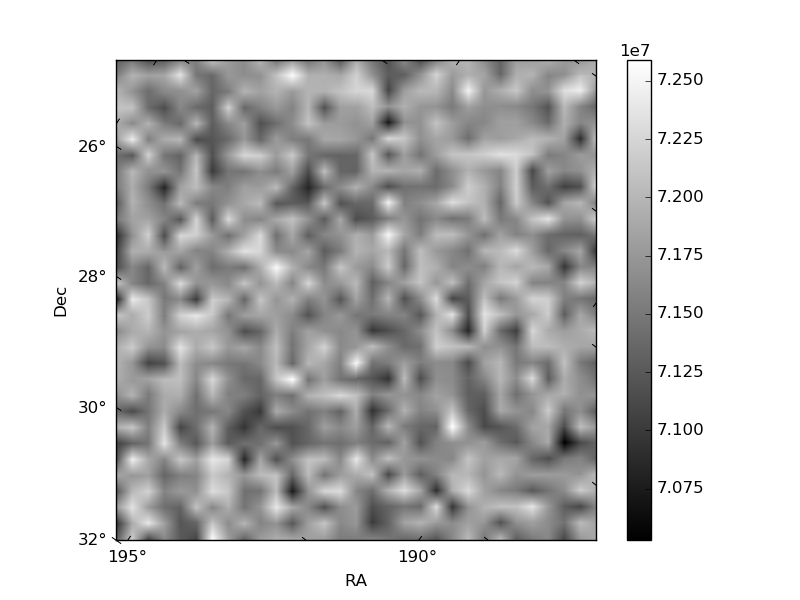
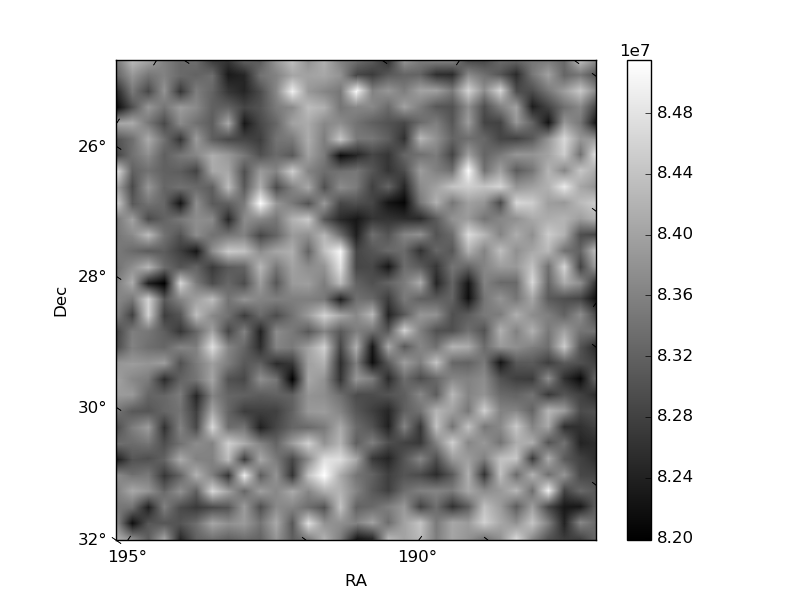
Histogram calculated using DETX and DETY for each event in the final _common_clean file
| Quadrant A |  |
 |
Quadrant B |
|---|---|---|---|
| Quadrant D | 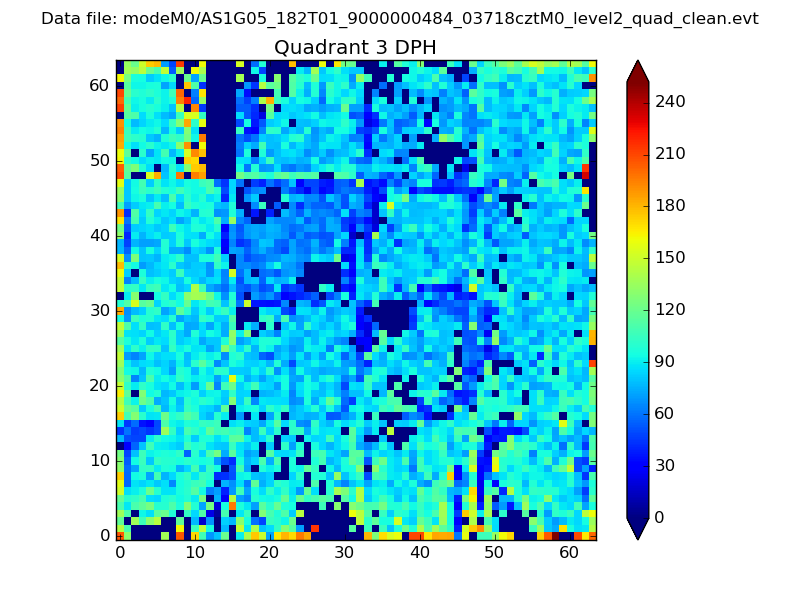 |
 |
Quadrant C |
| Plot type | Count rate plots | Images |
|---|---|---|
| Comparison with Poisson distribution Blue bars denote a histogram of data divided into 1 sec bins. Red curve is a Poisson curve with rate = median count rate of data. |
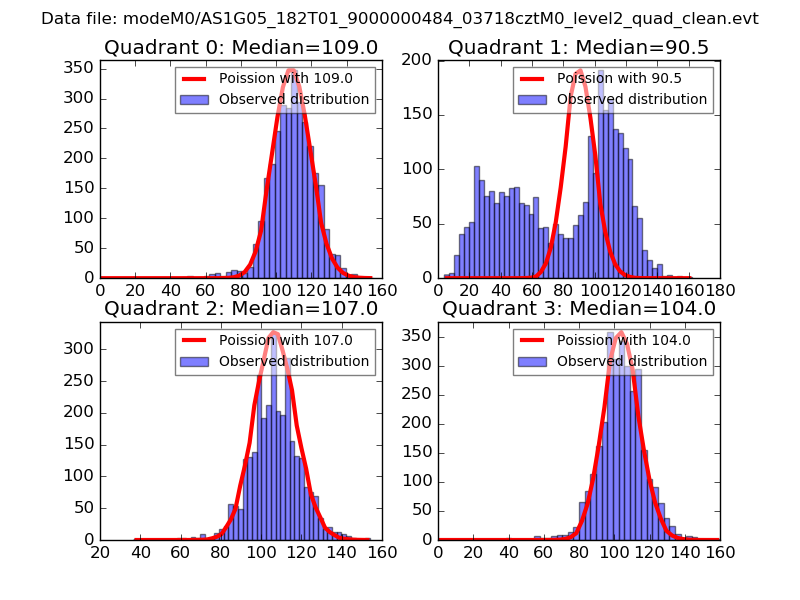 |
 |
| Quadrant-wise count rates Data is divided into 100 sec bins |
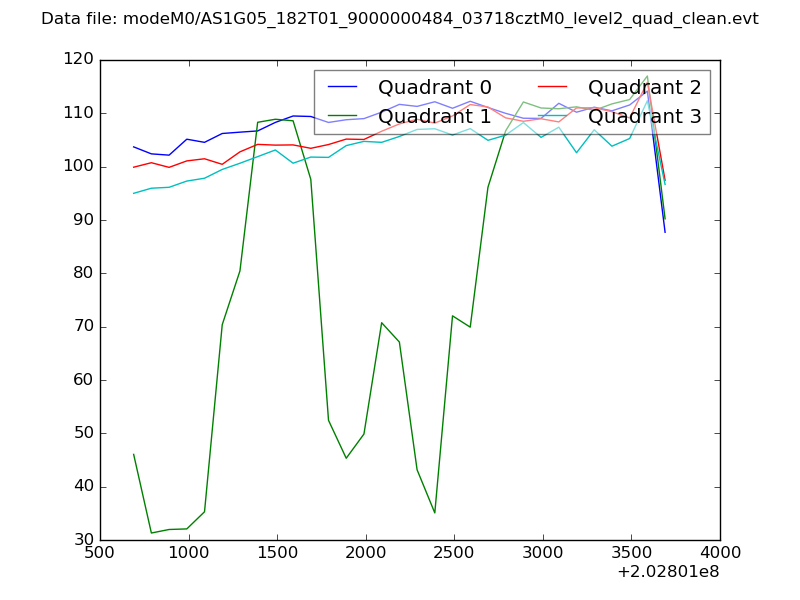 |
|
| Module-wise count rates for Quadrant A Data is divided into 100 sec bins |
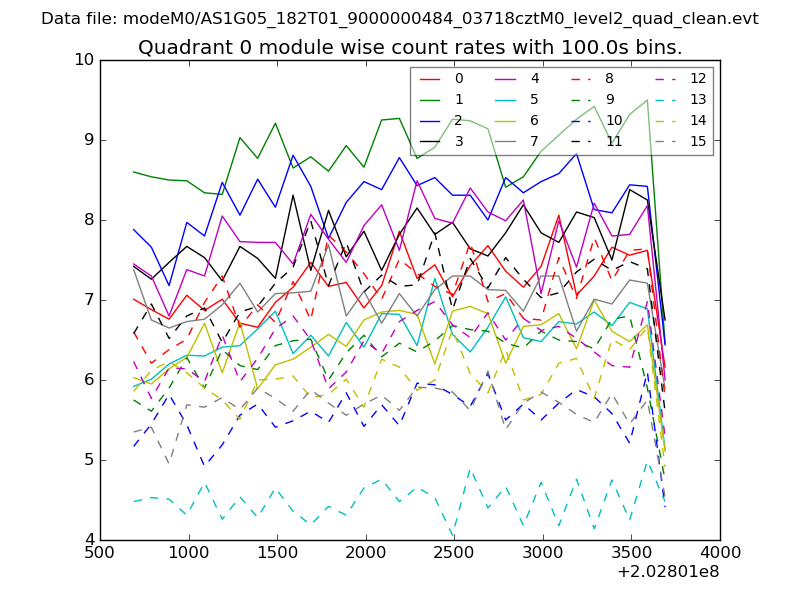 |
 |
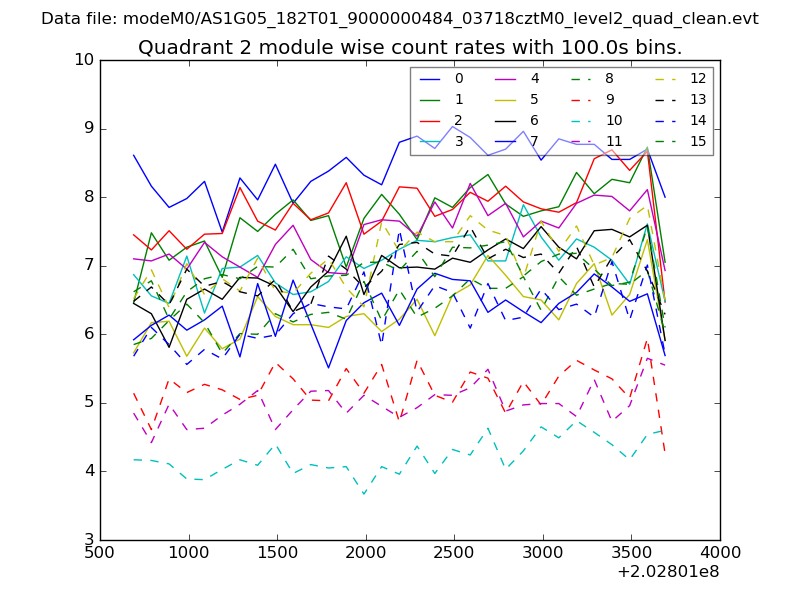
| Module-wise count rates for Quadrant B Data is divided into 100 sec bins |
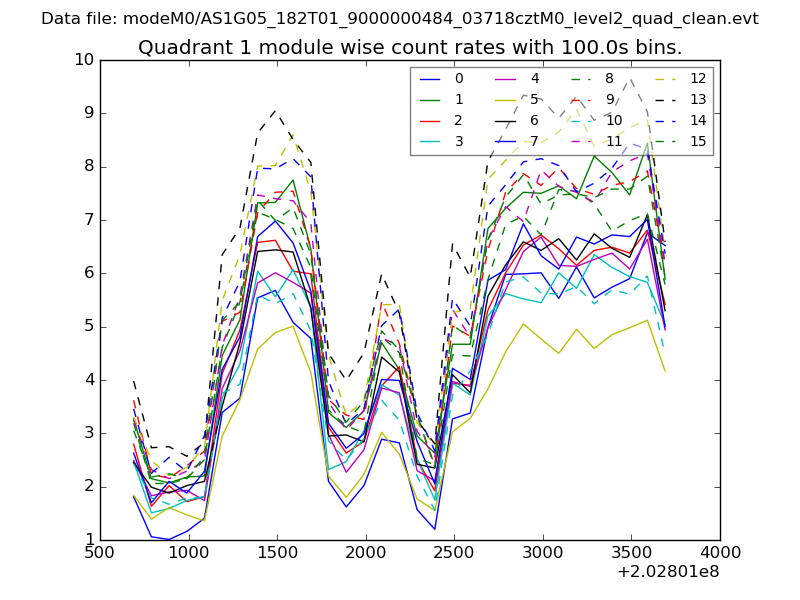 |
 |
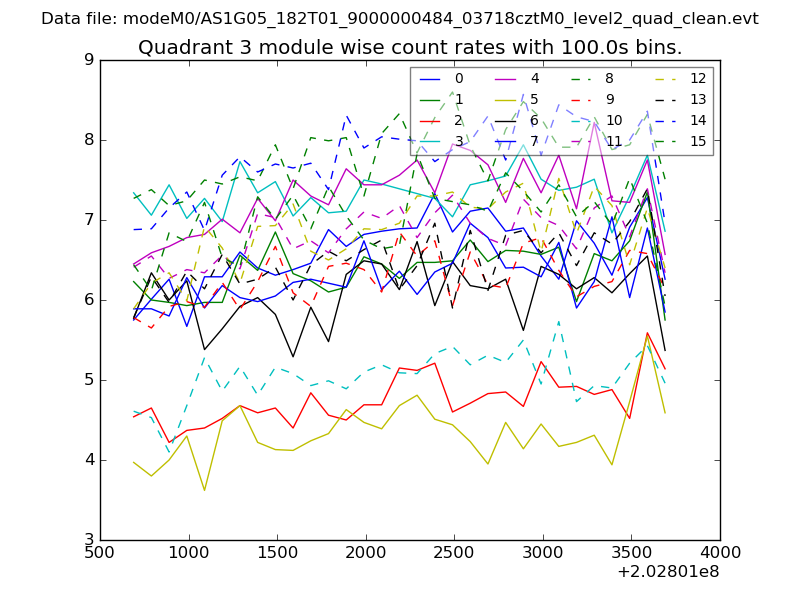
| Module-wise count rates for Quadrant C Data is divided into 100 sec bins |
 |
 |
| Module-wise count rates for Quadrant D Data is divided into 100 sec bins |
 |
 |
| Parameter | Plot |
|---|---|
| CZT HV Monitor | 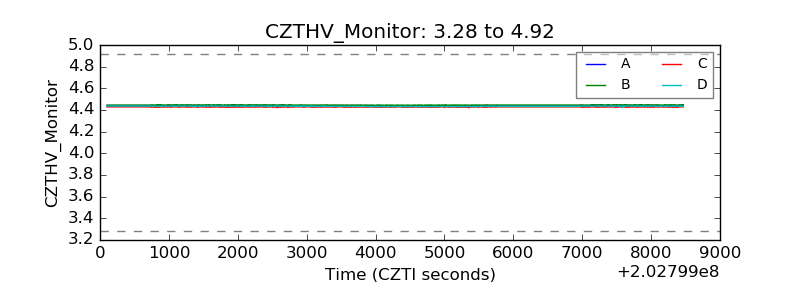 |
| D_VDD | 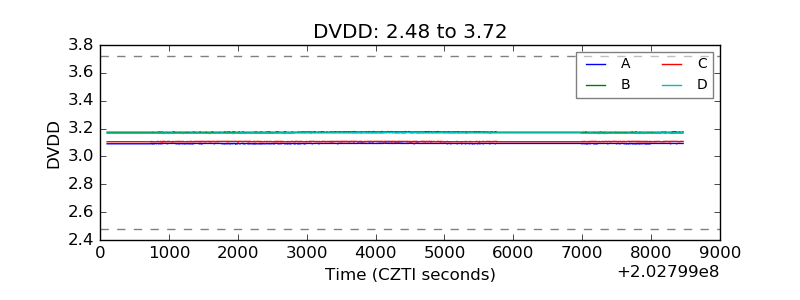 |
| Temperature 1 | 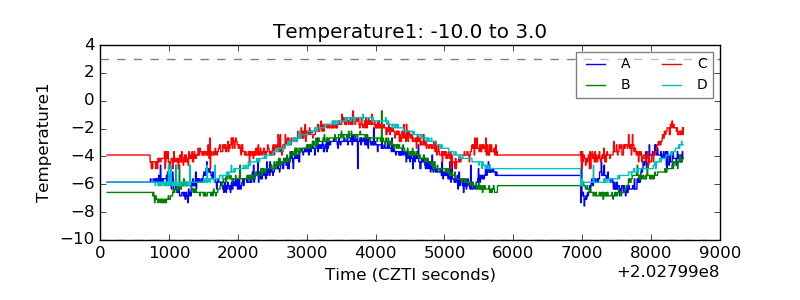 |
| Veto HV Monitor | 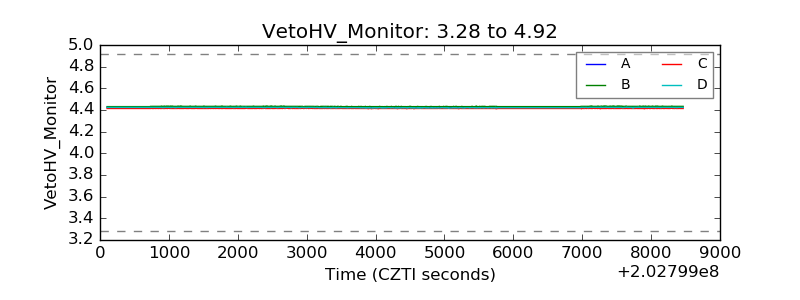 |
| Veto LLD | 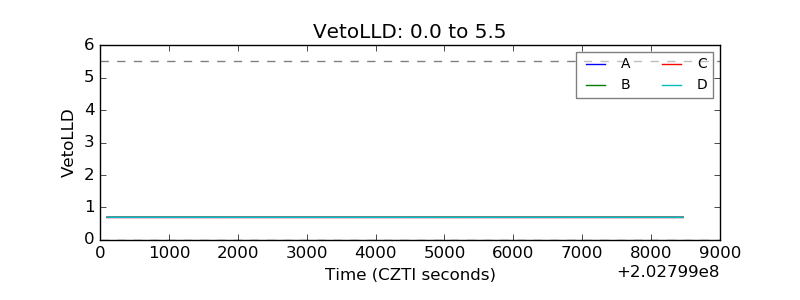 |
| Alpha Counter | 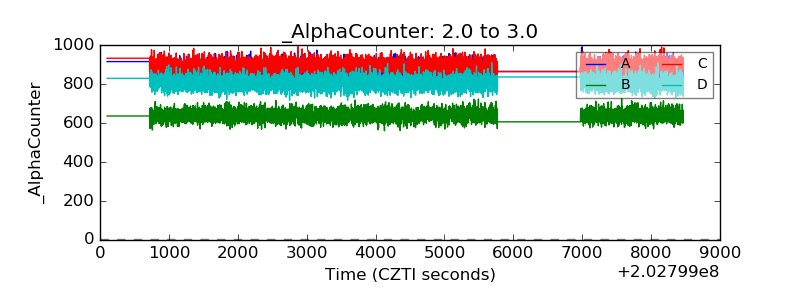 |
| _CPM_Rate | 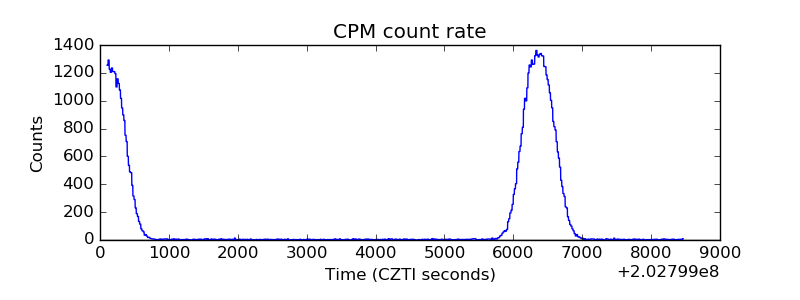 |
| CZT Counter | 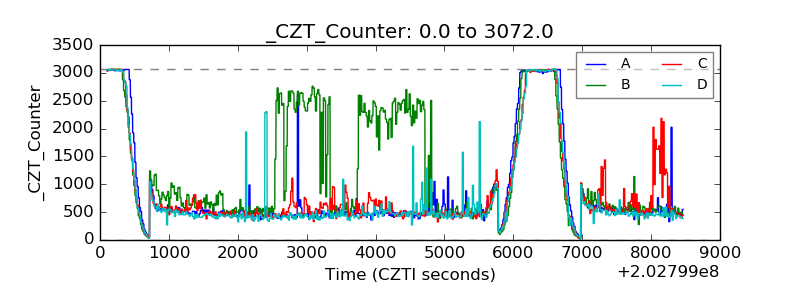 |
| +2.5 Volts monitor |  |
| +5 Volts monitor |  |
| Veto Counter | 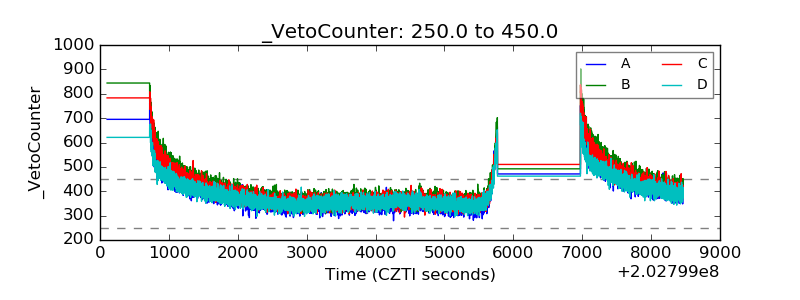 |