| Param | Original file | Final file |
|---|---|---|
| Filename | modeM0/AS1G05_182T01_9000000484_03719cztM0_level2.evt | modeM0/AS1G05_182T01_9000000484_03719cztM0_level2_quad_clean.evt |
| Size (bytes) | 498,899,520 | 67,190,400 |
| Size | 475.8 MB | 64.1 MB |
| Events in quadrant A | 3,582,362 | 405,436 |
| Events in quadrant B | 3,812,436 | 405,079 |
| Events in quadrant C | 4,060,749 | 398,734 |
| Events in quadrant D | 3,226,907 | 386,013 |
| Mode SS | |||
|---|---|---|---|
| Quadrant | BADHDUFLAG | Total packets | Discarded packets |
| A | 0 | 128 | 0 |
| B | 0 | 128 | 0 |
| C | 0 | 128 | 0 |
| D | 0 | 128 | 0 |
| Mode M9 | |||
|---|---|---|---|
| Quadrant | BADHDUFLAG | Total packets | Discarded packets |
| A | 0 | 22 | 0 |
| B | 0 | 22 | 0 |
| C | 0 | 22 | 0 |
| D | 0 | 23 | 0 |
| Mode M0 | |||
|---|---|---|---|
| Quadrant | BADHDUFLAG | Total packets | Discarded packets |
| A | 0 | 14458 | 3 |
| B | 0 | 15190 | 2 |
| C | 0 | 15992 | 2 |
| D | 0 | 13614 | 2 |
| Quadrant | Total seconds | Saturated seconds | Saturation percentage |
|---|---|---|---|
| A | 6287 | 198 | 3.149356% |
| B | 6287 | 213 | 3.387943% |
| C | 6287 | 285 | 4.533164% |
| D | 6287 | 96 | 1.526960% |
Noise dominated data is calculated using 1-second bins in cleaned event files. If a bin has >2000 counts, and if more than 50% of those come from <1% of pixels, then it is considered to be noise-dominated and hence unusable.
| Quadrant | # 1 sec bins | Bins with >0 counts | Bins with >2000 counts | High rate bins dominated by noise | Noise dominated (total time) | Noise dominated (detector-on time) | Marked lightcurve |
|---|---|---|---|---|---|---|---|
| A | 7567 | 6287 | 56 | 56 | 0.74% | 0.89% | 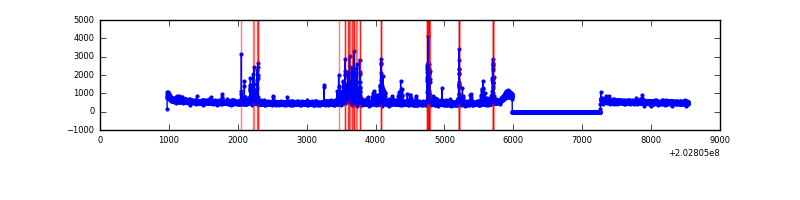 |
| B | 7567 | 6287 | 57 | 57 | 0.75% | 0.91% | 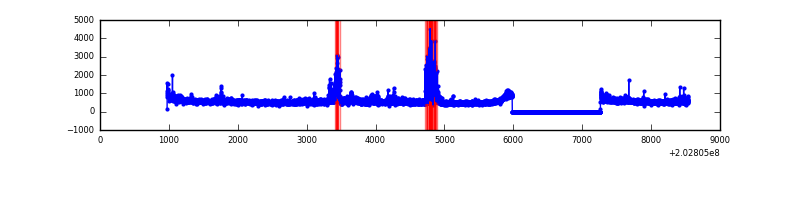 |
| C | 7567 | 6287 | 164 | 164 | 2.17% | 2.61% | 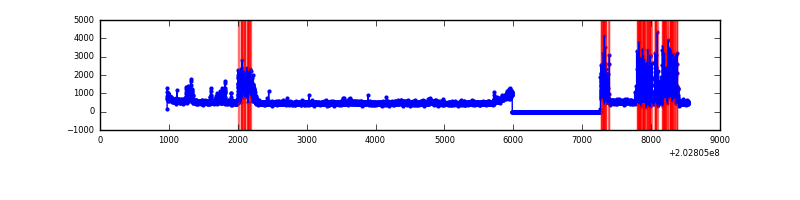 |
| D | 7567 | 6287 | 18 | 18 | 0.24% | 0.29% | 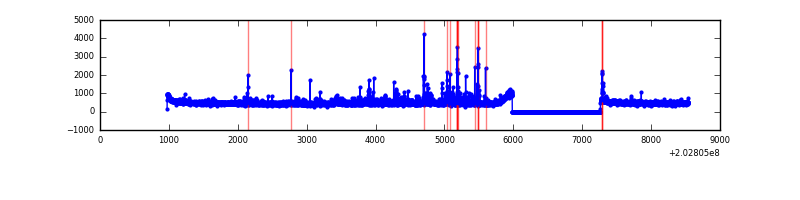 |
Top three noisy pixels from each quadrant. If the there are fewer than three noisy pixels in the level2.evt file, extra rows are filled as -1
| Pixel properties | Quadrant properties | ||||||
|---|---|---|---|---|---|---|---|
| Quadrant | DetID | PixID | Counts | Sigma | Mean | Median | Sigma |
| A | 0 | 118 | 332910 | 2029.5 | 812 | 797 | 163.6 |
| A | 0 | 50 | 42173 | 252.84 | 812 | 797 | 163.6 |
| A | 0 | 226 | 37822 | 226.26 | 812 | 797 | 163.6 |
| B | 2 | 249 | 271216 | 1725.42 | 817 | 798 | 156.7 |
| B | 15 | 204 | 244739 | 1556.48 | 817 | 798 | 156.7 |
| B | 4 | 81 | 72794 | 459.38 | 817 | 798 | 156.7 |
| C | 2 | 53 | 1019919 | 5653.51 | 773 | 776 | 180.3 |
| C | 1 | 16 | 15542 | 81.91 | 773 | 776 | 180.3 |
| C | 13 | 61 | 6392 | 31.15 | 773 | 776 | 180.3 |
| D | 14 | 34 | 90532 | 483.15 | 779 | 759 | 185.8 |
| D | 4 | 160 | 43278 | 228.83 | 779 | 759 | 185.8 |
| D | 13 | 223 | 23248 | 121.03 | 779 | 759 | 185.8 |
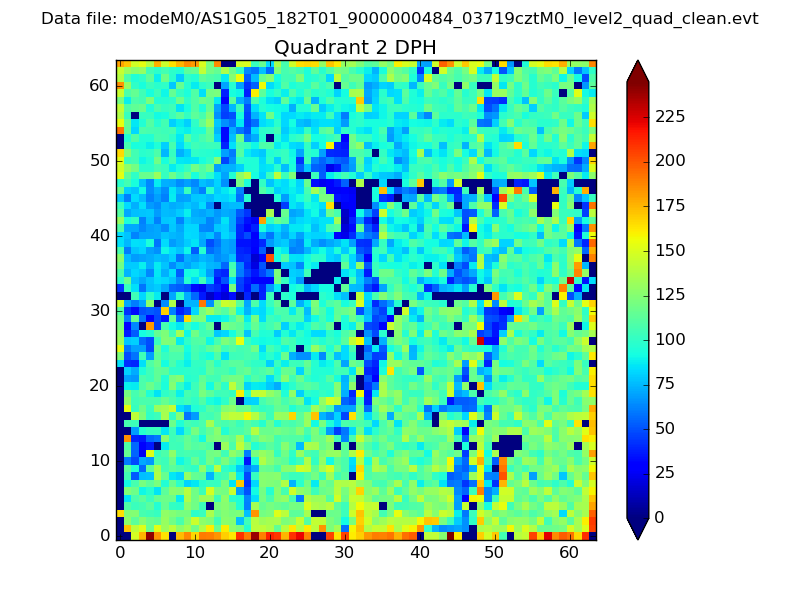
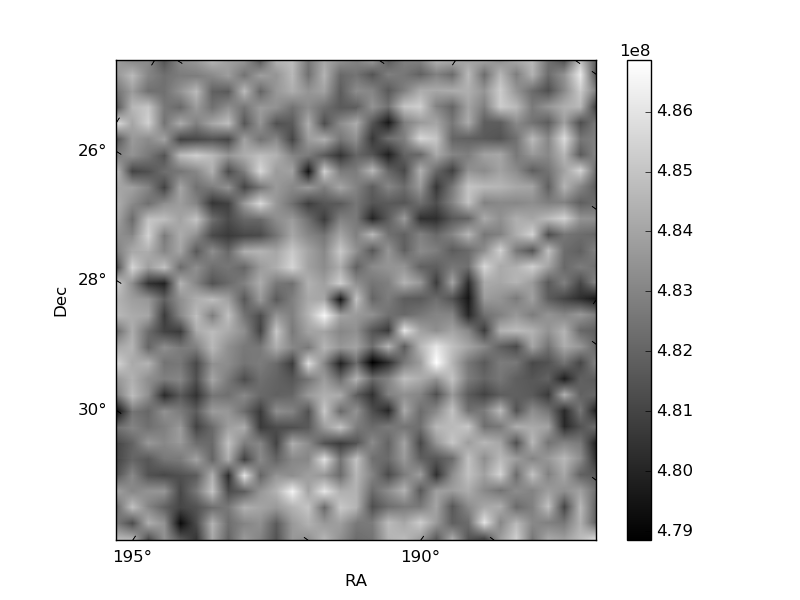
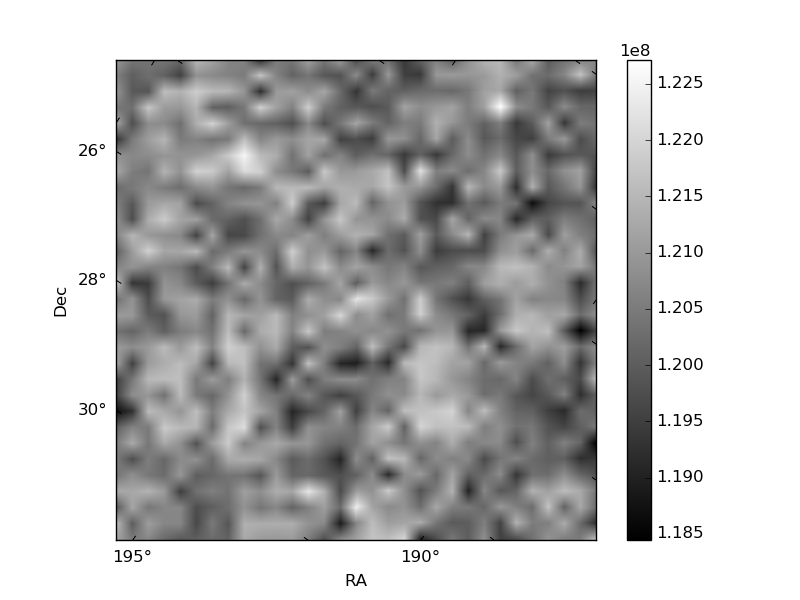
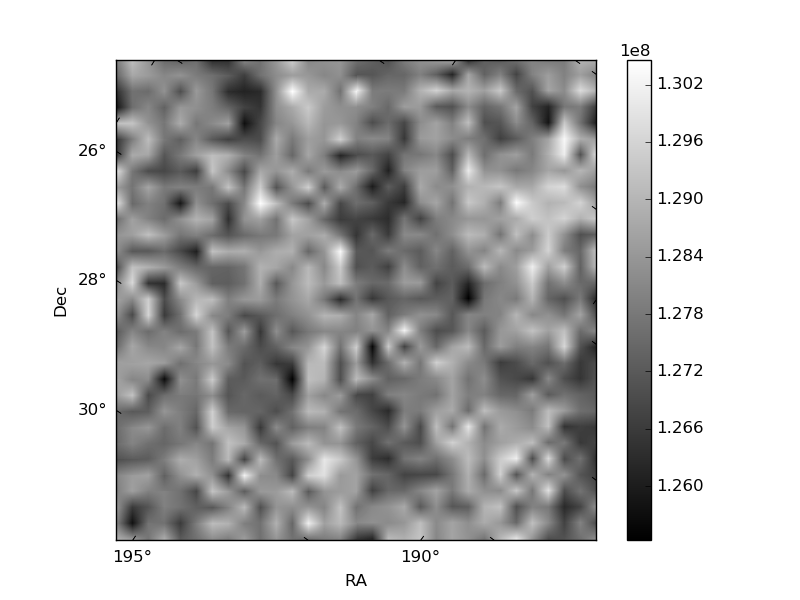
Histogram calculated using DETX and DETY for each event in the final _common_clean file
| Quadrant A | 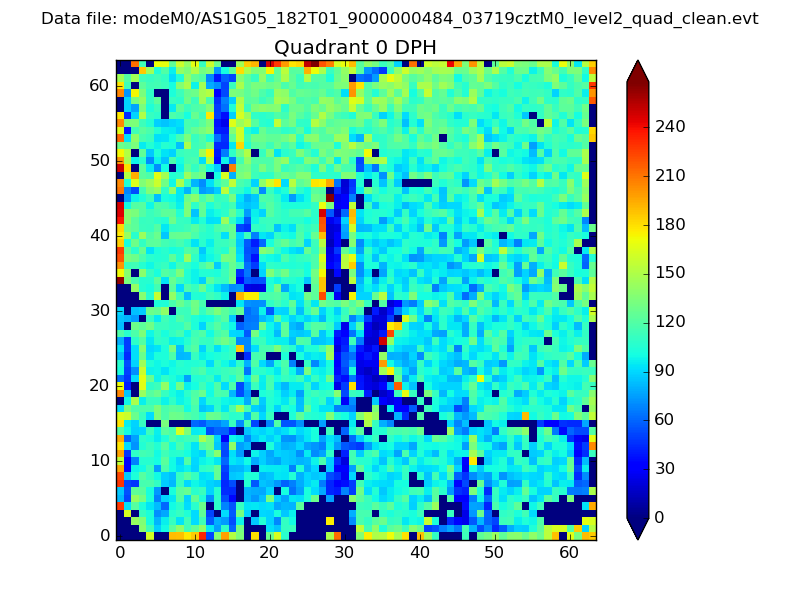 |
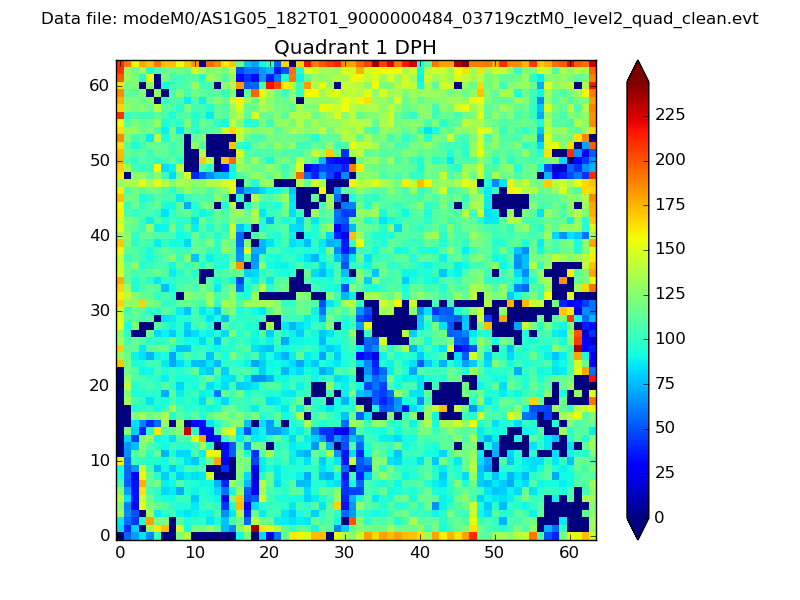 |
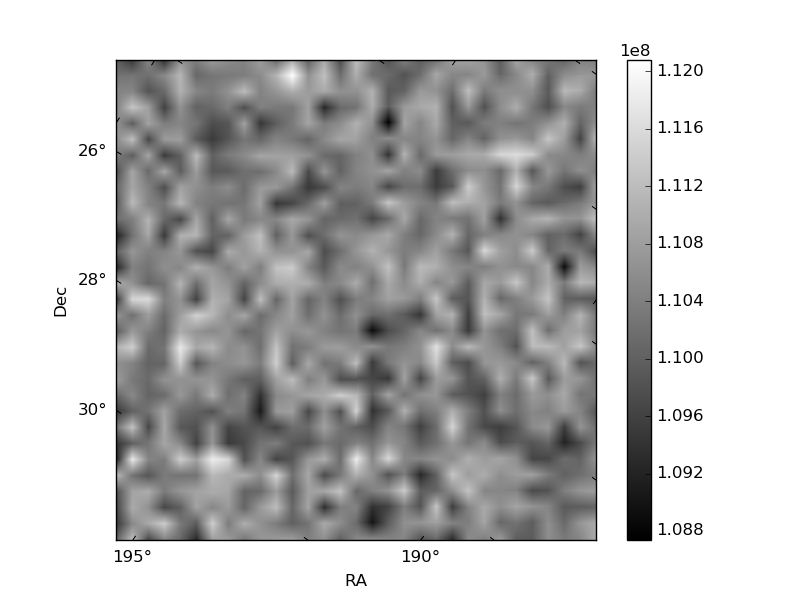
Quadrant B |
|---|---|---|---|
| Quadrant D | 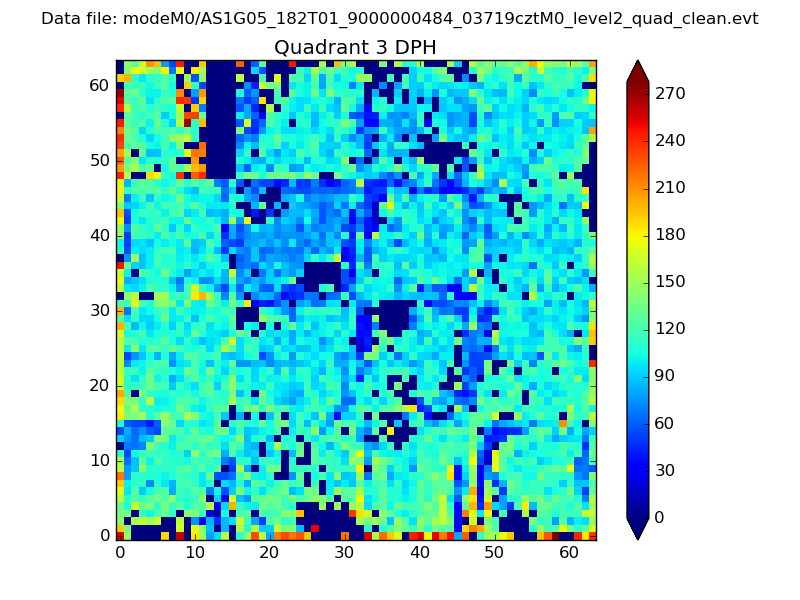 |
 |
Quadrant C |
| Plot type | Count rate plots | Images |
|---|---|---|
| Comparison with Poisson distribution Blue bars denote a histogram of data divided into 1 sec bins. Red curve is a Poisson curve with rate = median count rate of data. |
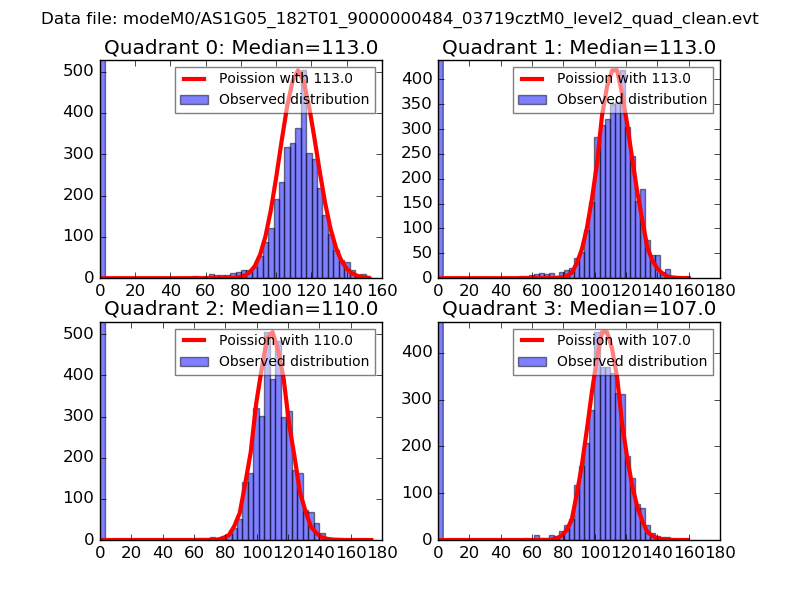 |
 |
| Quadrant-wise count rates Data is divided into 100 sec bins |
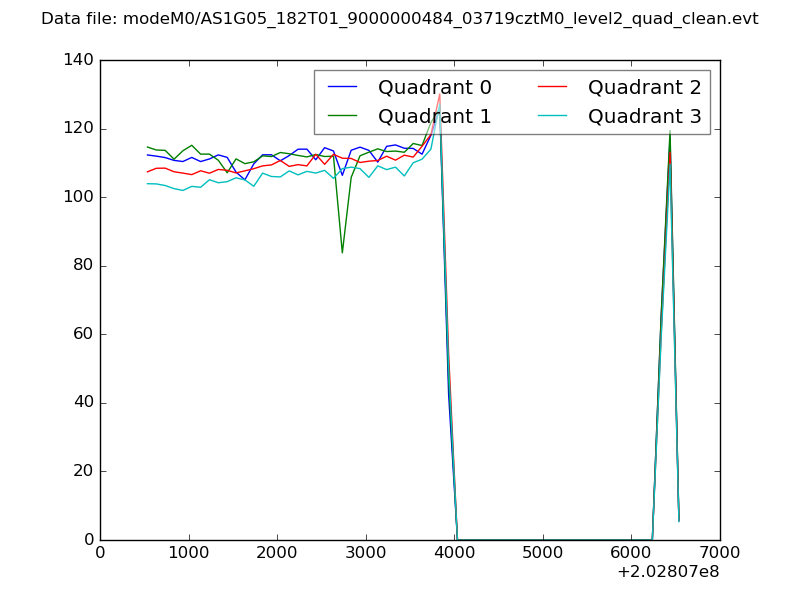 |
|
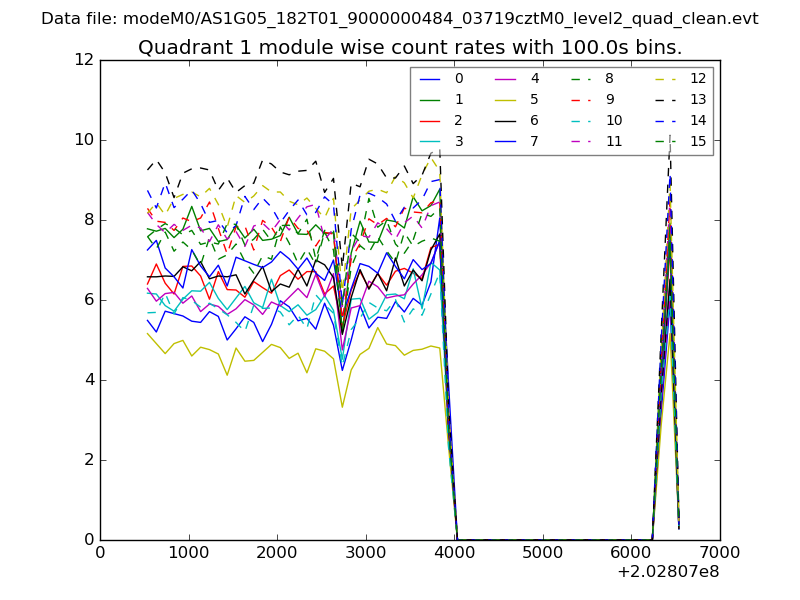
| Module-wise count rates for Quadrant A Data is divided into 100 sec bins |
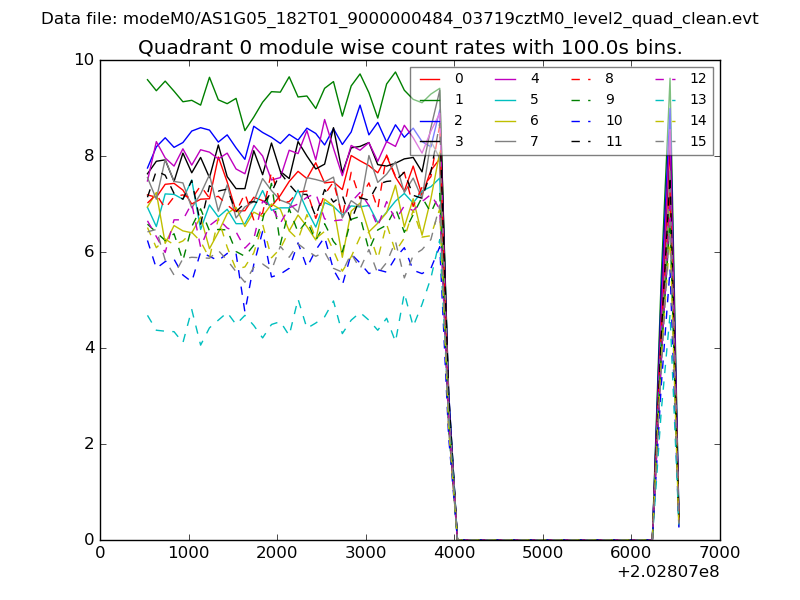 |
 |
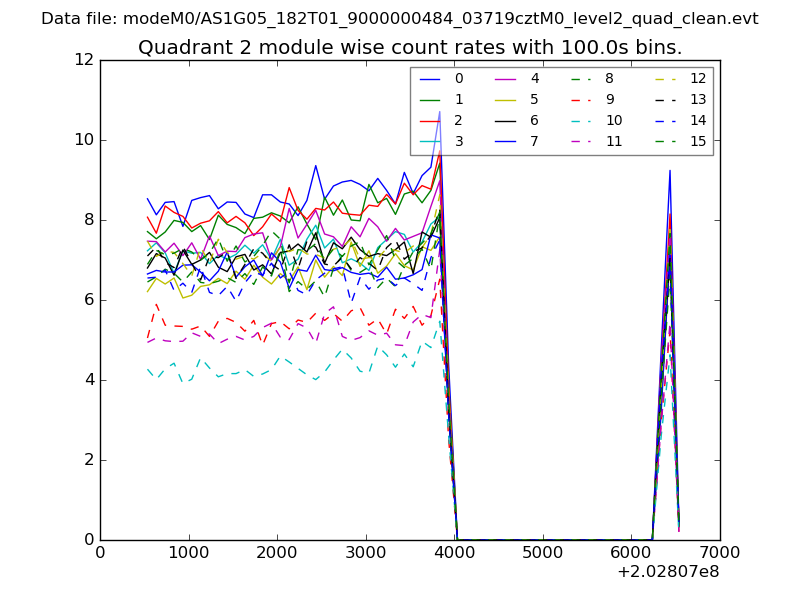
| Module-wise count rates for Quadrant B Data is divided into 100 sec bins |
 |
 |
| Module-wise count rates for Quadrant C Data is divided into 100 sec bins |
 |
 |
| Module-wise count rates for Quadrant D Data is divided into 100 sec bins |
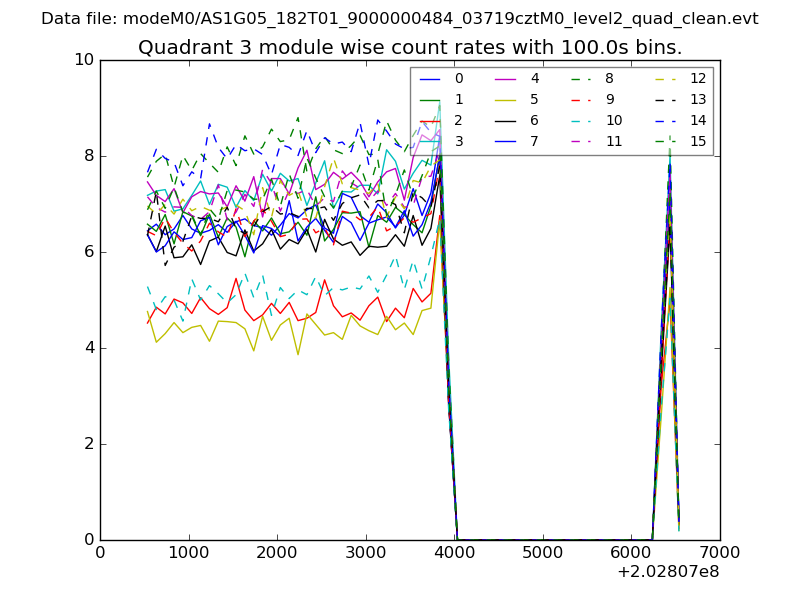 |
 |
| Parameter | Plot |
|---|---|
| CZT HV Monitor | 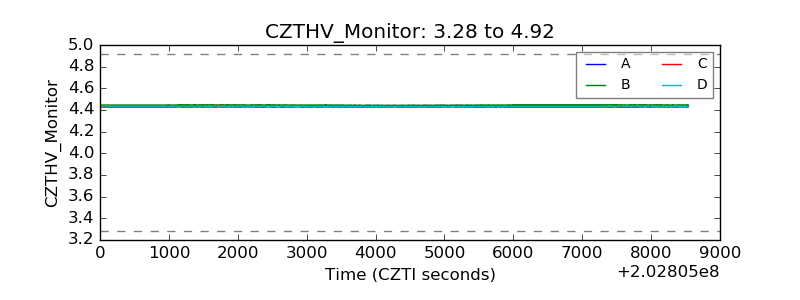 |
| D_VDD | 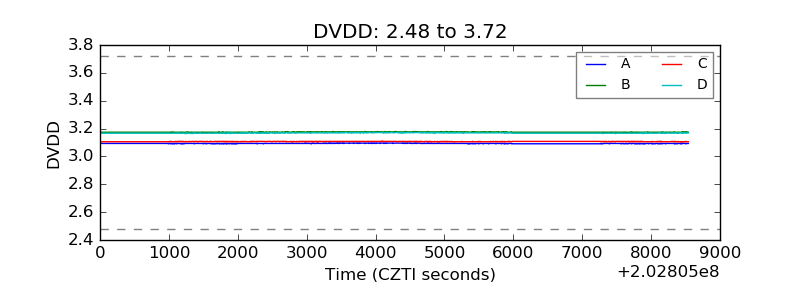 |
| Temperature 1 | 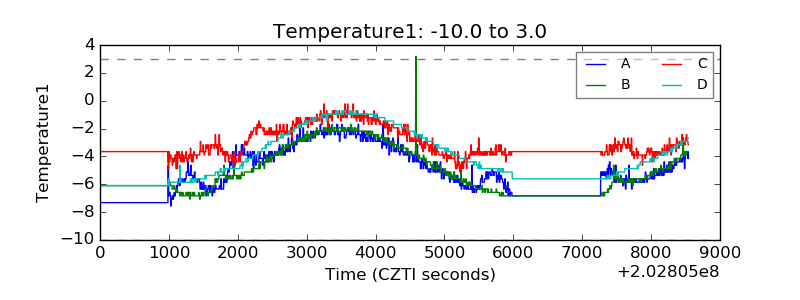 |
| Veto HV Monitor | 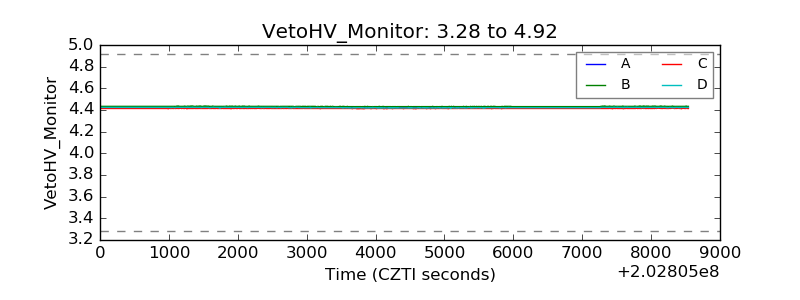 |
| Veto LLD | 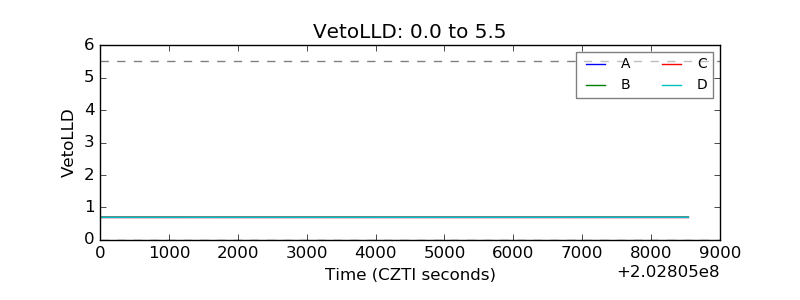 |
| Alpha Counter | 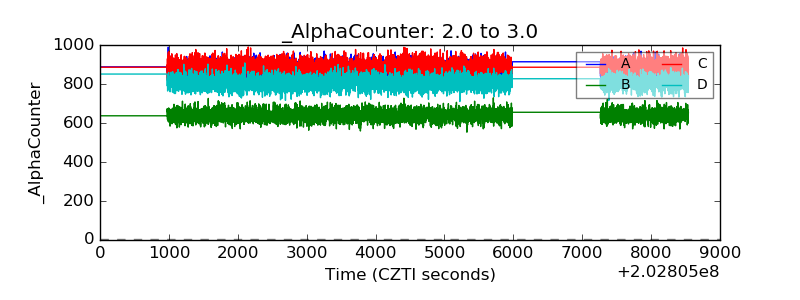 |
| _CPM_Rate | 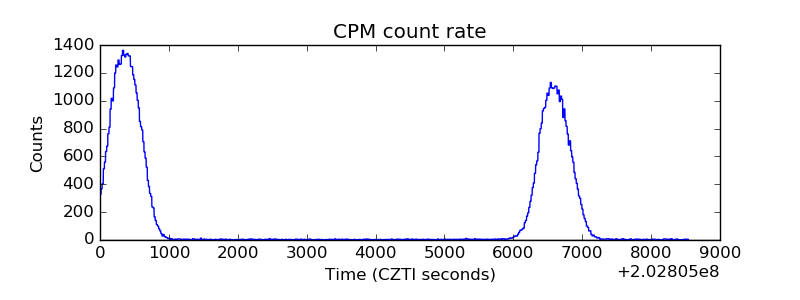 |
| CZT Counter | 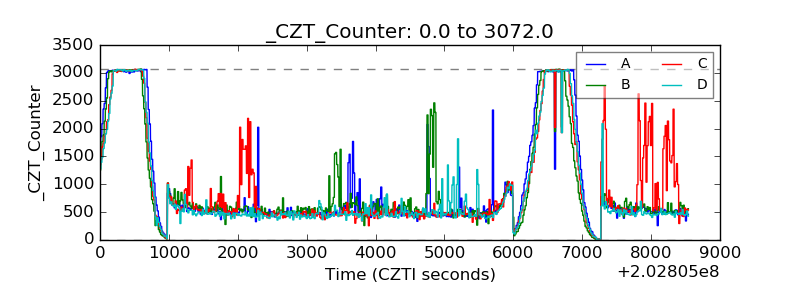 |
| +2.5 Volts monitor |  |
| +5 Volts monitor |  |
| Veto Counter | 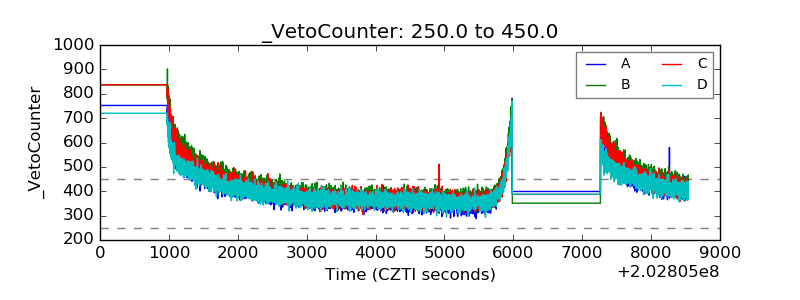 |