| Param | Original file | Final file |
|---|---|---|
| Filename | modeM0/AS1G05_182T01_9000000484_03721cztM0_level2.evt | modeM0/AS1G05_182T01_9000000484_03721cztM0_level2_quad_clean.evt |
| Size (bytes) | 481,112,640 | 84,605,760 |
| Size | 458.8 MB | 80.7 MB |
| Events in quadrant A | 3,624,804 | 531,294 |
| Events in quadrant B | 3,664,775 | 535,744 |
| Events in quadrant C | 3,275,370 | 520,740 |
| Events in quadrant D | 3,543,864 | 500,897 |
| Mode SS | |||
|---|---|---|---|
| Quadrant | BADHDUFLAG | Total packets | Discarded packets |
| A | 0 | 140 | 0 |
| B | 0 | 140 | 0 |
| C | 0 | 140 | 0 |
| D | 0 | 140 | 0 |
| Mode M9 | |||
|---|---|---|---|
| Quadrant | BADHDUFLAG | Total packets | Discarded packets |
| A | 0 | 17 | 0 |
| B | 0 | 17 | 0 |
| C | 0 | 17 | 0 |
| D | 0 | 18 | 0 |
| Mode M0 | |||
|---|---|---|---|
| Quadrant | BADHDUFLAG | Total packets | Discarded packets |
| A | 0 | 15031 | 3 |
| B | 0 | 14985 | 2 |
| C | 0 | 14199 | 2 |
| D | 0 | 15156 | 2 |
| Quadrant | Total seconds | Saturated seconds | Saturation percentage |
|---|---|---|---|
| A | 6786 | 228 | 3.359859% |
| B | 6786 | 175 | 2.578839% |
| C | 6786 | 150 | 2.210433% |
| D | 6786 | 220 | 3.241969% |
Noise dominated data is calculated using 1-second bins in cleaned event files. If a bin has >2000 counts, and if more than 50% of those come from <1% of pixels, then it is considered to be noise-dominated and hence unusable.
| Quadrant | # 1 sec bins | Bins with >0 counts | Bins with >2000 counts | High rate bins dominated by noise | Noise dominated (total time) | Noise dominated (detector-on time) | Marked lightcurve |
|---|---|---|---|---|---|---|---|
| A | 7831 | 6786 | 49 | 49 | 0.63% | 0.72% | 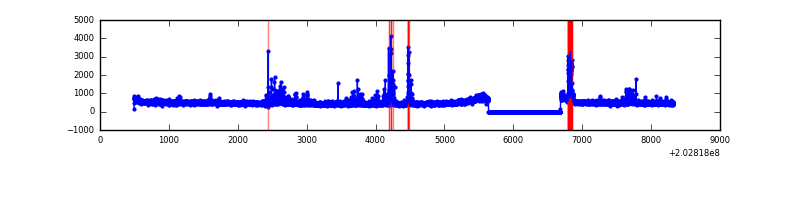 |
| B | 7831 | 6786 | 3 | 3 | 0.04% | 0.04% | 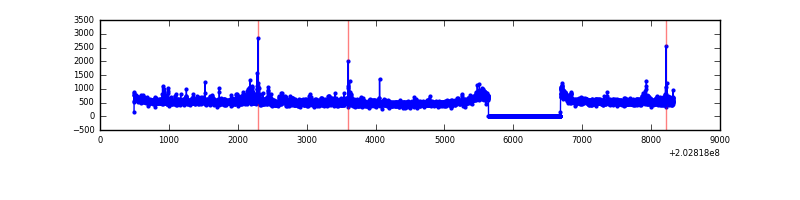 |
| C | 7831 | 6786 | 9 | 9 | 0.11% | 0.13% | 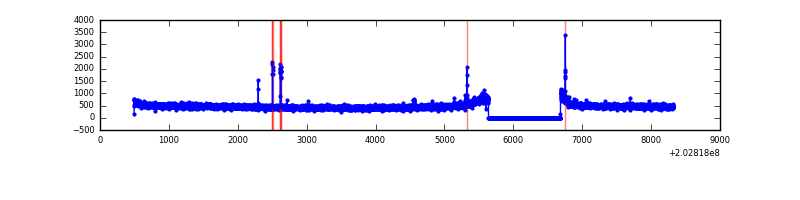 |
| D | 7831 | 6786 | 76 | 76 | 0.97% | 1.12% | 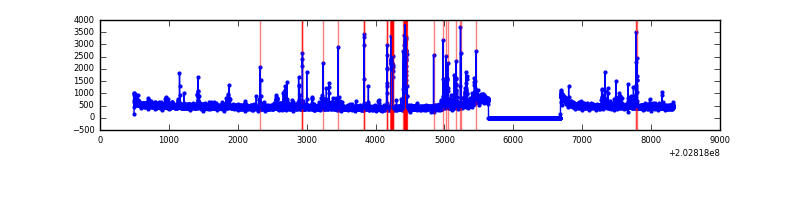 |
Top three noisy pixels from each quadrant. If the there are fewer than three noisy pixels in the level2.evt file, extra rows are filled as -1
| Pixel properties | Quadrant properties | ||||||
|---|---|---|---|---|---|---|---|
| Quadrant | DetID | PixID | Counts | Sigma | Mean | Median | Sigma |
| A | 0 | 118 | 127791 | 736.05 | 841 | 823 | 172.5 |
| A | 15 | 234 | 101238 | 582.12 | 841 | 823 | 172.5 |
| A | 0 | 50 | 95121 | 546.66 | 841 | 823 | 172.5 |
| B | 15 | 204 | 291333 | 1776.11 | 847 | 826 | 163.6 |
| B | 2 | 249 | 30482 | 181.31 | 847 | 826 | 163.6 |
| B | 4 | 81 | 30220 | 179.71 | 847 | 826 | 163.6 |
| C | 2 | 53 | 74755 | 390.95 | 811 | 812 | 189.1 |
| C | 9 | 144 | 14550 | 72.64 | 811 | 812 | 189.1 |
| C | 1 | 16 | 10365 | 50.51 | 811 | 812 | 189.1 |
| D | 13 | 223 | 170706 | 861.27 | 814 | 791 | 197.3 |
| D | 9 | 35 | 88064 | 442.37 | 814 | 791 | 197.3 |
| D | 2 | 37 | 79612 | 399.53 | 814 | 791 | 197.3 |
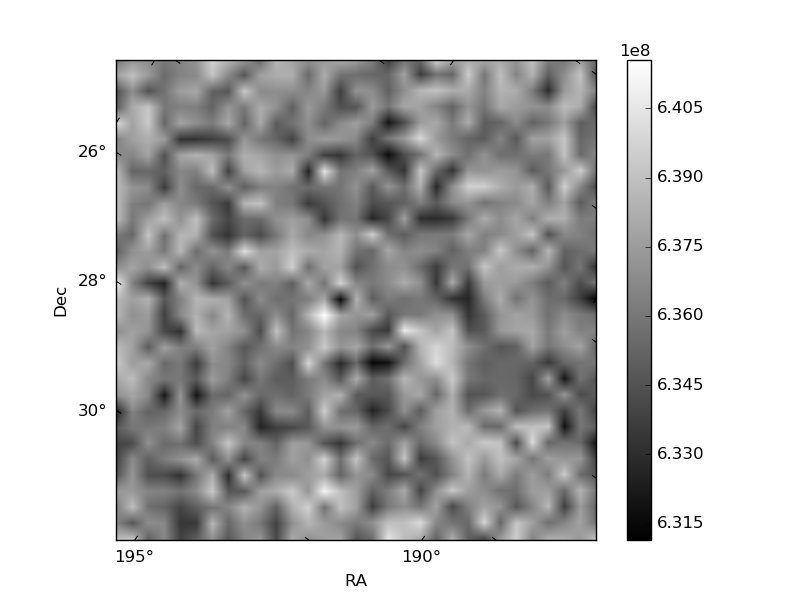
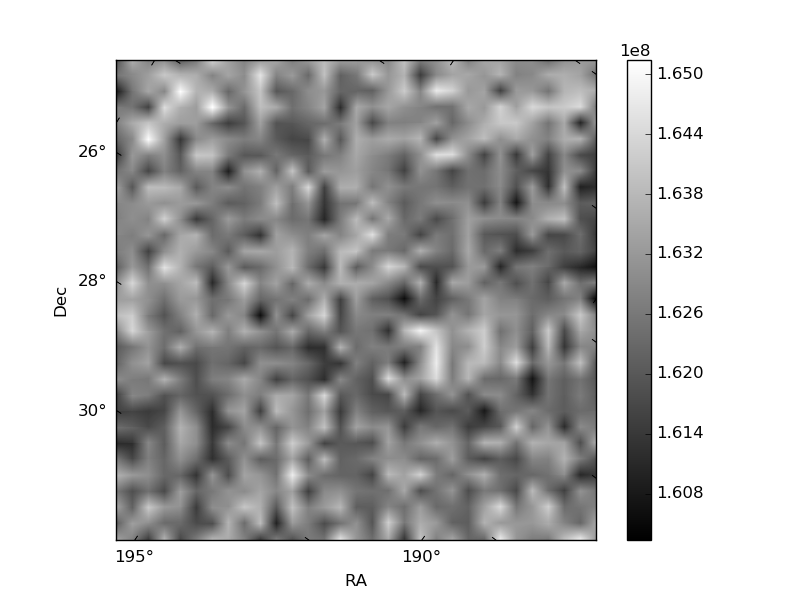
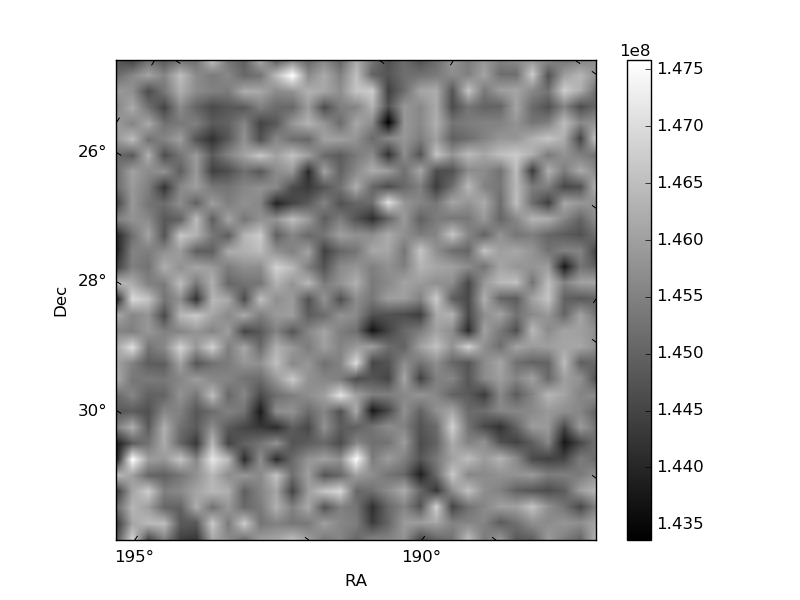
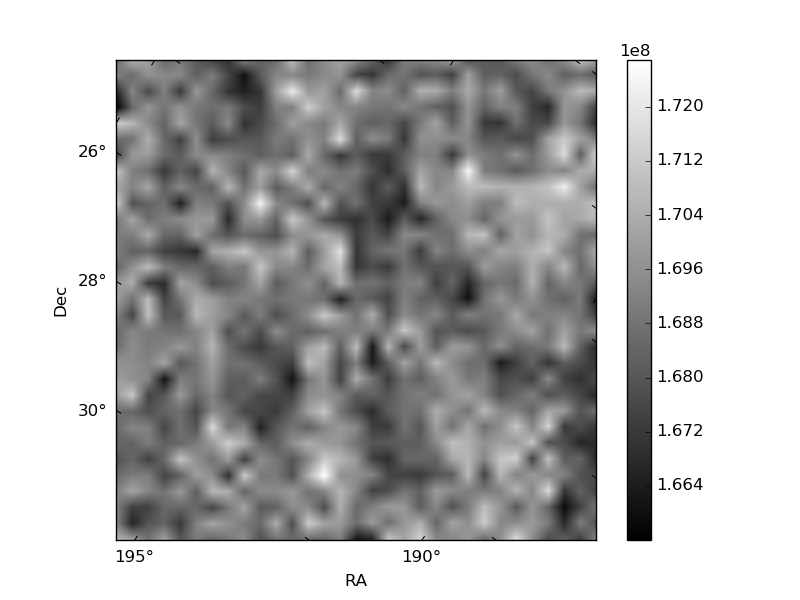
Histogram calculated using DETX and DETY for each event in the final _common_clean file
| Quadrant A | 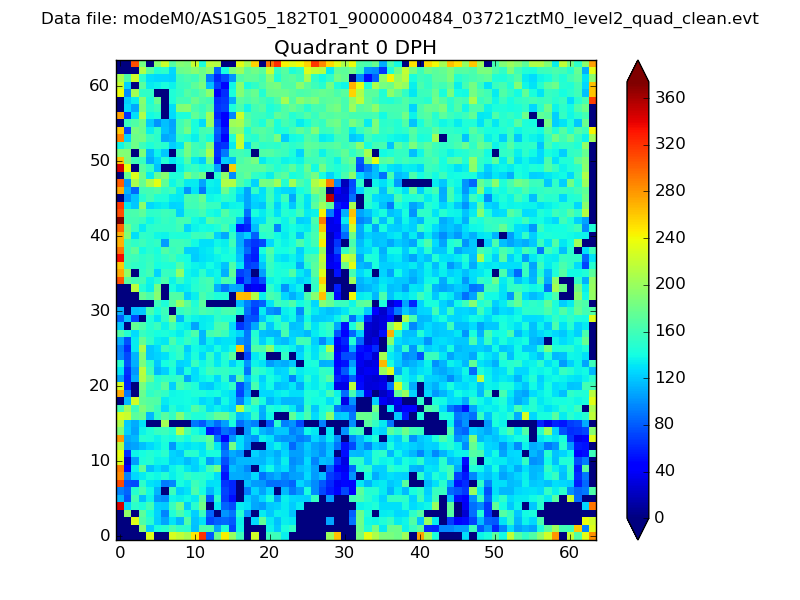 |
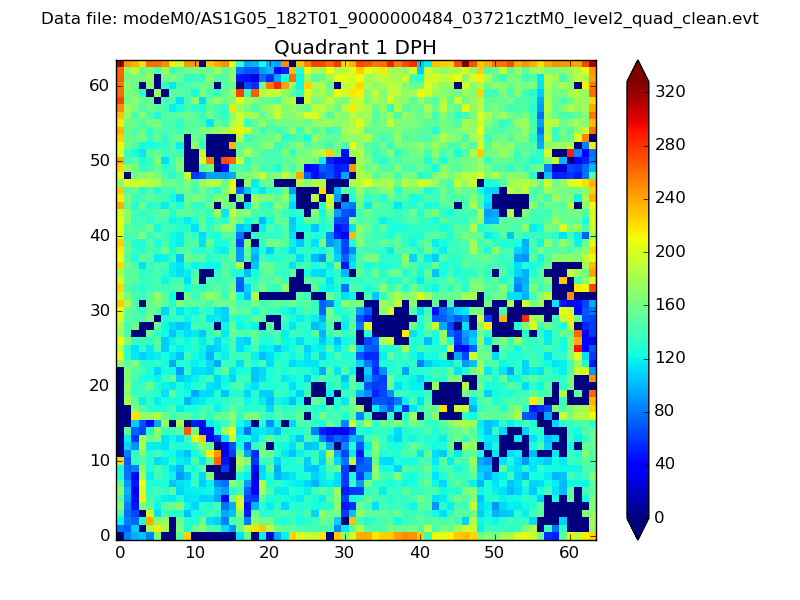 |
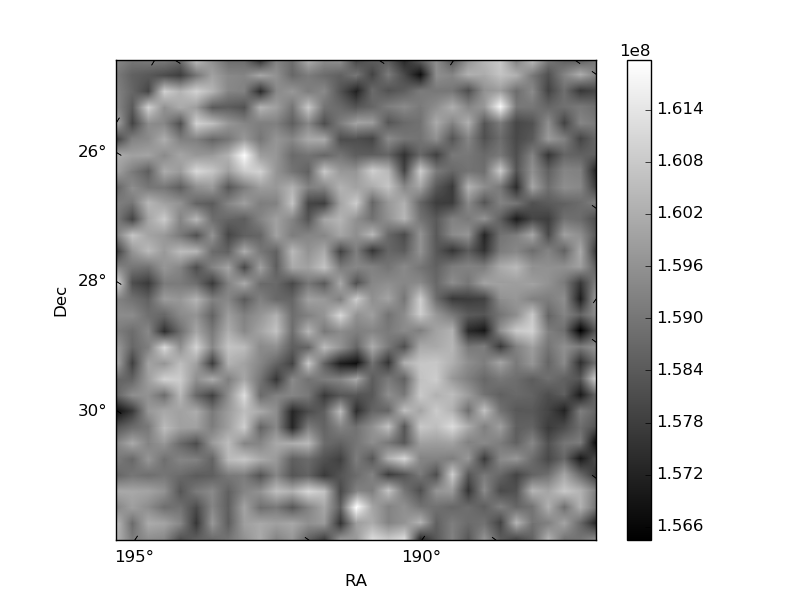
Quadrant B |
|---|---|---|---|
| Quadrant D | 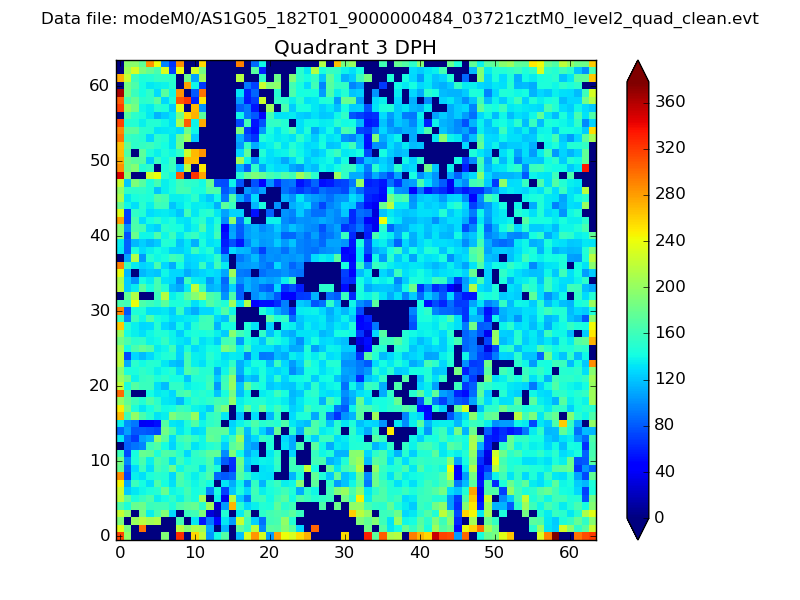 |
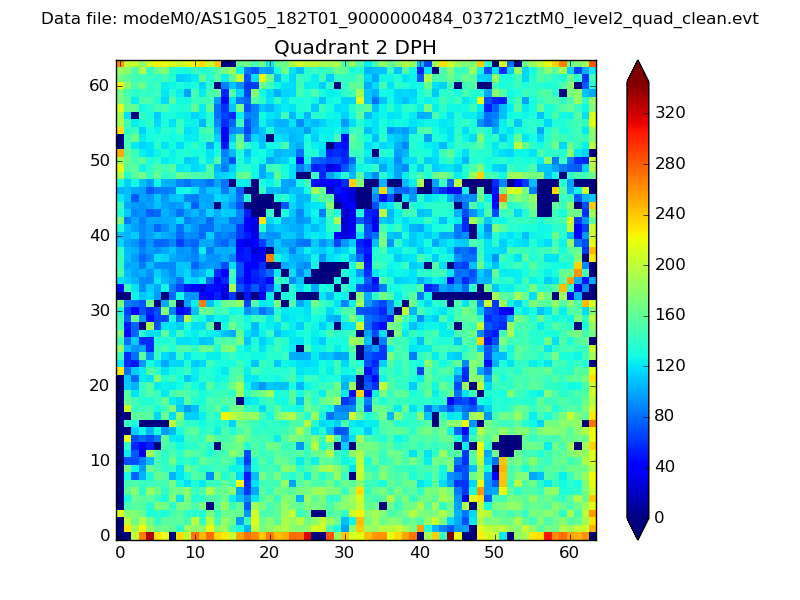 |
Quadrant C |
| Plot type | Count rate plots | Images |
|---|---|---|
| Comparison with Poisson distribution Blue bars denote a histogram of data divided into 1 sec bins. Red curve is a Poisson curve with rate = median count rate of data. |
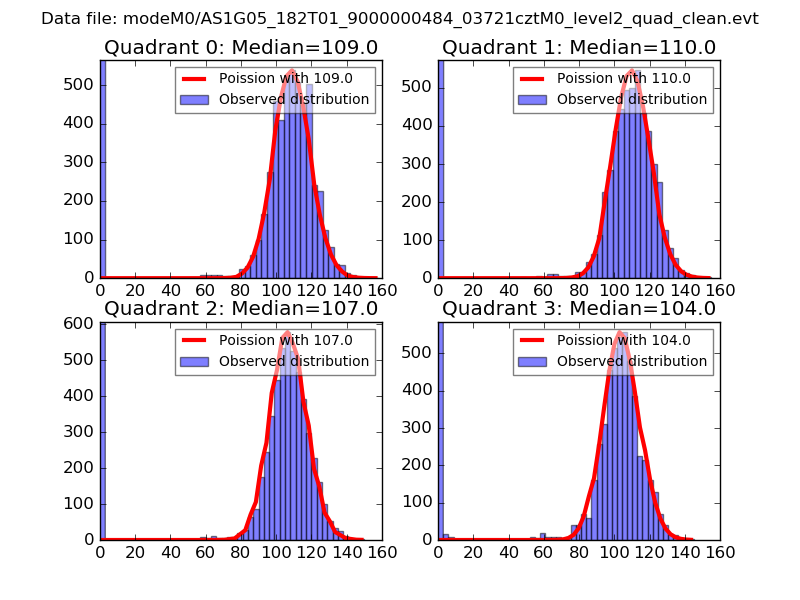 |
 |
| Quadrant-wise count rates Data is divided into 100 sec bins |
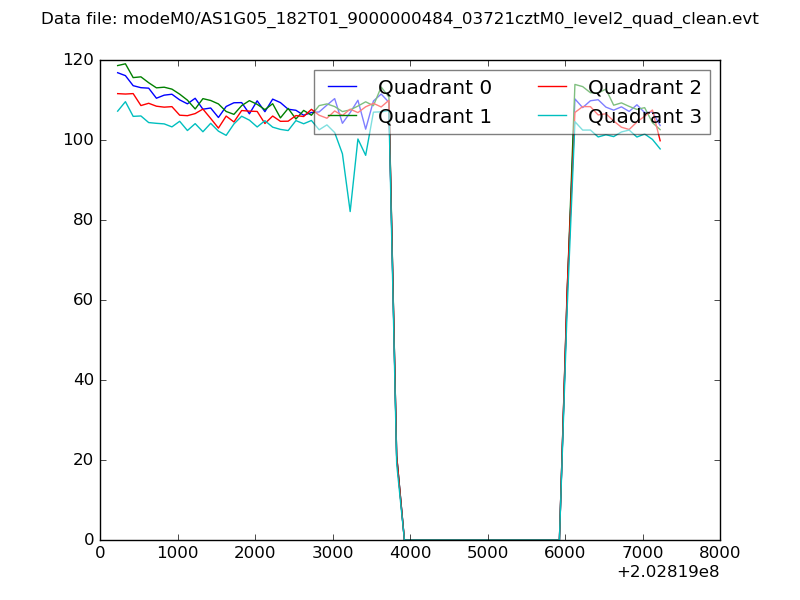 |
|
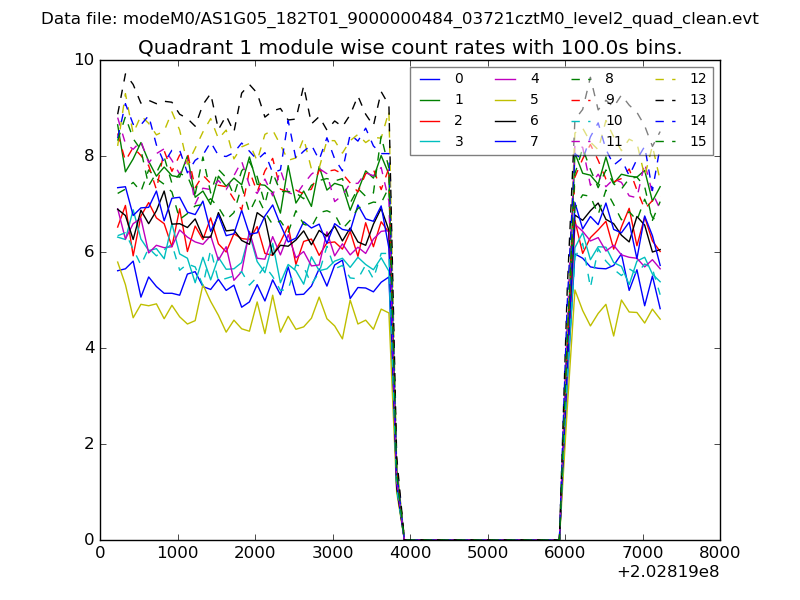
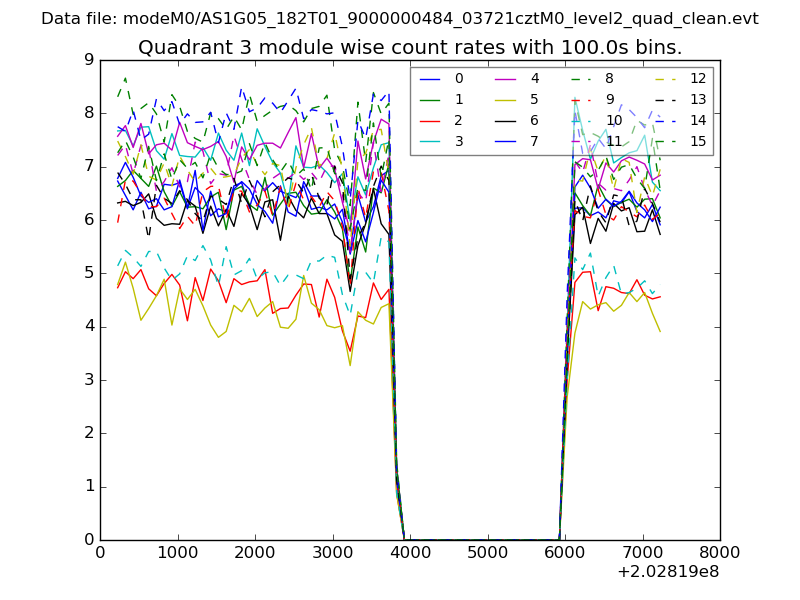
| Module-wise count rates for Quadrant A Data is divided into 100 sec bins |
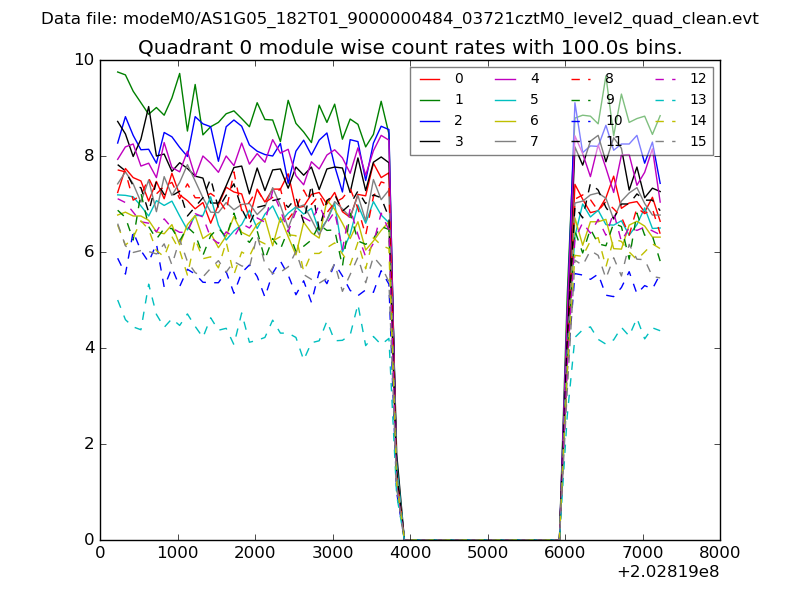 |
 |
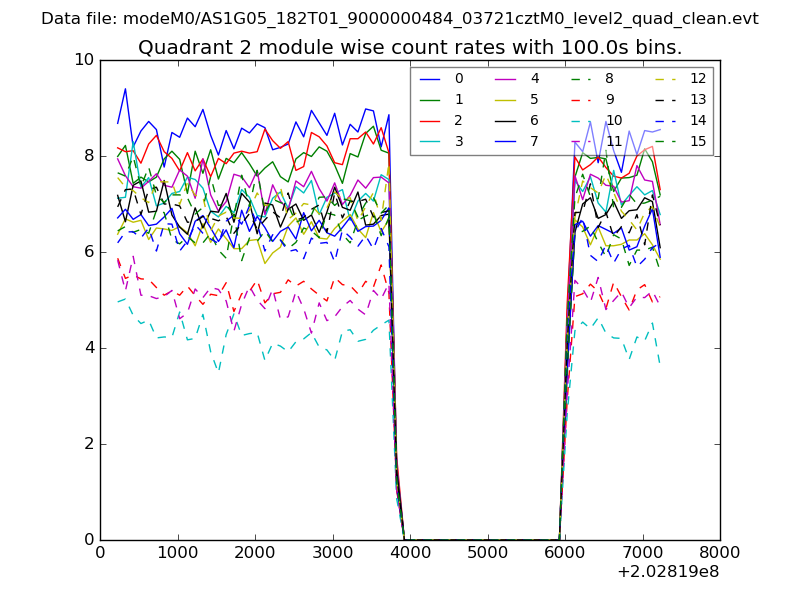
| Module-wise count rates for Quadrant B Data is divided into 100 sec bins |
 |
 |
| Module-wise count rates for Quadrant C Data is divided into 100 sec bins |
 |
 |
| Module-wise count rates for Quadrant D Data is divided into 100 sec bins |
 |
 |
| Parameter | Plot |
|---|---|
| CZT HV Monitor | 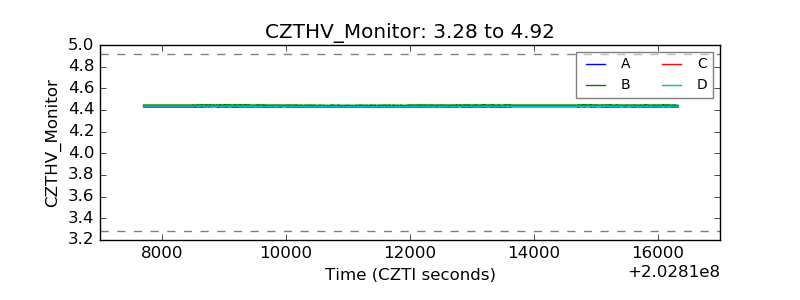 |
| D_VDD | 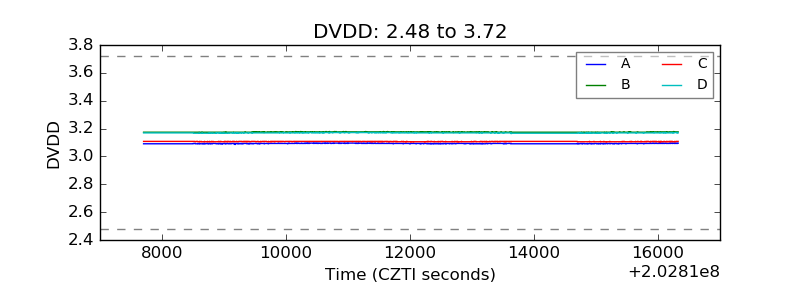 |
| Temperature 1 | 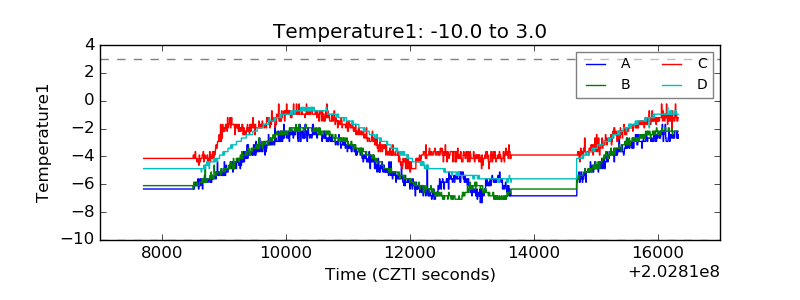 |
| Veto HV Monitor | 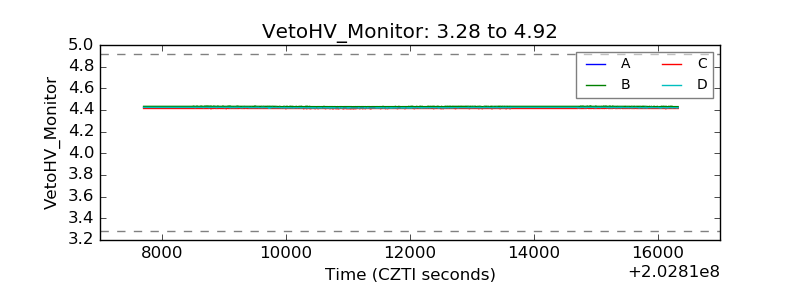 |
| Veto LLD | 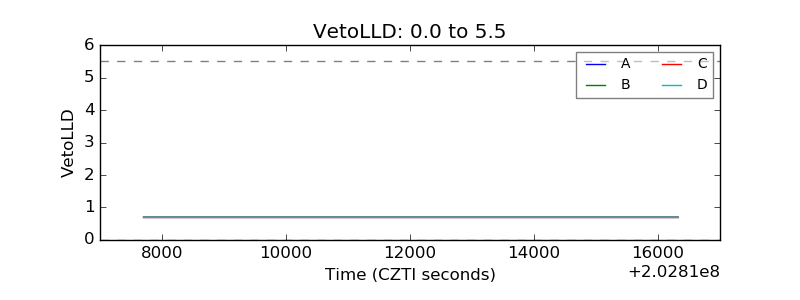 |
| Alpha Counter | 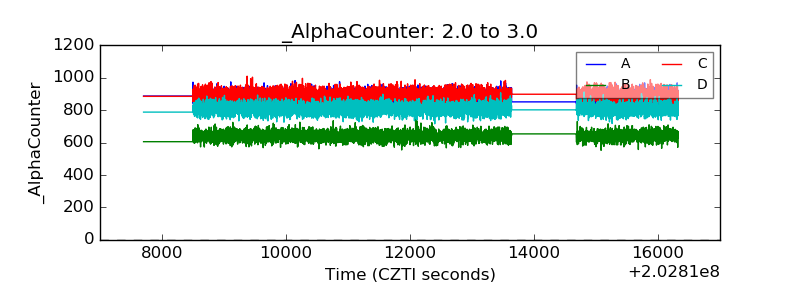 |
| _CPM_Rate | 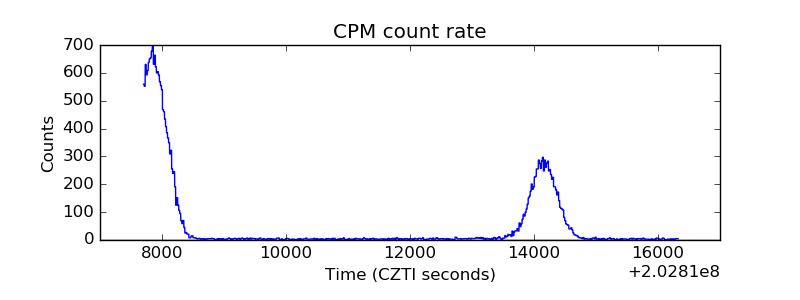 |
| CZT Counter | 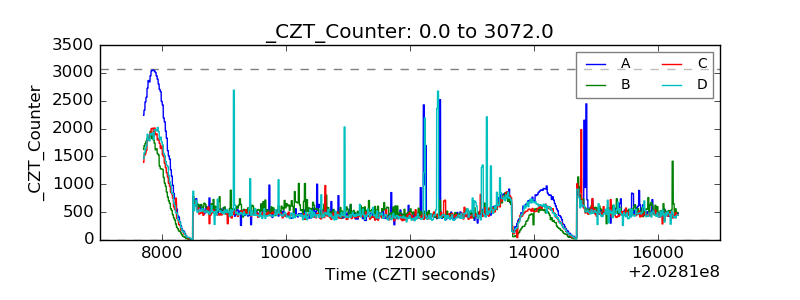 |
| +2.5 Volts monitor | 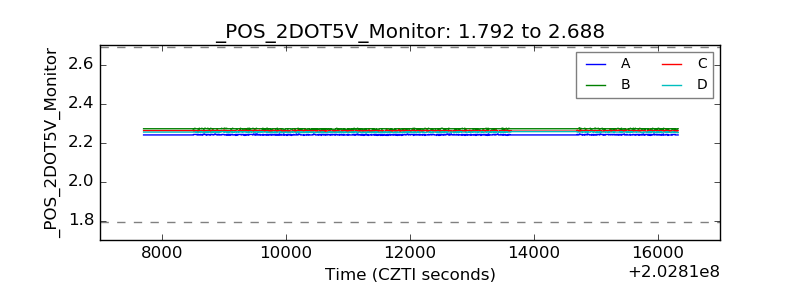 |
| +5 Volts monitor | 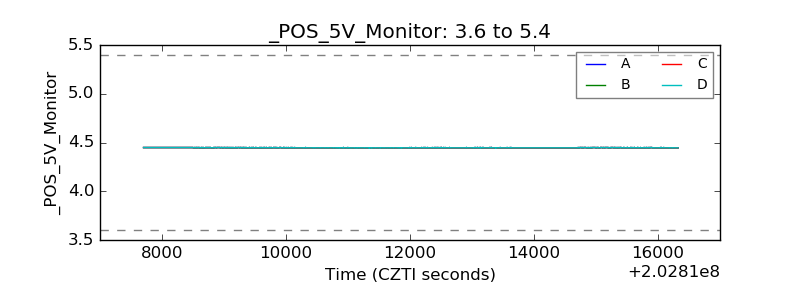 |
| Veto Counter | 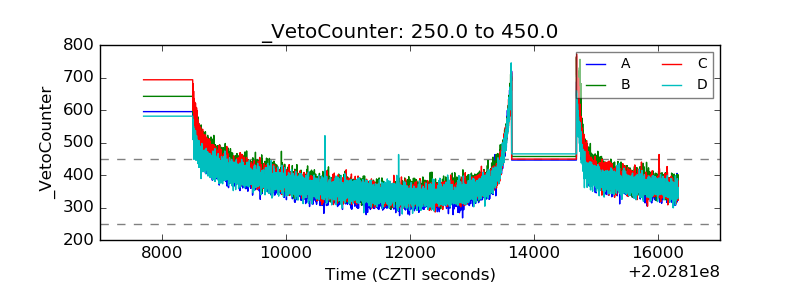 |