| Param | Original file | Final file |
|---|---|---|
| Filename | modeM0/AS1G05_248T01_9000000486cztM0_level2.fits | modeM0/AS1G05_248T01_9000000486cztM0_level2_quad_clean.evt |
| Size (bytes) | 2,902,366,080 | 3,268,437,120 |
| Size | 2.7 GB | 3.0 GB |
| Events in quadrant A | 17,341,190 | 20,072,718 |
| Events in quadrant B | 16,540,546 | 19,745,466 |
| Events in quadrant C | 17,276,612 | 19,374,509 |
| Events in quadrant D | 14,469,076 | 17,545,070 |
| Mode SS | |||
|---|---|---|---|
| Quadrant | BADHDUFLAG | Total packets | Discarded packets |
| A | 0 | 6614 | 0 |
| B | 0 | 6614 | 0 |
| C | 0 | 6614 | 0 |
| D | 0 | 6614 | 0 |
| Mode M9 | |||
|---|---|---|---|
| Quadrant | BADHDUFLAG | Total packets | Discarded packets |
| A | 0 | 458 | 0 |
| B | 0 | 458 | 0 |
| C | 0 | 458 | 0 |
| D | 0 | 458 | 0 |
| Mode M0 | |||
|---|---|---|---|
| Quadrant | BADHDUFLAG | Total packets | Discarded packets |
| A | 0 | 784361 | 0 |
| B | 0 | 816571 | 0 |
| C | 0 | 676917 | 0 |
| D | 0 | 820888 | 0 |
| Quadrant | Total seconds | Saturated seconds | Saturation percentage |
|---|---|---|---|
| A | 324988 | 11991 | 3.689675% |
| B | 324988 | 12017 | 3.697675% |
| C | 324987 | 2911 | 0.895728% |
| D | 324988 | 13585 | 4.180154% |
Noise dominated data is calculated using 1-second bins in cleaned event files. If a bin has >2000 counts, and if more than 50% of those come from <1% of pixels, then it is considered to be noise-dominated and hence unusable.
| Quadrant | # 1 sec bins | Bins with >0 counts | Bins with >2000 counts | High rate bins dominated by noise | Noise dominated (total time) | Noise dominated (detector-on time) | Marked lightcurve |
|---|---|---|---|---|---|---|---|
| A | 370840 | 324693 | 0 | 0 | 0.00% | 0.00% | 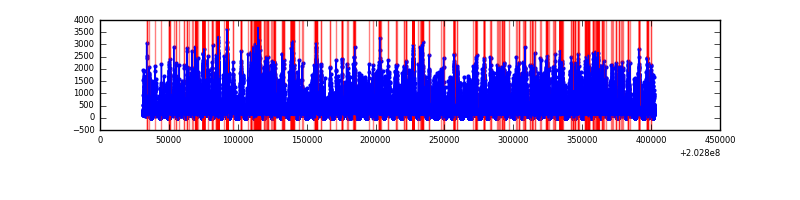 |
| B | 370840 | 324849 | 0 | 0 | 0.00% | 0.00% |  |
| C | 370840 | 324968 | 0 | 0 | 0.00% | 0.00% | 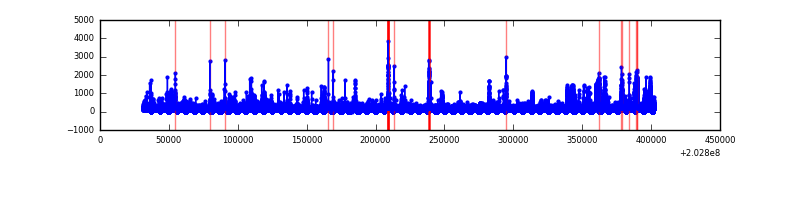 |
| D | 370840 | 324687 | 0 | 0 | 0.00% | 0.00% | 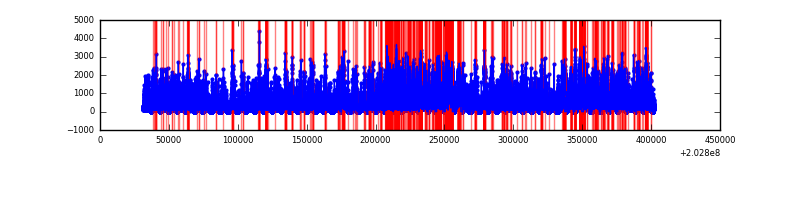 |
Top three noisy pixels from each quadrant. If the there are fewer than three noisy pixels in the level2.evt file, extra rows are filled as -1
| Pixel properties | Quadrant properties | ||||||
|---|---|---|---|---|---|---|---|
| Quadrant | DetID | PixID | Counts | Sigma | Mean | Median | Sigma |
| A | 14 | 188 | 17412 | 11.43 | 4512 | 4190 | 1157.1 |
| A | 0 | 29 | 17009 | 11.08 | 4512 | 4190 | 1157.1 |
| A | 14 | 204 | 14848 | 9.21 | 4512 | 4190 | 1157.1 |
| B | 2 | 9 | 14521 | 11.94 | 4388 | 4168 | 866.8 |
| B | 12 | 226 | 12558 | 9.68 | 4388 | 4168 | 866.8 |
| B | 14 | 254 | 11706 | 8.7 | 4388 | 4168 | 866.8 |
| C | 1 | 80 | 12410 | 6.79 | 4558 | 4197 | 1209.5 |
| C | 1 | 81 | 12009 | 6.46 | 4558 | 4197 | 1209.5 |
| C | 12 | 241 | 11948 | 6.41 | 4558 | 4197 | 1209.5 |
| D | 7 | 5 | 10570 | 6.2 | 4156 | 3766 | 1098.2 |
| D | 7 | 3 | 10418 | 6.06 | 4156 | 3766 | 1098.2 |
| D | 6 | 231 | 10380 | 6.02 | 4156 | 3766 | 1098.2 |
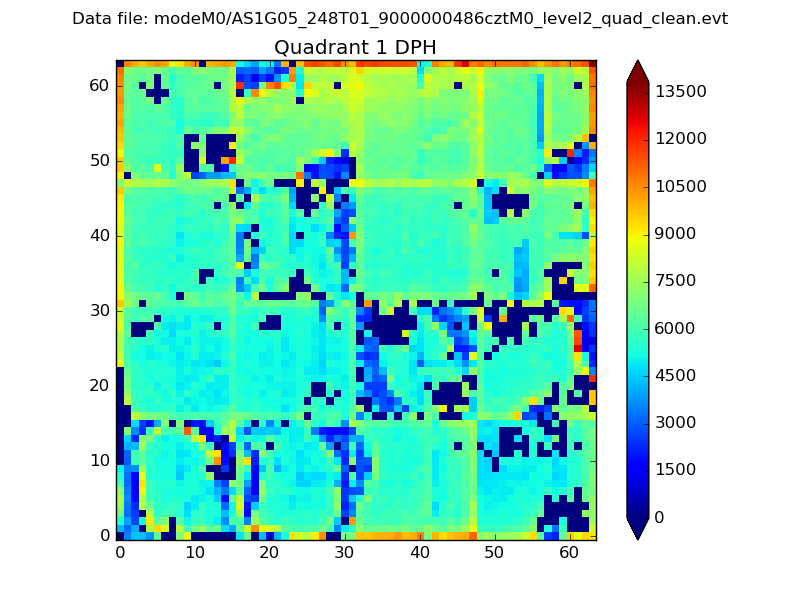
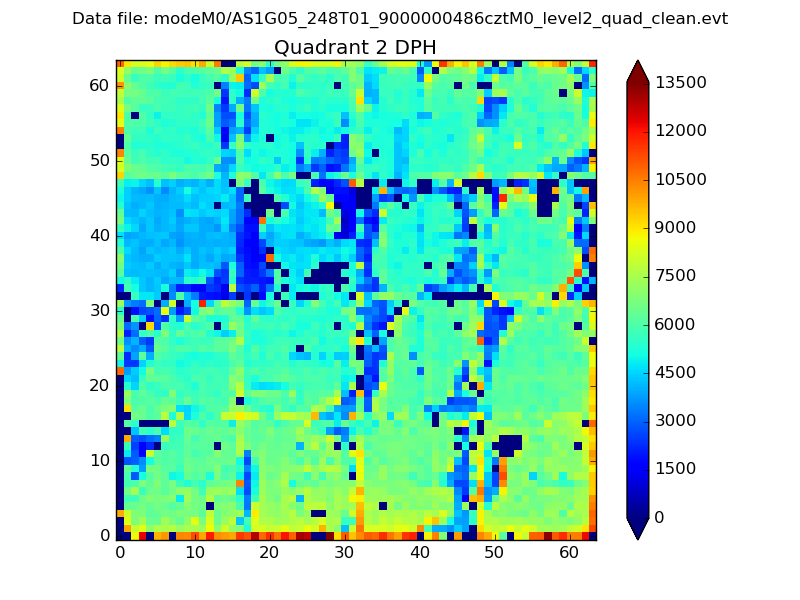
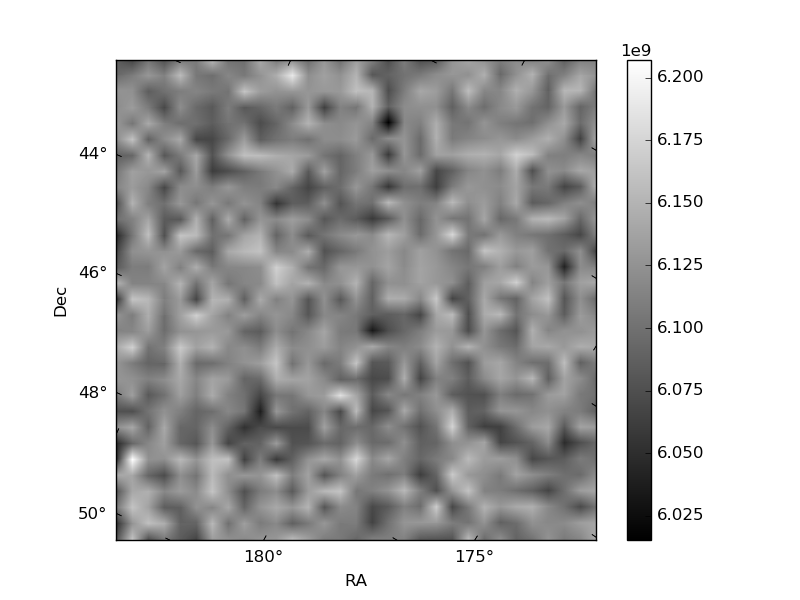
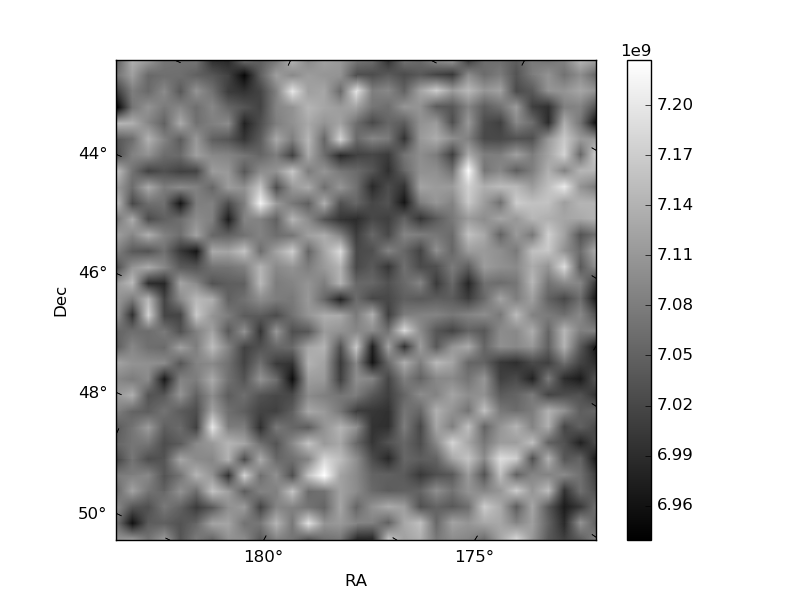
Histogram calculated using DETX and DETY for each event in the final _common_clean file
| Quadrant A | 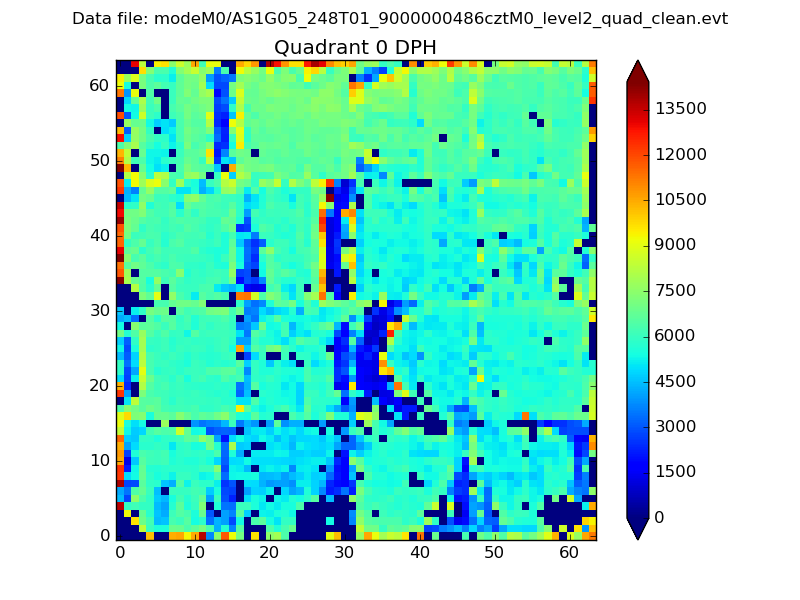 |
 |
Quadrant B |
|---|---|---|---|
| Quadrant D | 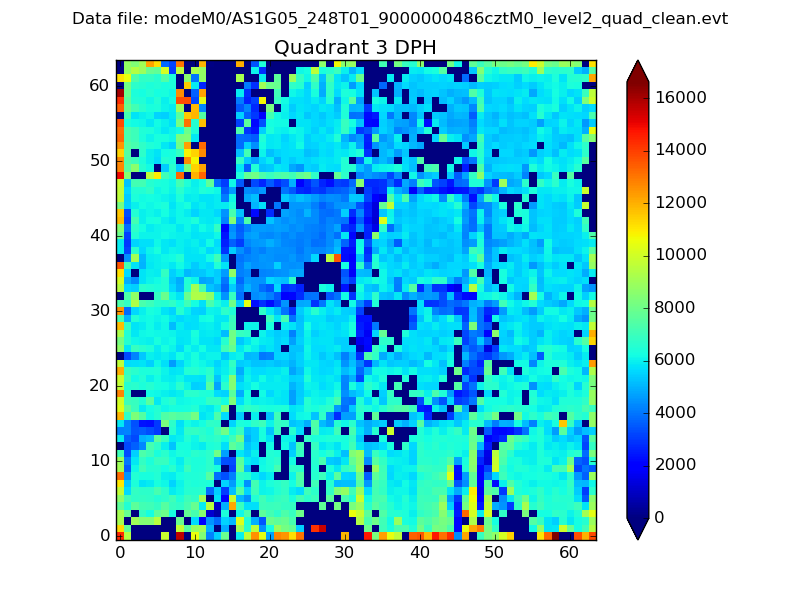 |
 |
Quadrant C |
| Plot type | Count rate plots | Images |
|---|---|---|
| Comparison with Poisson distribution Blue bars denote a histogram of data divided into 1 sec bins. Red curve is a Poisson curve with rate = median count rate of data. |
 |
 |
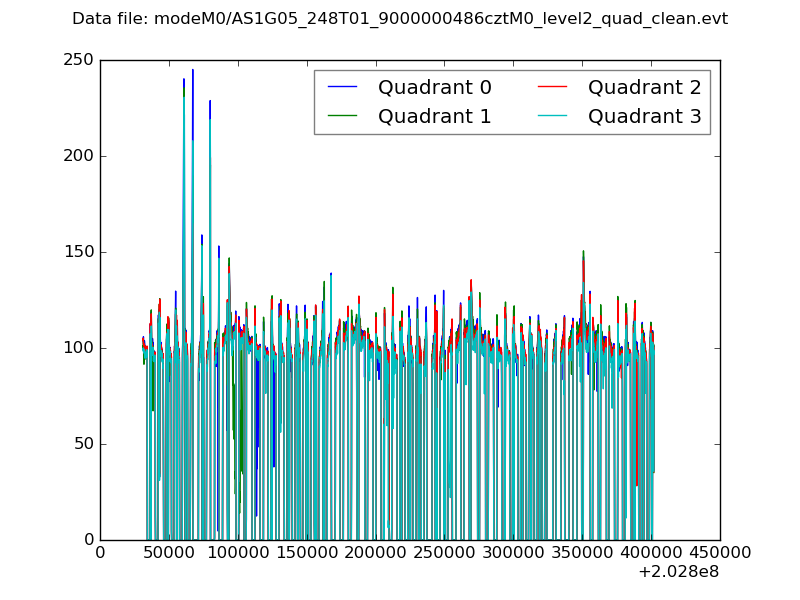
| Quadrant-wise count rates Data is divided into 100 sec bins |
 |
|
| Module-wise count rates for Quadrant A Data is divided into 100 sec bins |
 |
 |
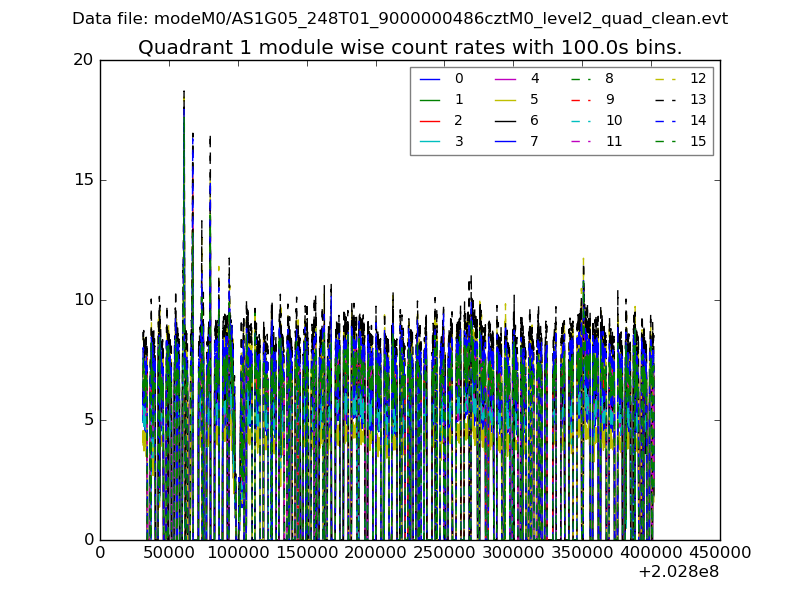
| Module-wise count rates for Quadrant B Data is divided into 100 sec bins |
 |
 |
| Module-wise count rates for Quadrant C Data is divided into 100 sec bins |
 |
 |
| Module-wise count rates for Quadrant D Data is divided into 100 sec bins |
 |
 |
| Parameter | Plot |
|---|---|
| CZT HV Monitor | 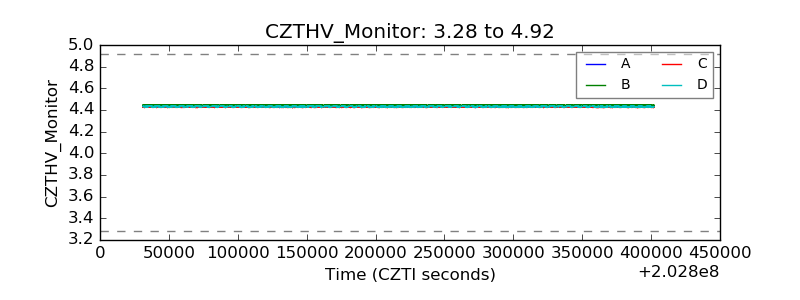 |
| D_VDD | 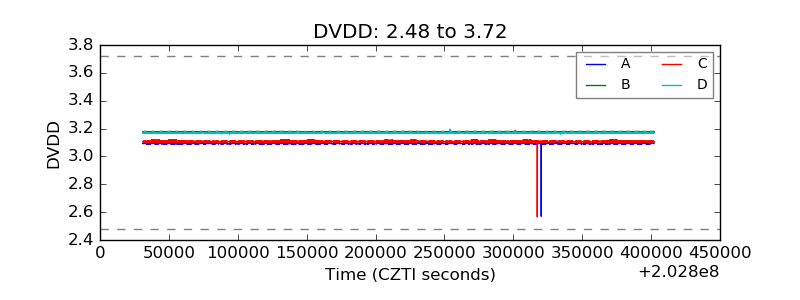 |
| Temperature 1 | 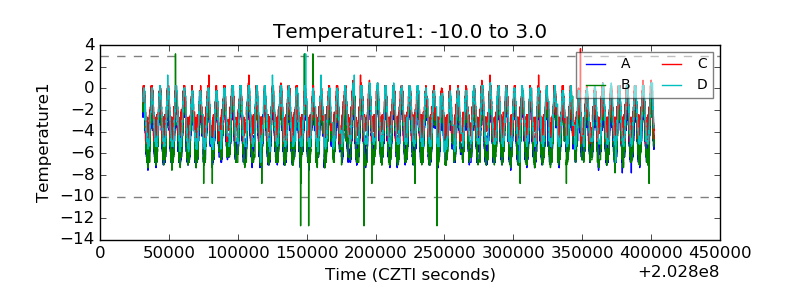 |
| Veto HV Monitor |  |
| Veto LLD | 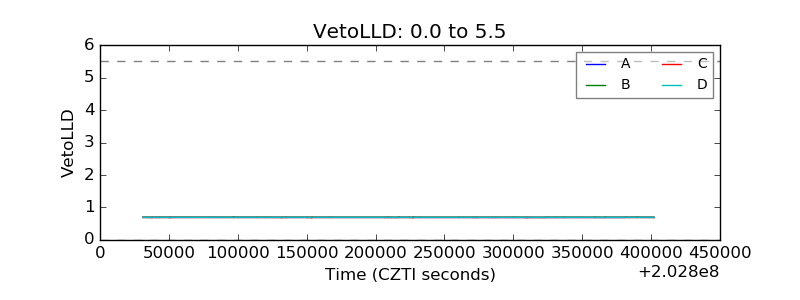 |
| Alpha Counter |  |
| _CPM_Rate | 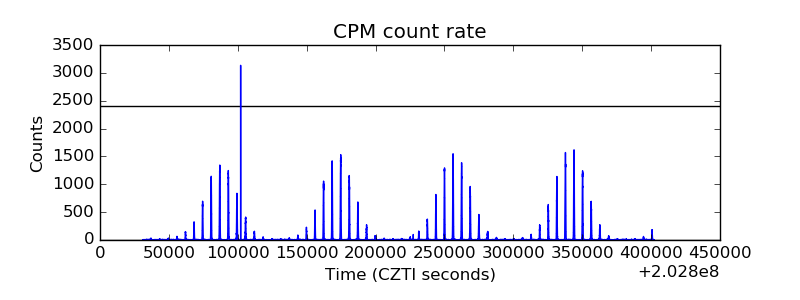 |
| CZT Counter | 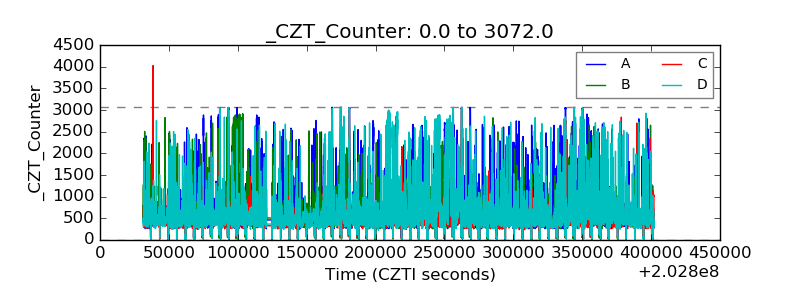 |
| +2.5 Volts monitor | 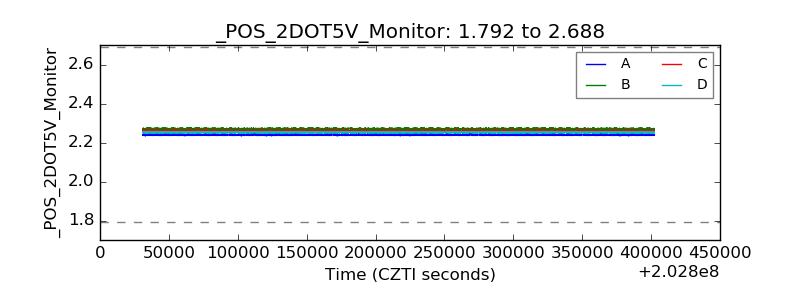 |
| +5 Volts monitor | 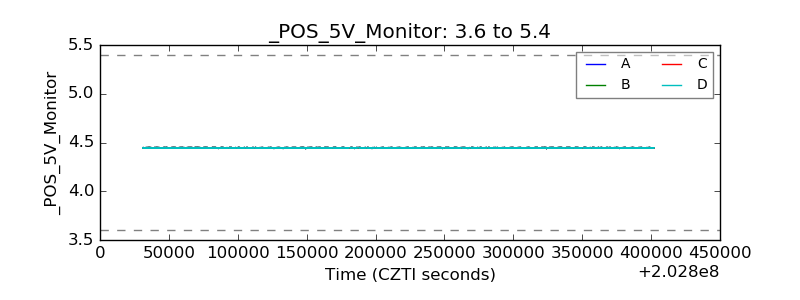 |
| _ROLL_ROT | 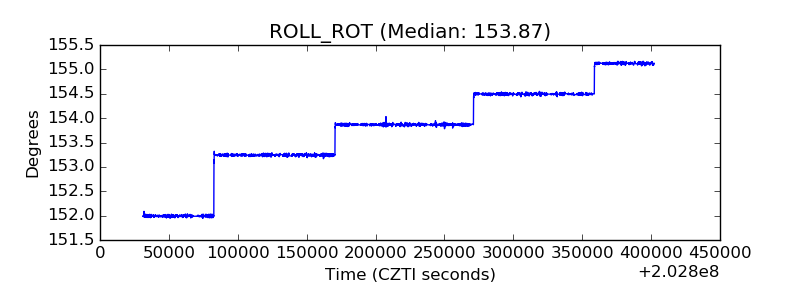 |
| _Roll_DEC |  |
| _Roll_RA | 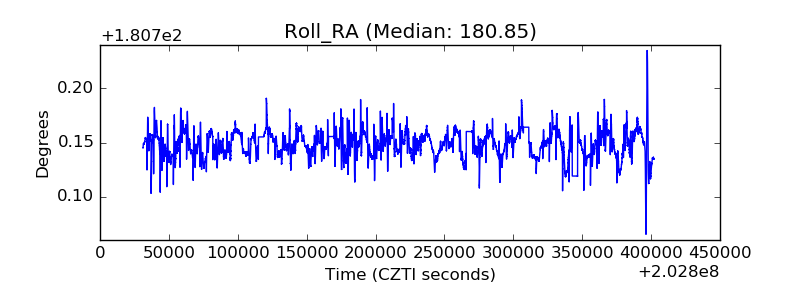 |
| Veto Counter | 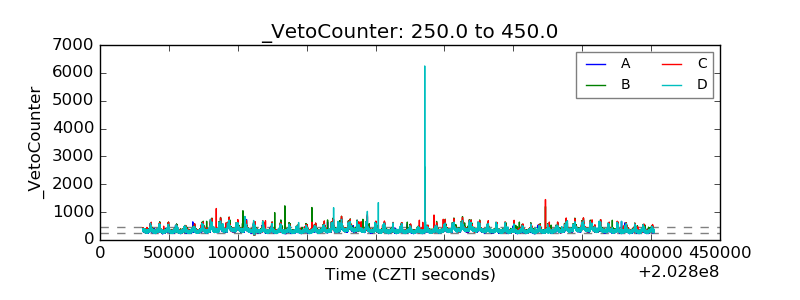 |