| Param | Original file | Final file |
|---|---|---|
| Filename | modeM0/AS1G05_248T01_9000000486_03723cztM0_level2.evt | modeM0/AS1G05_248T01_9000000486_03723cztM0_level2_quad_clean.evt |
| Size (bytes) | 526,590,720 | 81,011,520 |
| Size | 502.2 MB | 77.3 MB |
| Events in quadrant A | 3,670,444 | 501,722 |
| Events in quadrant B | 5,172,204 | 489,065 |
| Events in quadrant C | 3,171,701 | 495,512 |
| Events in quadrant D | 3,461,378 | 482,030 |
| Mode SS | |||
|---|---|---|---|
| Quadrant | BADHDUFLAG | Total packets | Discarded packets |
| A | 0 | 140 | 0 |
| B | 0 | 140 | 0 |
| C | 0 | 140 | 0 |
| D | 0 | 140 | 0 |
| Mode M9 | |||
|---|---|---|---|
| Quadrant | BADHDUFLAG | Total packets | Discarded packets |
| A | 0 | 5 | 0 |
| B | 0 | 5 | 0 |
| C | 0 | 5 | 0 |
| D | 0 | 5 | 0 |
| Mode M0 | |||
|---|---|---|---|
| Quadrant | BADHDUFLAG | Total packets | Discarded packets |
| A | 0 | 15770 | 2 |
| B | 0 | 20049 | 1 |
| C | 0 | 14335 | 1 |
| D | 0 | 15342 | 1 |
| Quadrant | Total seconds | Saturated seconds | Saturation percentage |
|---|---|---|---|
| A | 6961 | 178 | 2.557104% |
| B | 6961 | 361 | 5.186036% |
| C | 6961 | 31 | 0.445338% |
| D | 6961 | 73 | 1.048700% |
Noise dominated data is calculated using 1-second bins in cleaned event files. If a bin has >2000 counts, and if more than 50% of those come from <1% of pixels, then it is considered to be noise-dominated and hence unusable.
| Quadrant | # 1 sec bins | Bins with >0 counts | Bins with >2000 counts | High rate bins dominated by noise | Noise dominated (total time) | Noise dominated (detector-on time) | Marked lightcurve |
|---|---|---|---|---|---|---|---|
| A | 7471 | 6962 | 69 | 69 | 0.92% | 0.99% | 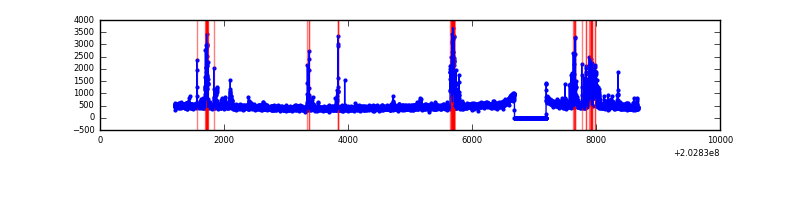 |
| B | 7471 | 6962 | 184 | 184 | 2.46% | 2.64% | 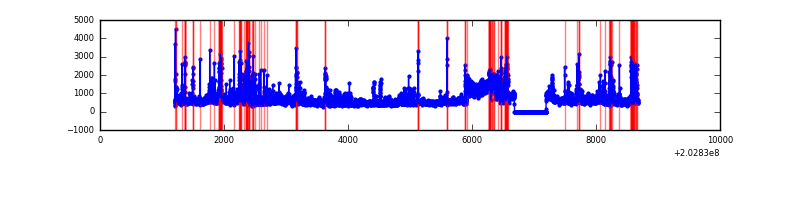 |
| C | 7471 | 6962 | 1 | 1 | 0.01% | 0.01% | 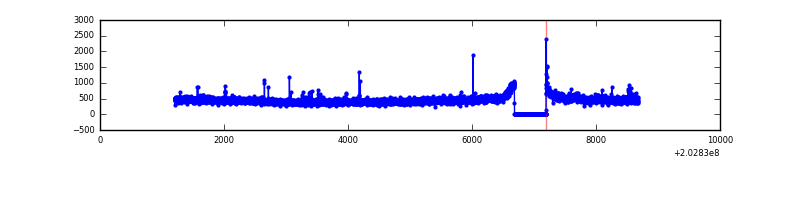 |
| D | 7471 | 6962 | 48 | 48 | 0.64% | 0.69% | 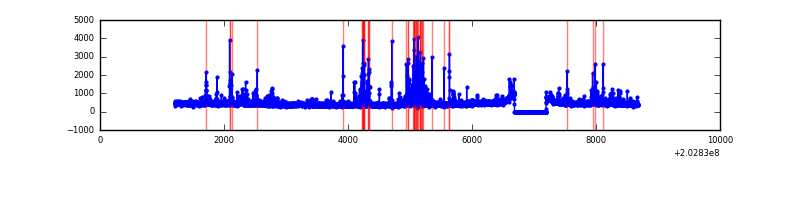 |
Top three noisy pixels from each quadrant. If the there are fewer than three noisy pixels in the level2.evt file, extra rows are filled as -1
| Pixel properties | Quadrant properties | ||||||
|---|---|---|---|---|---|---|---|
| Quadrant | DetID | PixID | Counts | Sigma | Mean | Median | Sigma |
| A | 0 | 118 | 341937 | 2063.2 | 802 | 783 | 165.4 |
| A | 0 | 50 | 150150 | 903.33 | 802 | 783 | 165.4 |
| A | 0 | 226 | 39062 | 231.5 | 802 | 783 | 165.4 |
| B | 5 | 172 | 671956 | 4347.83 | 798 | 777 | 154.4 |
| B | 2 | 249 | 547369 | 3540.77 | 798 | 777 | 154.4 |
| B | 15 | 204 | 511142 | 3306.1 | 798 | 777 | 154.4 |
| C | 2 | 53 | 47139 | 252.88 | 783 | 788 | 183.3 |
| C | 10 | 34 | 20910 | 109.78 | 783 | 788 | 183.3 |
| C | 1 | 16 | 18621 | 97.29 | 783 | 788 | 183.3 |
| D | 13 | 239 | 149115 | 771.13 | 784 | 760 | 192.4 |
| D | 13 | 223 | 98218 | 506.57 | 784 | 760 | 192.4 |
| D | 2 | 37 | 90599 | 466.97 | 784 | 760 | 192.4 |
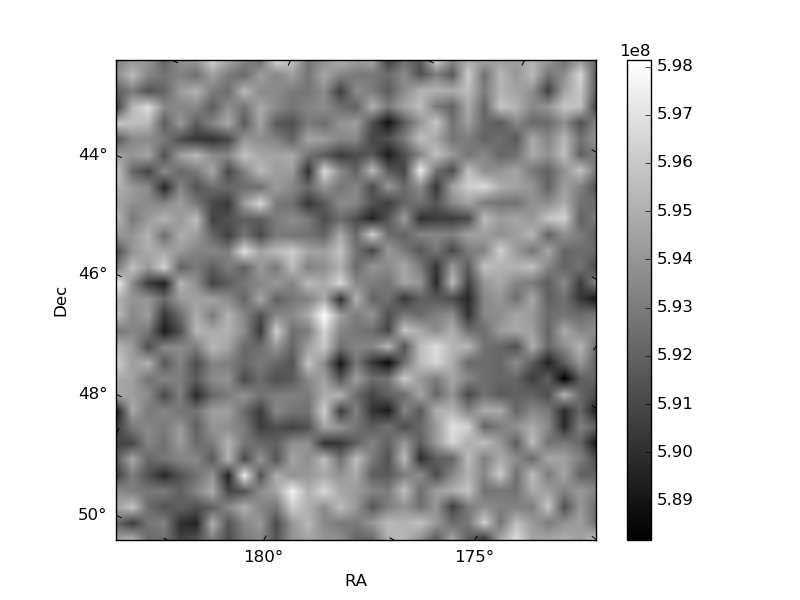
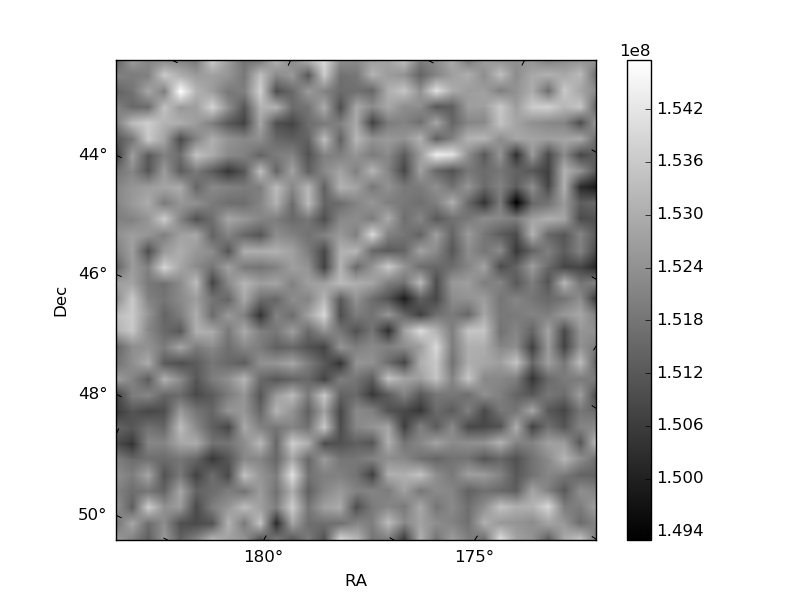
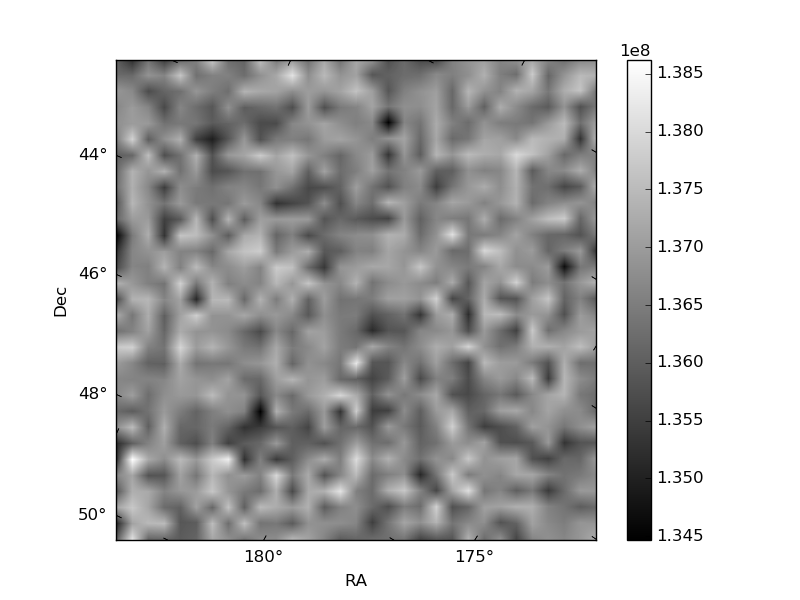
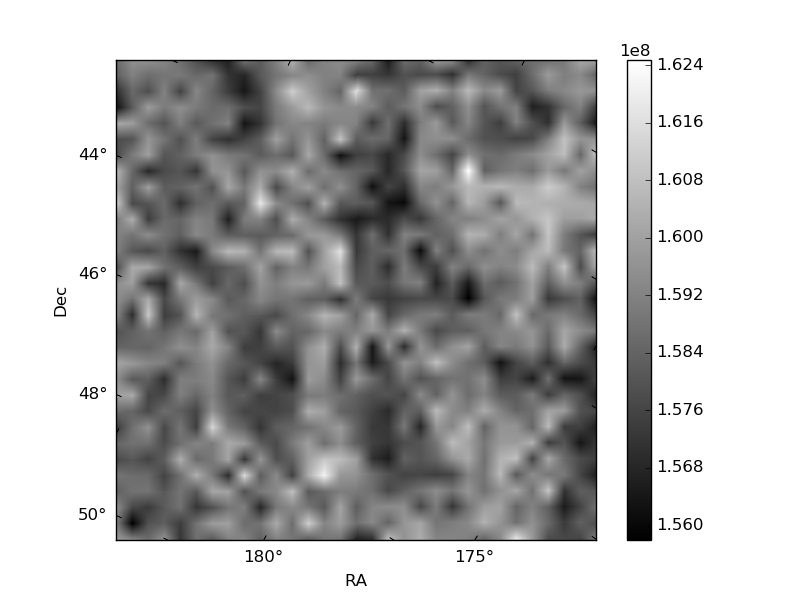
Histogram calculated using DETX and DETY for each event in the final _common_clean file
| Quadrant A | 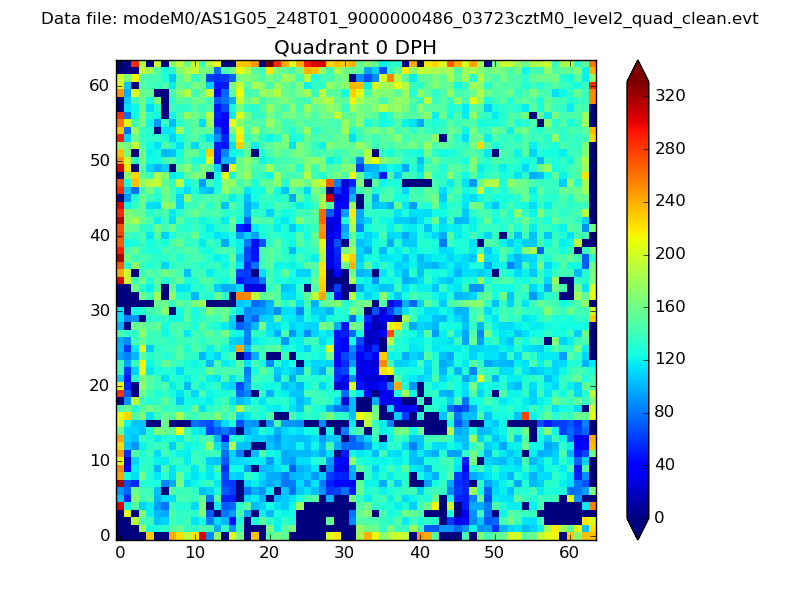 |
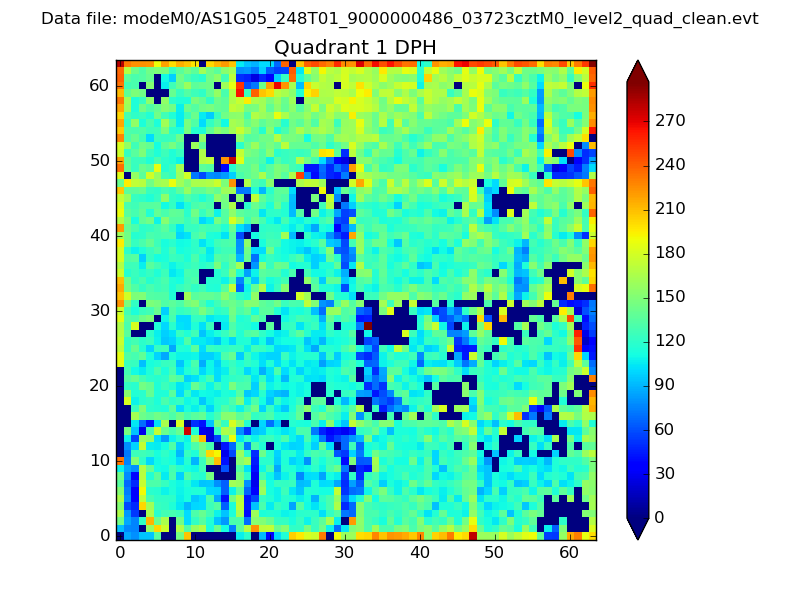 |
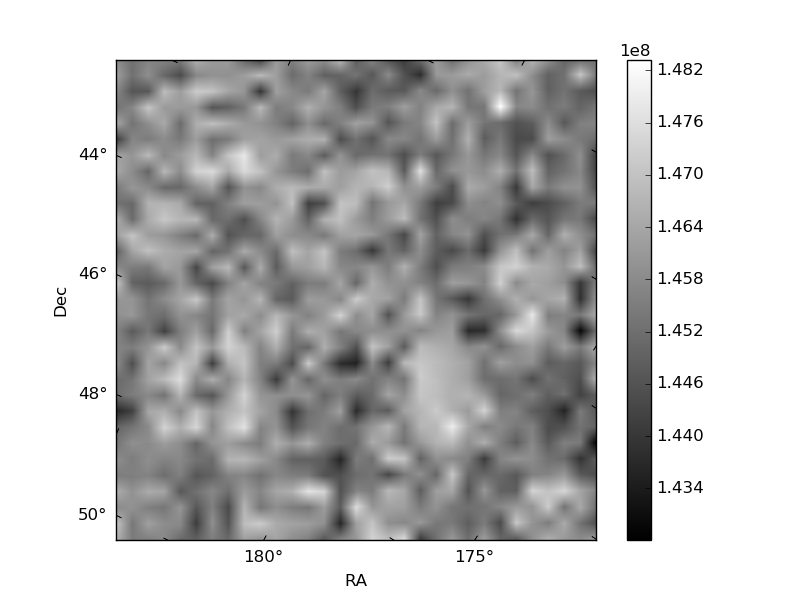
Quadrant B |
|---|---|---|---|
| Quadrant D | 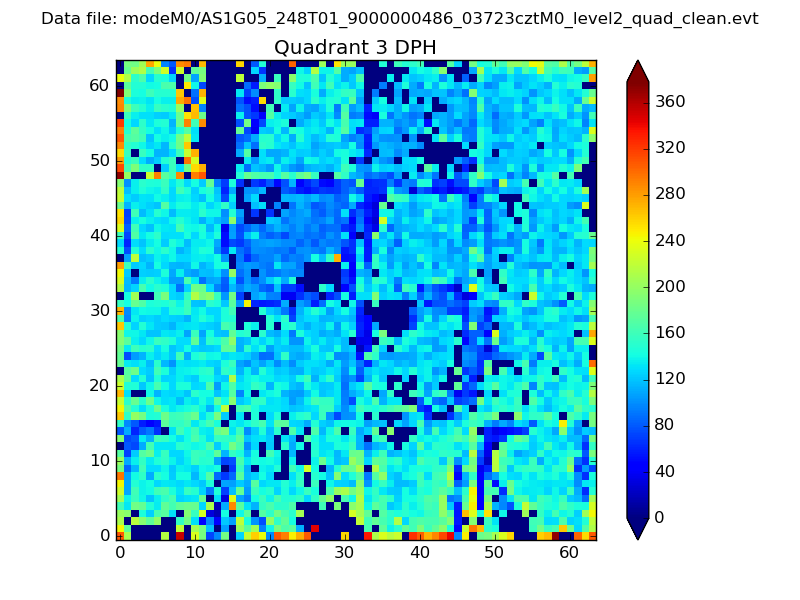 |
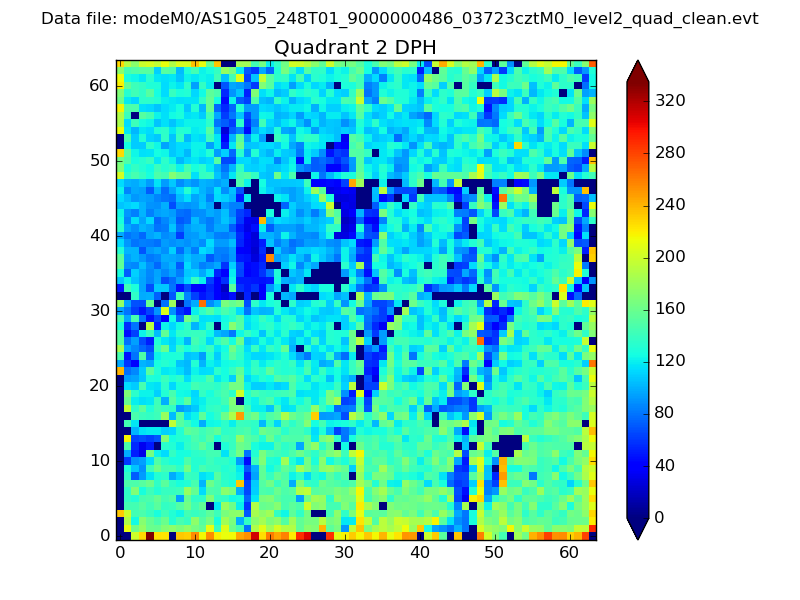 |
Quadrant C |
| Plot type | Count rate plots | Images |
|---|---|---|
| Comparison with Poisson distribution Blue bars denote a histogram of data divided into 1 sec bins. Red curve is a Poisson curve with rate = median count rate of data. |
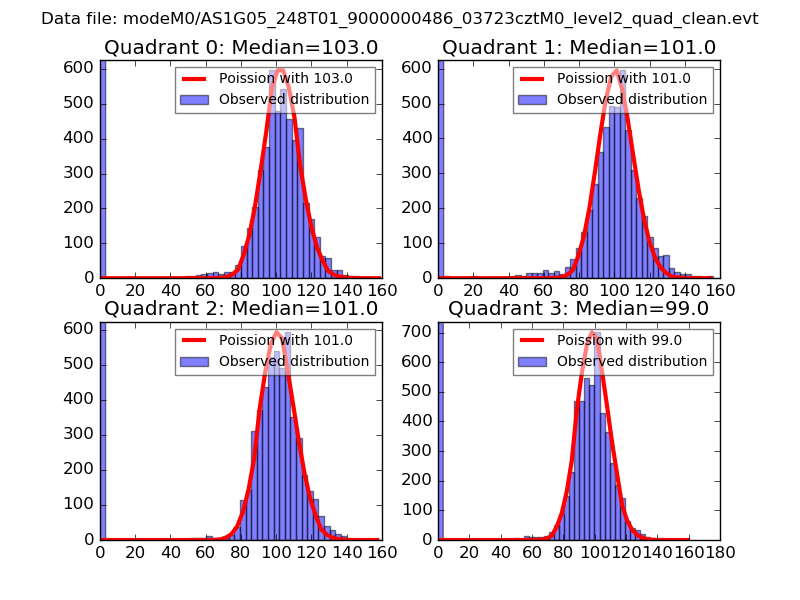 |
 |
| Quadrant-wise count rates Data is divided into 100 sec bins |
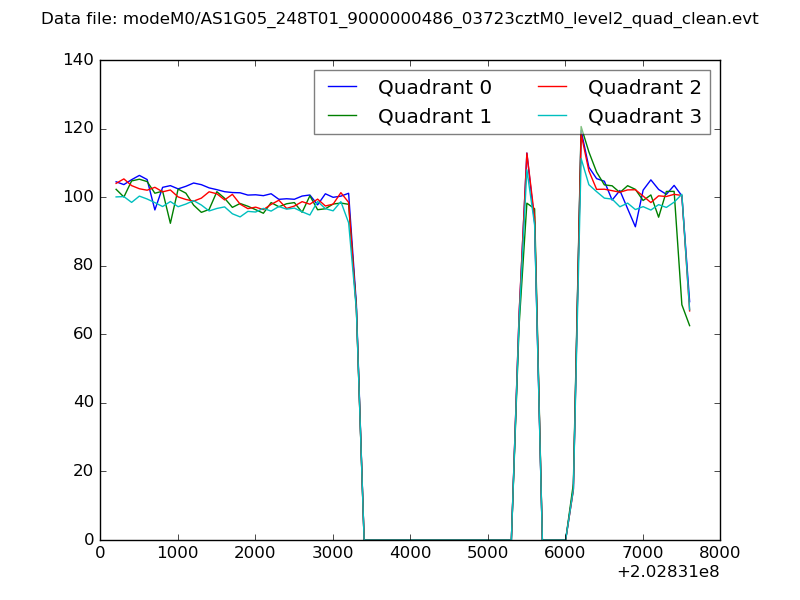 |
|
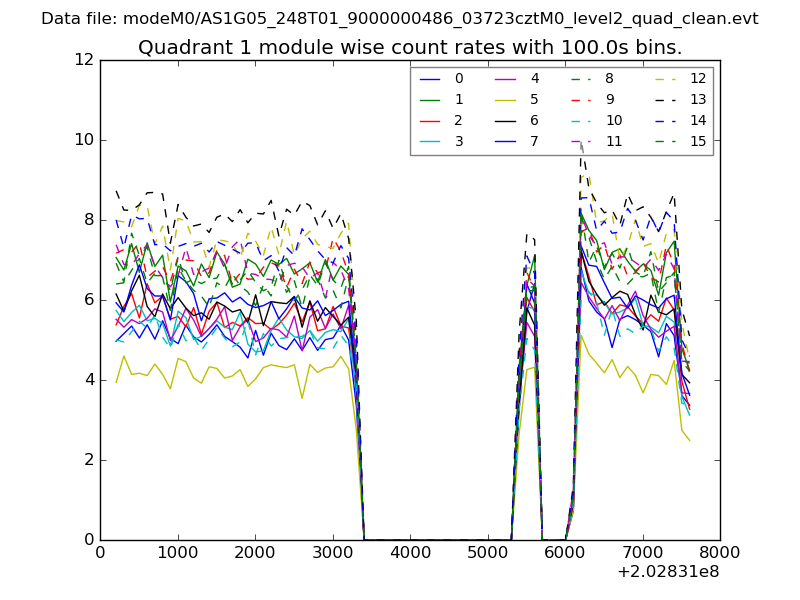
| Module-wise count rates for Quadrant A Data is divided into 100 sec bins |
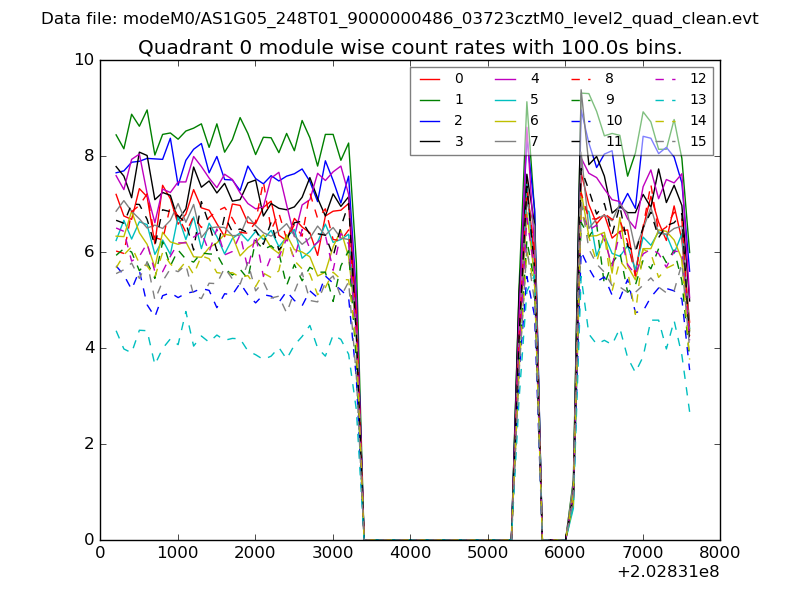 |
 |
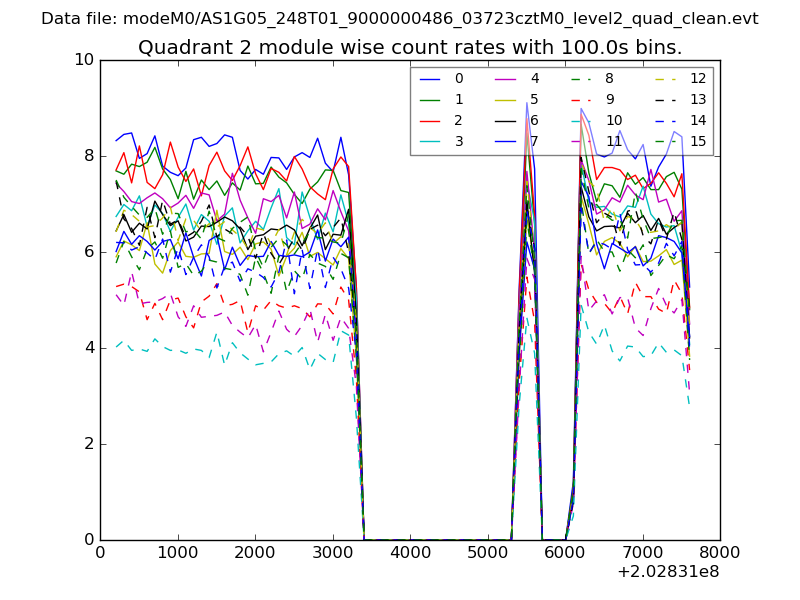
| Module-wise count rates for Quadrant B Data is divided into 100 sec bins |
 |
 |
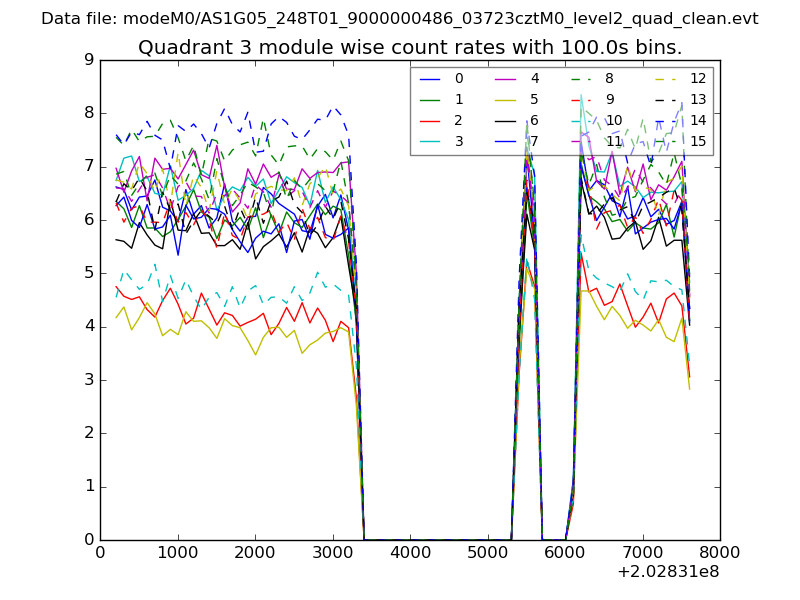
| Module-wise count rates for Quadrant C Data is divided into 100 sec bins |
 |
 |
| Module-wise count rates for Quadrant D Data is divided into 100 sec bins |
 |
 |
| Parameter | Plot |
|---|---|
| CZT HV Monitor | 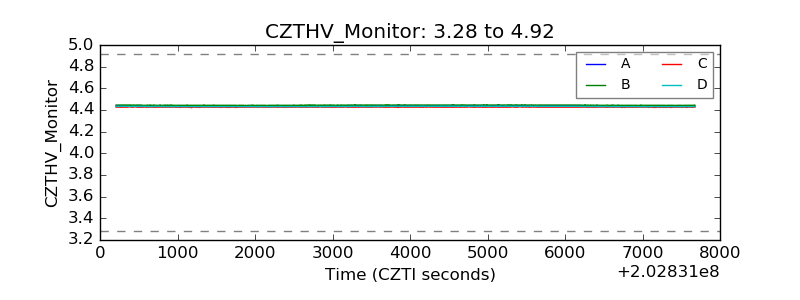 |
| D_VDD | 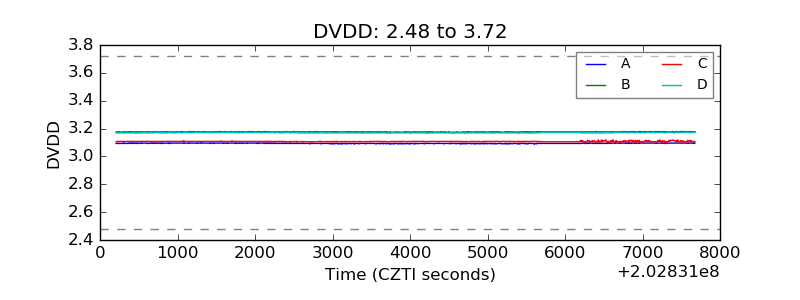 |
| Temperature 1 | 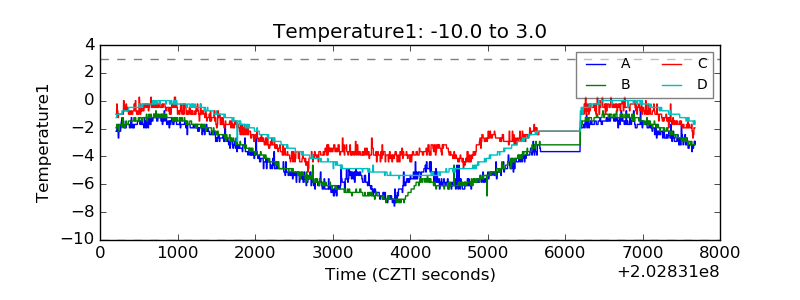 |
| Veto HV Monitor | 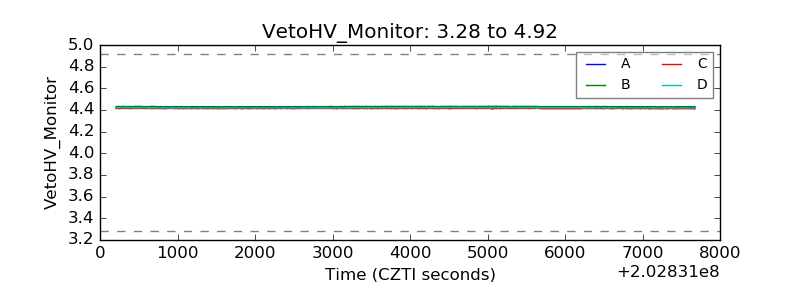 |
| Veto LLD | 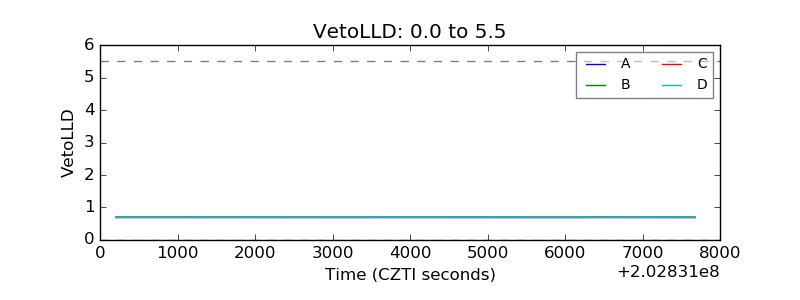 |
| Alpha Counter | 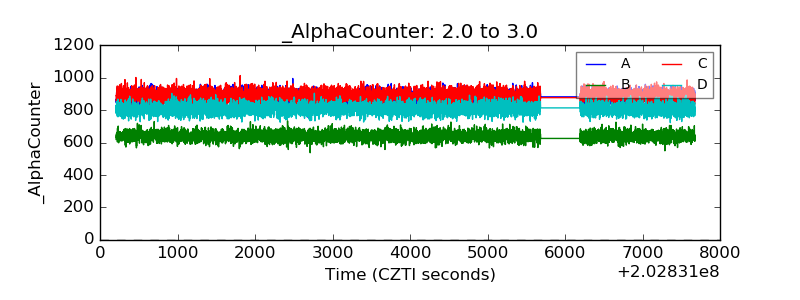 |
| _CPM_Rate | 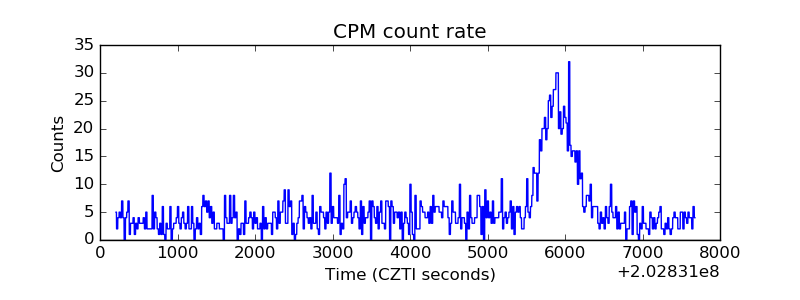 |
| CZT Counter | 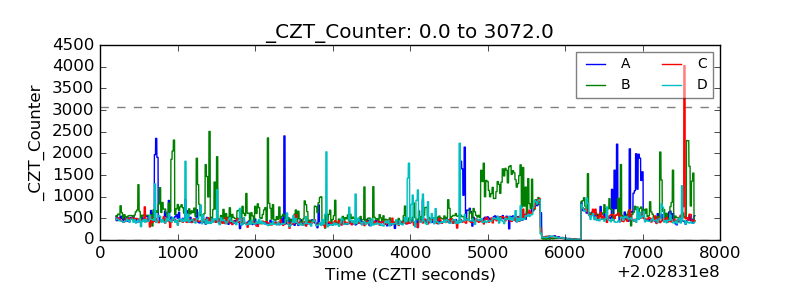 |
| +2.5 Volts monitor | 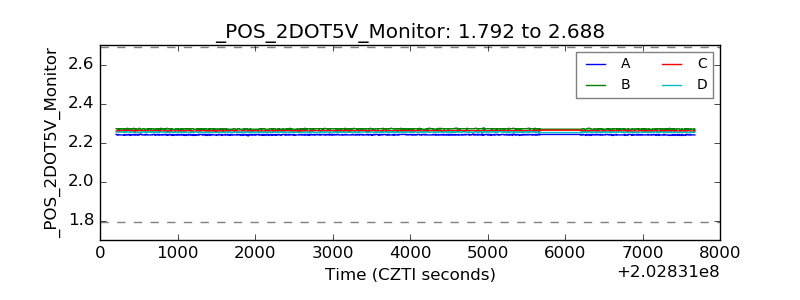 |
| +5 Volts monitor | 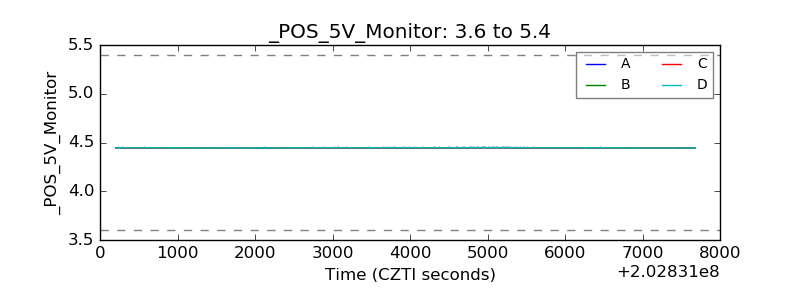 |
| Veto Counter | 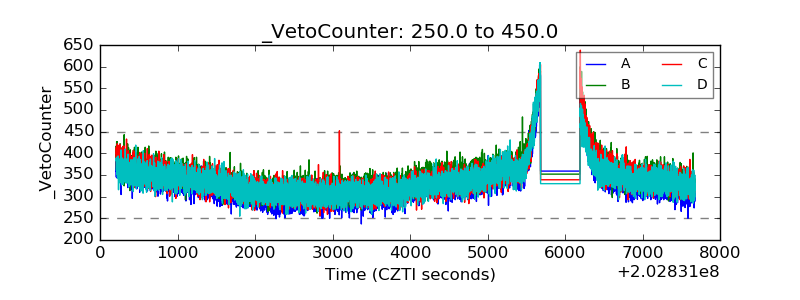 |