| Param | Original file | Final file |
|---|---|---|
| Filename | modeM0/AS1G05_248T01_9000000486_03724cztM0_level2.evt | modeM0/AS1G05_248T01_9000000486_03724cztM0_level2_quad_clean.evt |
| Size (bytes) | 523,981,440 | 86,941,440 |
| Size | 499.7 MB | 82.9 MB |
| Events in quadrant A | 3,837,849 | 538,753 |
| Events in quadrant B | 4,381,488 | 532,171 |
| Events in quadrant C | 3,397,288 | 533,745 |
| Events in quadrant D | 3,756,710 | 519,855 |
| Mode SS | |||
|---|---|---|---|
| Quadrant | BADHDUFLAG | Total packets | Discarded packets |
| A | 0 | 148 | 0 |
| B | 0 | 148 | 0 |
| C | 0 | 148 | 0 |
| D | 0 | 148 | 0 |
| Mode M9 | |||
|---|---|---|---|
| Quadrant | BADHDUFLAG | Total packets | Discarded packets |
| A | 0 | 1 | 0 |
| B | 0 | 1 | 0 |
| C | 0 | 1 | 0 |
| D | 0 | 1 | 0 |
| Mode M0 | |||
|---|---|---|---|
| Quadrant | BADHDUFLAG | Total packets | Discarded packets |
| A | 0 | 16400 | 2 |
| B | 0 | 18041 | 1 |
| C | 0 | 15201 | 1 |
| D | 0 | 16535 | 1 |
| Quadrant | Total seconds | Saturated seconds | Saturation percentage |
|---|---|---|---|
| A | 7299 | 173 | 2.370188% |
| B | 7299 | 275 | 3.767639% |
| C | 7299 | 39 | 0.534320% |
| D | 7299 | 97 | 1.328949% |
Noise dominated data is calculated using 1-second bins in cleaned event files. If a bin has >2000 counts, and if more than 50% of those come from <1% of pixels, then it is considered to be noise-dominated and hence unusable.
| Quadrant | # 1 sec bins | Bins with >0 counts | Bins with >2000 counts | High rate bins dominated by noise | Noise dominated (total time) | Noise dominated (detector-on time) | Marked lightcurve |
|---|---|---|---|---|---|---|---|
| A | 7394 | 7300 | 23 | 23 | 0.31% | 0.32% | 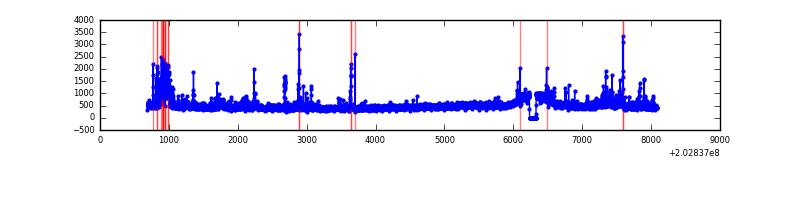 |
| B | 7394 | 7300 | 77 | 77 | 1.04% | 1.05% | 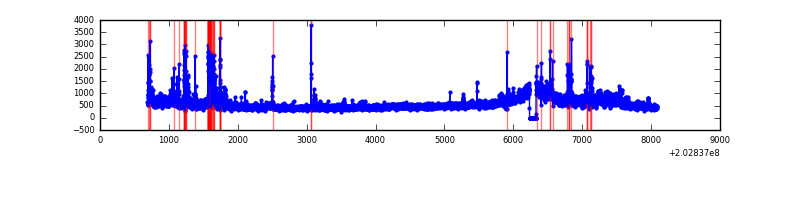 |
| C | 7394 | 7300 | 0 | 0 | 0.00% | 0.00% | 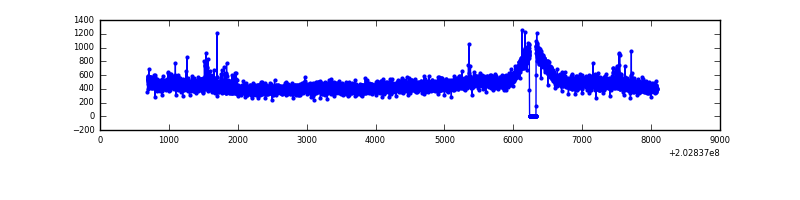 |
| D | 7394 | 7300 | 58 | 58 | 0.78% | 0.79% | 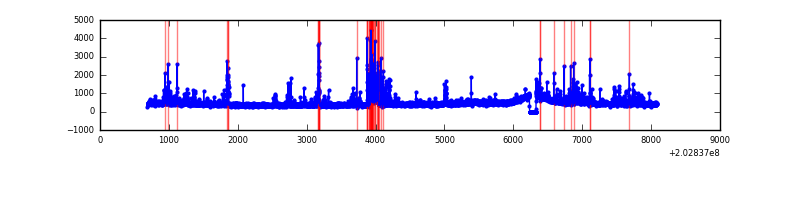 |
Top three noisy pixels from each quadrant. If the there are fewer than three noisy pixels in the level2.evt file, extra rows are filled as -1
| Pixel properties | Quadrant properties | ||||||
|---|---|---|---|---|---|---|---|
| Quadrant | DetID | PixID | Counts | Sigma | Mean | Median | Sigma |
| A | 0 | 118 | 336952 | 1902.84 | 849 | 829 | 176.6 |
| A | 8 | 15 | 101146 | 567.91 | 849 | 829 | 176.6 |
| A | 0 | 50 | 62909 | 351.44 | 849 | 829 | 176.6 |
| B | 15 | 204 | 580680 | 3513.88 | 854 | 832 | 165.0 |
| B | 2 | 249 | 273257 | 1650.9 | 854 | 832 | 165.0 |
| B | 0 | 173 | 65257 | 390.42 | 854 | 832 | 165.0 |
| C | 2 | 53 | 94060 | 479.01 | 828 | 831 | 194.6 |
| C | 9 | 144 | 16198 | 78.96 | 828 | 831 | 194.6 |
| C | 8 | 128 | 15954 | 77.7 | 828 | 831 | 194.6 |
| D | 13 | 239 | 203697 | 992.73 | 827 | 799 | 204.4 |
| D | 13 | 25 | 70015 | 338.66 | 827 | 799 | 204.4 |
| D | 2 | 37 | 60845 | 293.79 | 827 | 799 | 204.4 |
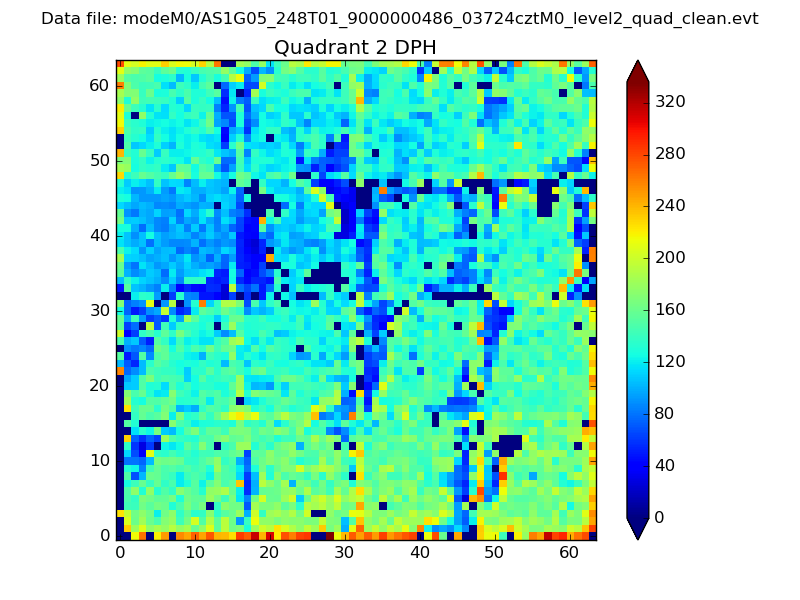
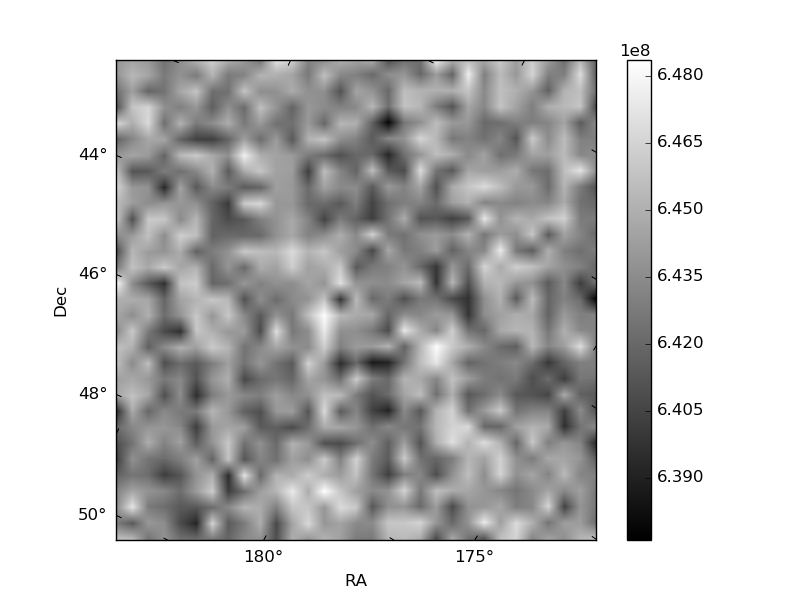
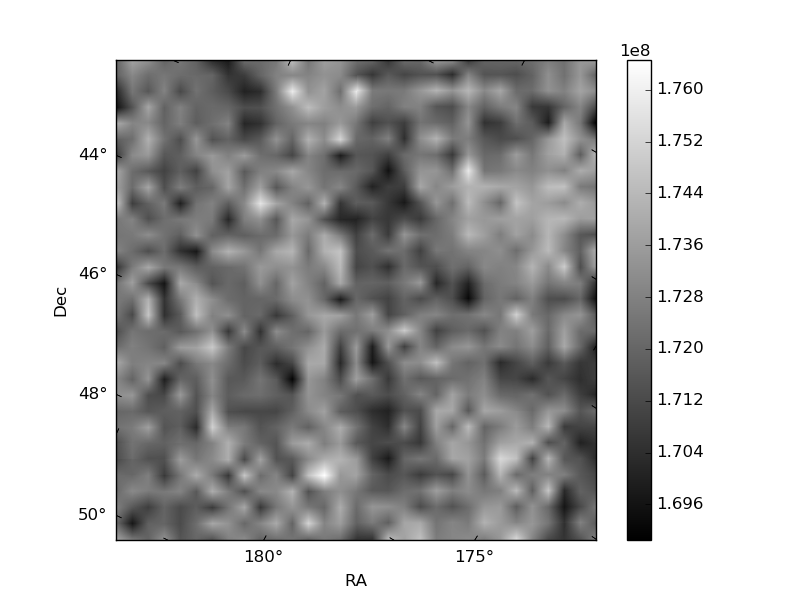
Histogram calculated using DETX and DETY for each event in the final _common_clean file
| Quadrant A | 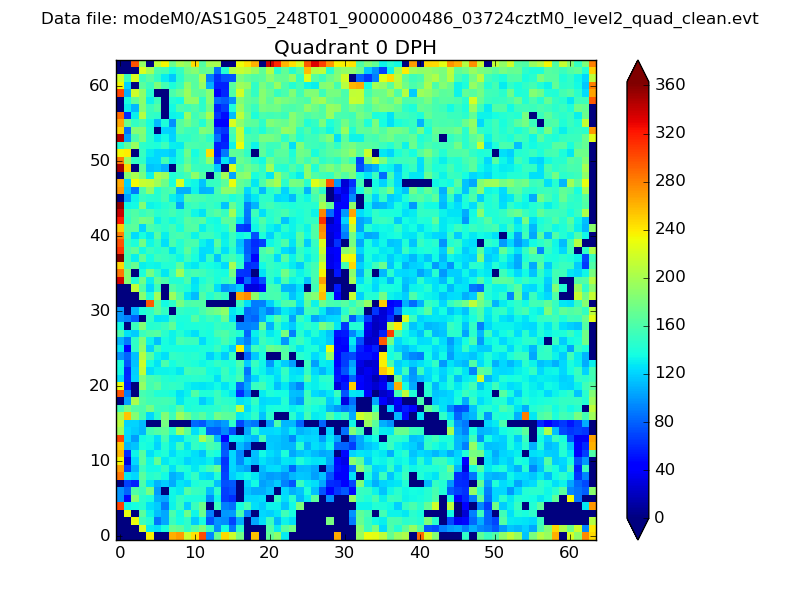 |
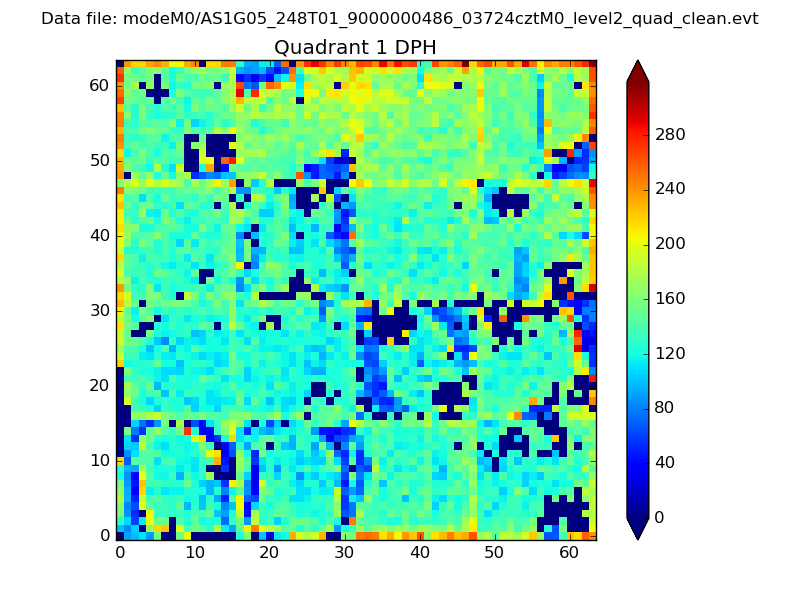 |
Quadrant B |
|---|---|---|---|
| Quadrant D | 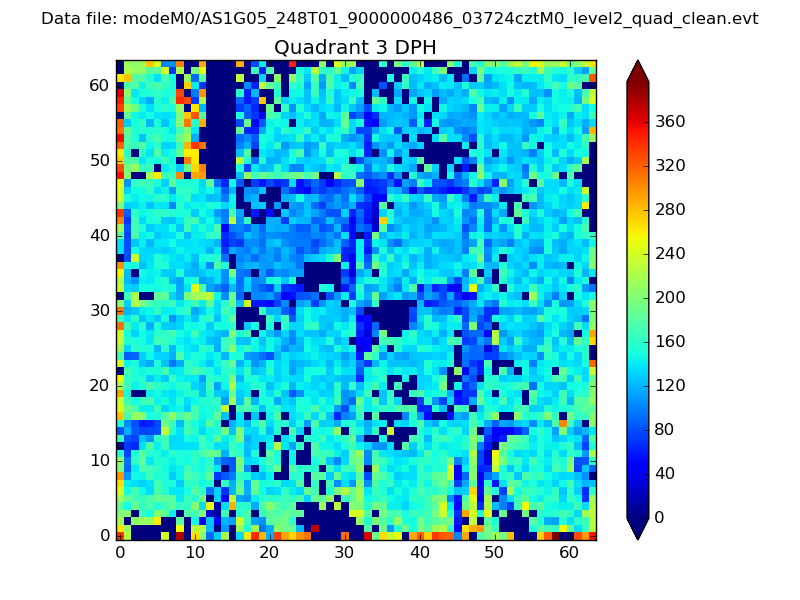 |
 |
Quadrant C |
| Plot type | Count rate plots | Images |
|---|---|---|
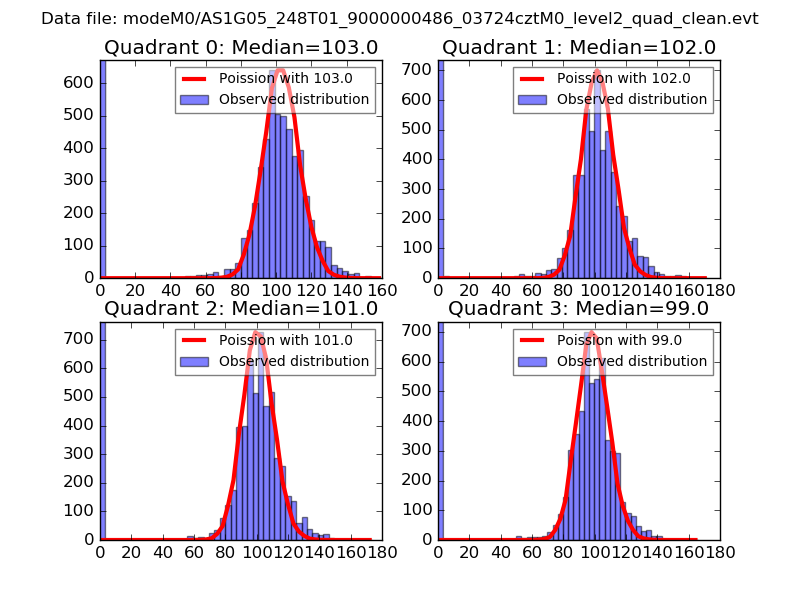
| Comparison with Poisson distribution Blue bars denote a histogram of data divided into 1 sec bins. Red curve is a Poisson curve with rate = median count rate of data. |
 |
 |
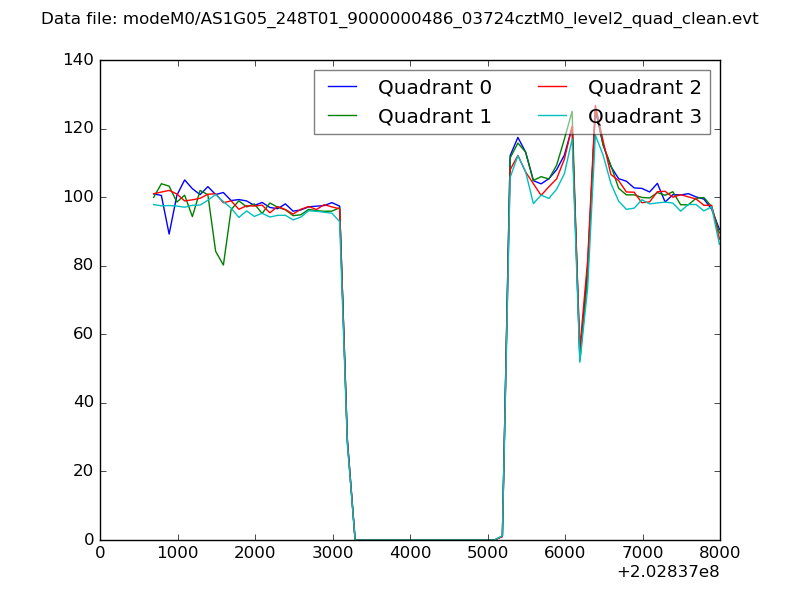
| Quadrant-wise count rates Data is divided into 100 sec bins |
 |
|
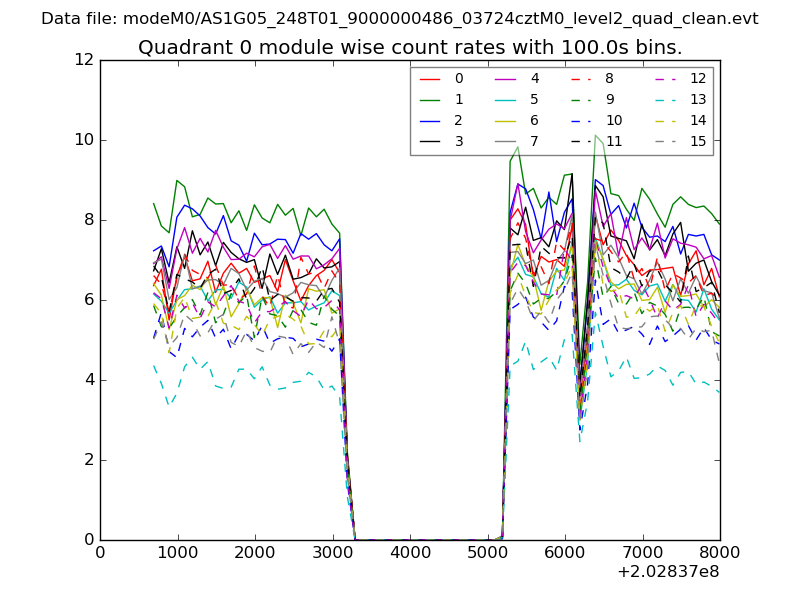
| Module-wise count rates for Quadrant A Data is divided into 100 sec bins |
 |
 |
| Module-wise count rates for Quadrant B Data is divided into 100 sec bins |
 |
 |
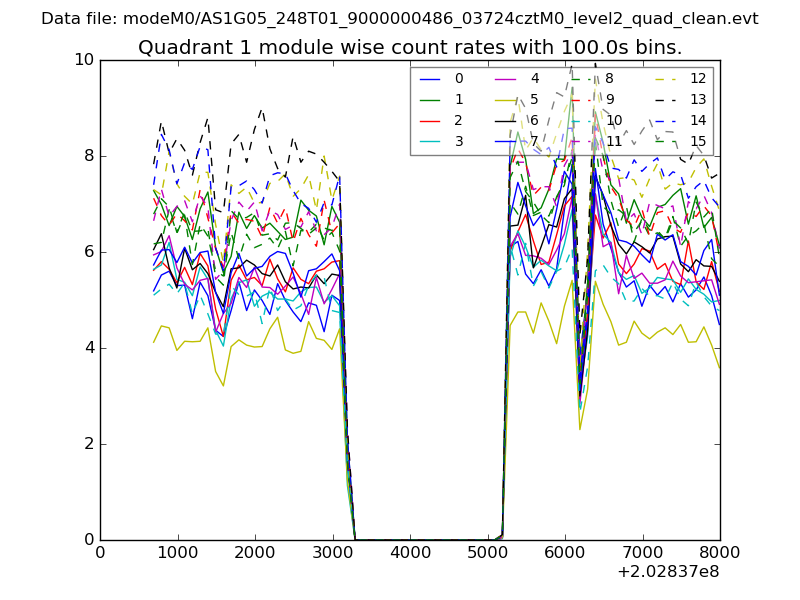
| Module-wise count rates for Quadrant C Data is divided into 100 sec bins |
 |
 |
| Module-wise count rates for Quadrant D Data is divided into 100 sec bins |
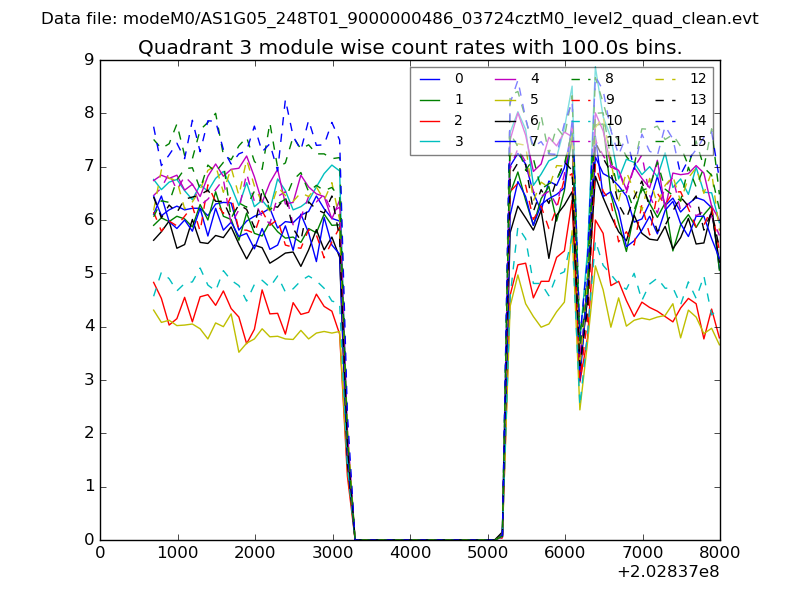 |
 |
| Parameter | Plot |
|---|---|
| CZT HV Monitor |  |
| D_VDD | 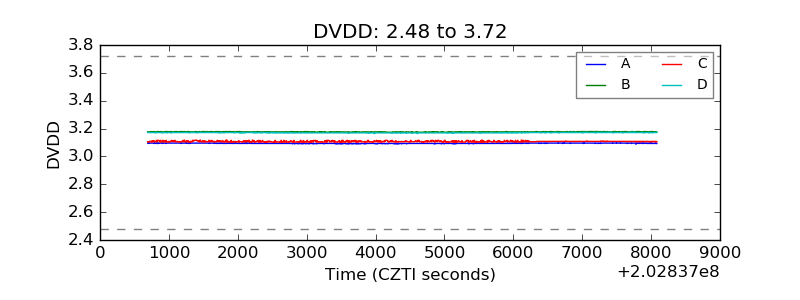 |
| Temperature 1 | 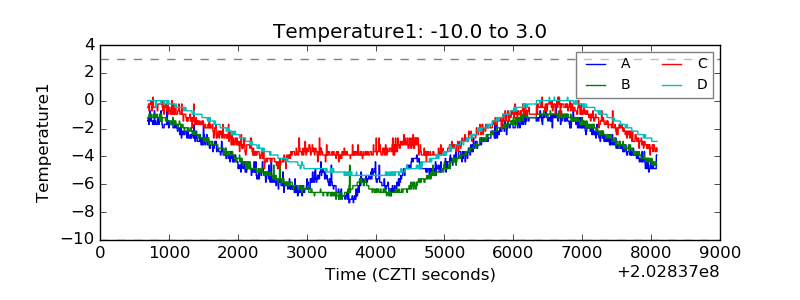 |
| Veto HV Monitor | 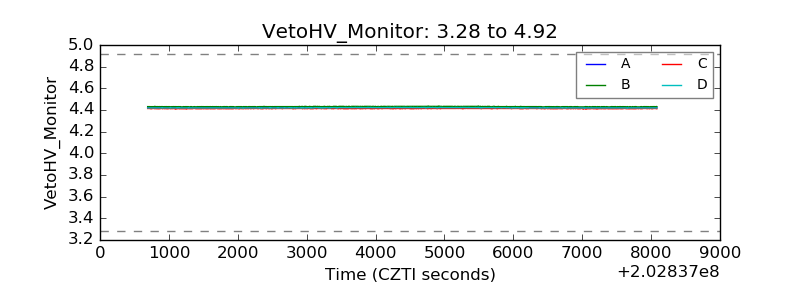 |
| Veto LLD | 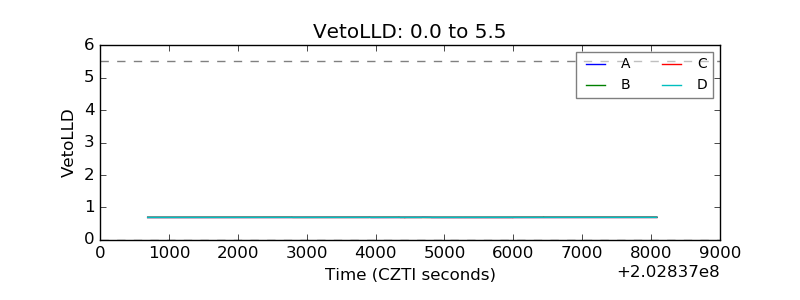 |
| Alpha Counter | 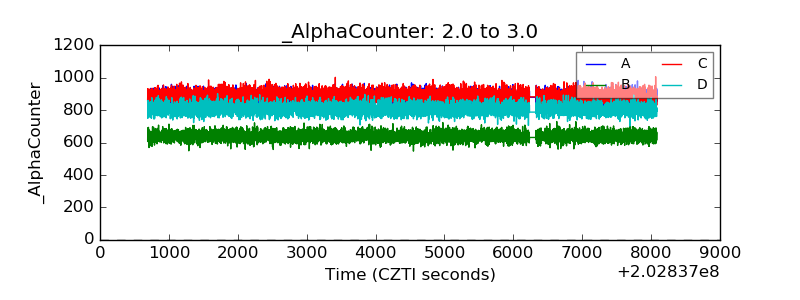 |
| _CPM_Rate | 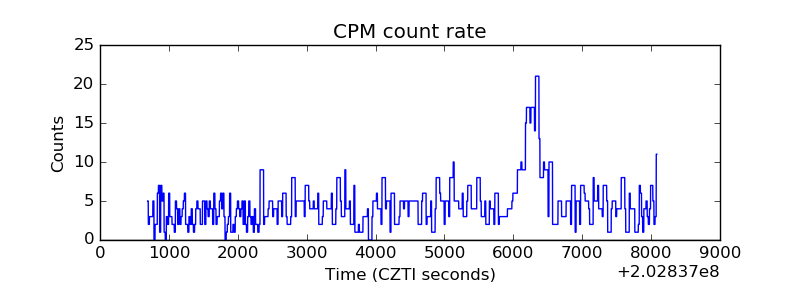 |
| CZT Counter | 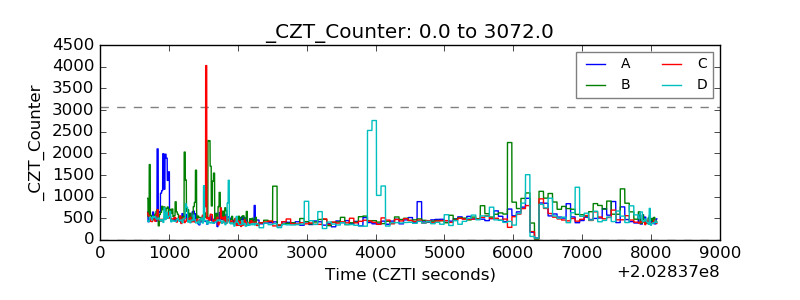 |
| +2.5 Volts monitor |  |
| +5 Volts monitor |  |
| Veto Counter |  |