| Param | Original file | Final file |
|---|---|---|
| Filename | modeM0/AS1G05_248T01_9000000486_03728cztM0_level2.evt | modeM0/AS1G05_248T01_9000000486_03728cztM0_level2_quad_clean.evt |
| Size (bytes) | 1,328,978,880 | 210,314,880 |
| Size | 1.2 GB | 200.6 MB |
| Events in quadrant A | 10,421,706 | 1,330,264 |
| Events in quadrant B | 10,810,445 | 1,273,852 |
| Events in quadrant C | 8,264,465 | 1,231,576 |
| Events in quadrant D | 9,513,647 | 1,270,994 |
| Mode SS | |||
|---|---|---|---|
| Quadrant | BADHDUFLAG | Total packets | Discarded packets |
| A | 0 | 372 | 0 |
| B | 0 | 372 | 0 |
| C | 0 | 372 | 0 |
| D | 0 | 372 | 0 |
| Mode M9 | |||
|---|---|---|---|
| Quadrant | BADHDUFLAG | Total packets | Discarded packets |
| A | 0 | 20 | 0 |
| B | 0 | 20 | 0 |
| C | 0 | 20 | 0 |
| D | 0 | 20 | 0 |
| Mode M0 | |||
|---|---|---|---|
| Quadrant | BADHDUFLAG | Total packets | Discarded packets |
| A | 0 | 43737 | 4 |
| B | 0 | 44842 | 3 |
| C | 0 | 37637 | 3 |
| D | 0 | 41979 | 3 |
| Quadrant | Total seconds | Saturated seconds | Saturation percentage |
|---|---|---|---|
| A | 18326 | 402 | 2.193605% |
| B | 18326 | 330 | 1.800720% |
| C | 18326 | 33 | 0.180072% |
| D | 18326 | 237 | 1.293245% |
Noise dominated data is calculated using 1-second bins in cleaned event files. If a bin has >2000 counts, and if more than 50% of those come from <1% of pixels, then it is considered to be noise-dominated and hence unusable.
| Quadrant | # 1 sec bins | Bins with >0 counts | Bins with >2000 counts | High rate bins dominated by noise | Noise dominated (total time) | Noise dominated (detector-on time) | Marked lightcurve |
|---|---|---|---|---|---|---|---|
| A | 20296 | 18329 | 292 | 292 | 1.44% | 1.59% | 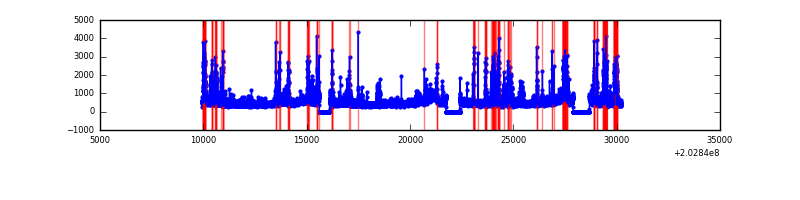 |
| B | 20296 | 18328 | 150 | 150 | 0.74% | 0.82% | 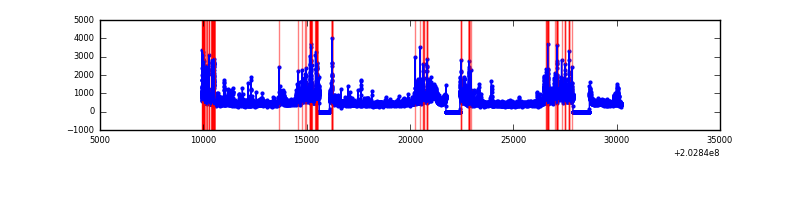 |
| C | 20296 | 18329 | 2 | 2 | 0.01% | 0.01% | 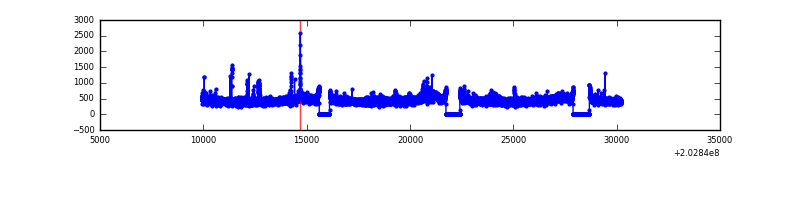 |
| D | 20296 | 18329 | 207 | 207 | 1.02% | 1.13% | 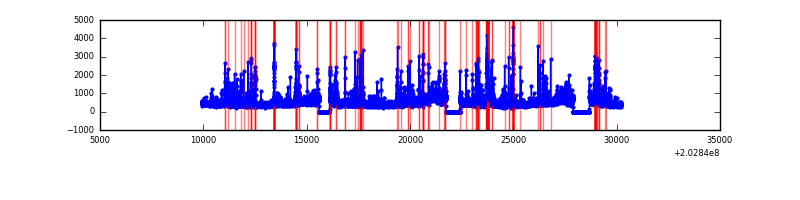 |
Top three noisy pixels from each quadrant. If the there are fewer than three noisy pixels in the level2.evt file, extra rows are filled as -1
| Pixel properties | Quadrant properties | ||||||
|---|---|---|---|---|---|---|---|
| Quadrant | DetID | PixID | Counts | Sigma | Mean | Median | Sigma |
| A | 0 | 118 | 1096845 | 2521.52 | 2112 | 2065 | 434.2 |
| A | 8 | 15 | 521227 | 1195.74 | 2112 | 2065 | 434.2 |
| A | 15 | 174 | 176932 | 402.76 | 2112 | 2065 | 434.2 |
| B | 15 | 204 | 984369 | 2416.22 | 2119 | 2073 | 406.5 |
| B | 0 | 173 | 749590 | 1838.72 | 2119 | 2073 | 406.5 |
| B | 4 | 81 | 311990 | 762.32 | 2119 | 2073 | 406.5 |
| C | 2 | 53 | 233180 | 483.91 | 2034 | 2039 | 477.7 |
| C | 14 | 67 | 34660 | 68.29 | 2034 | 2039 | 477.7 |
| C | 12 | 4 | 24808 | 47.67 | 2034 | 2039 | 477.7 |
| D | 14 | 34 | 435186 | 876.22 | 2042 | 1986 | 494.4 |
| D | 13 | 171 | 247773 | 497.14 | 2042 | 1986 | 494.4 |
| D | 6 | 16 | 229620 | 460.43 | 2042 | 1986 | 494.4 |
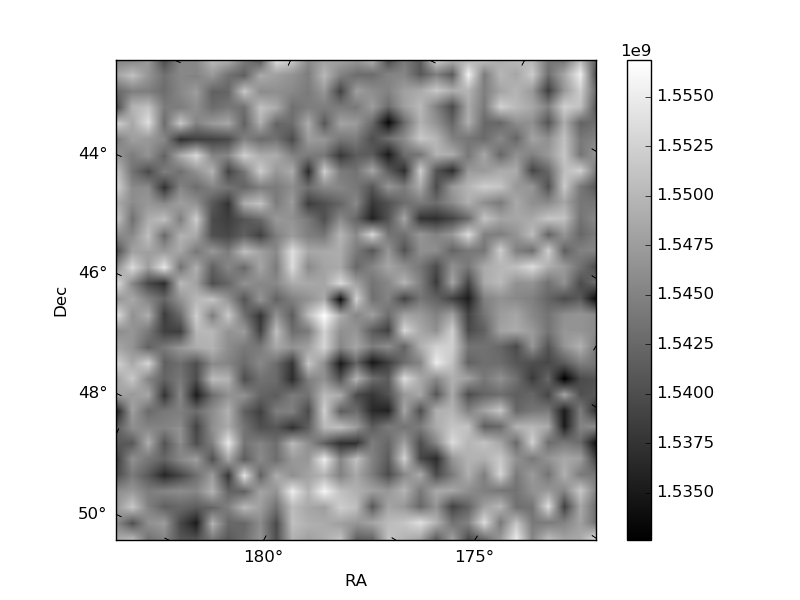
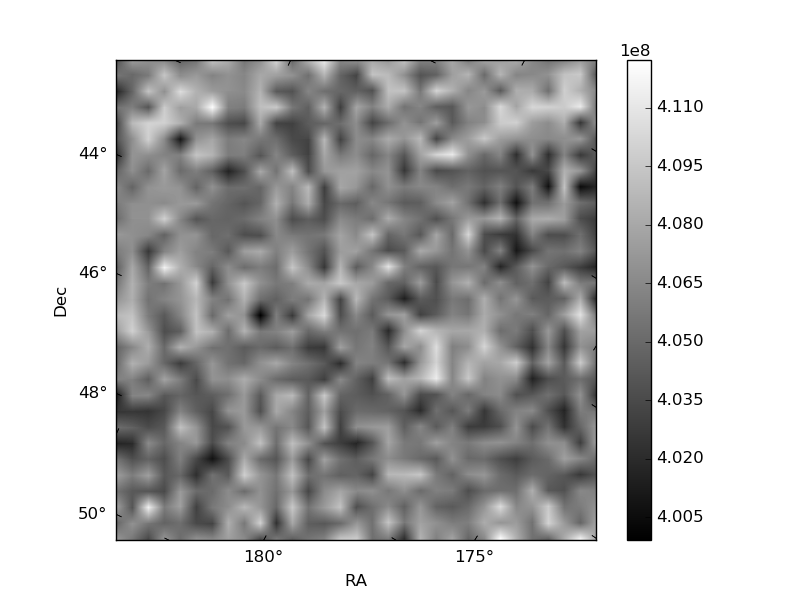
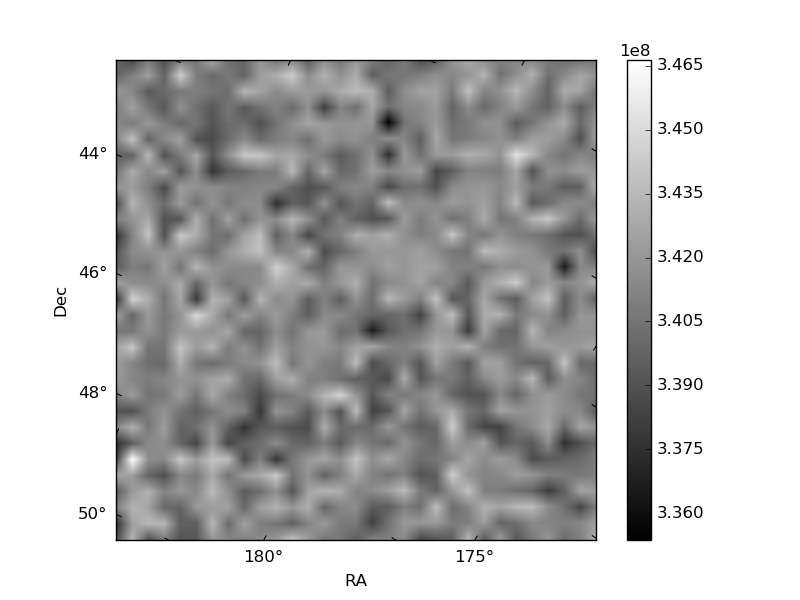
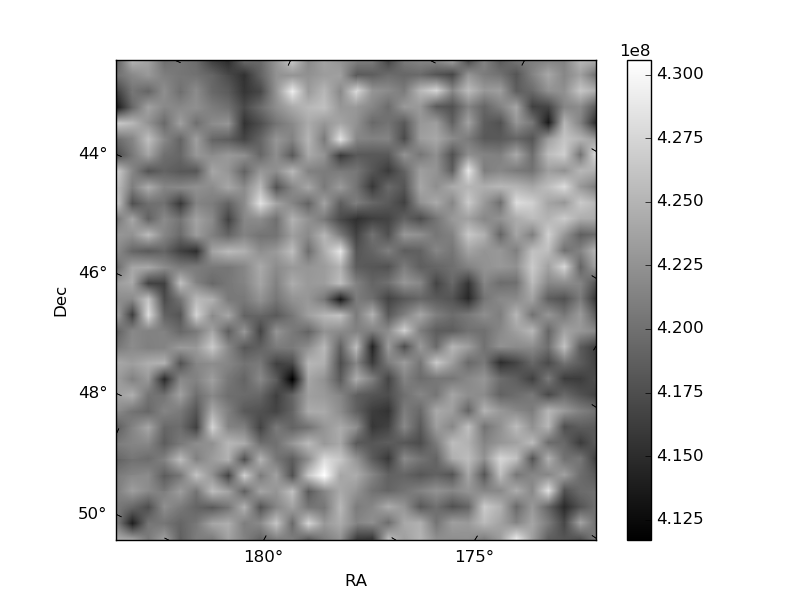
Histogram calculated using DETX and DETY for each event in the final _common_clean file
| Quadrant A | 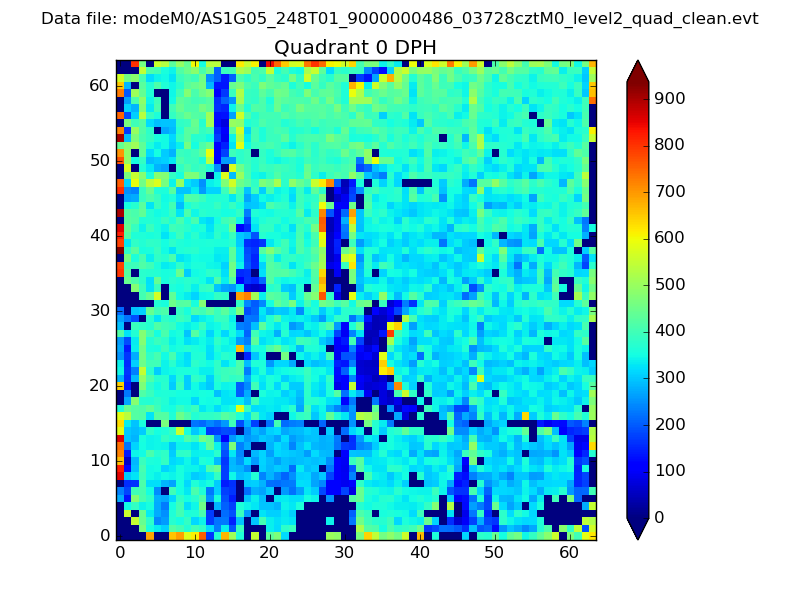 |
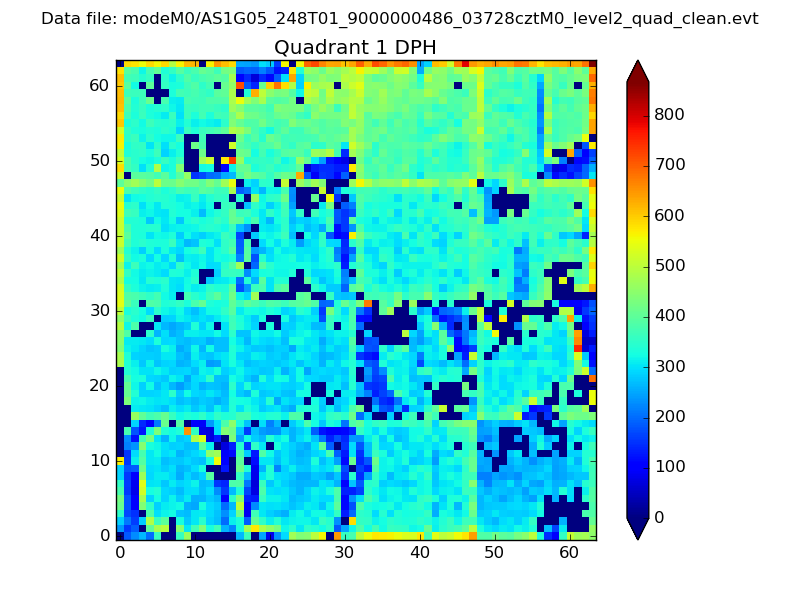 |
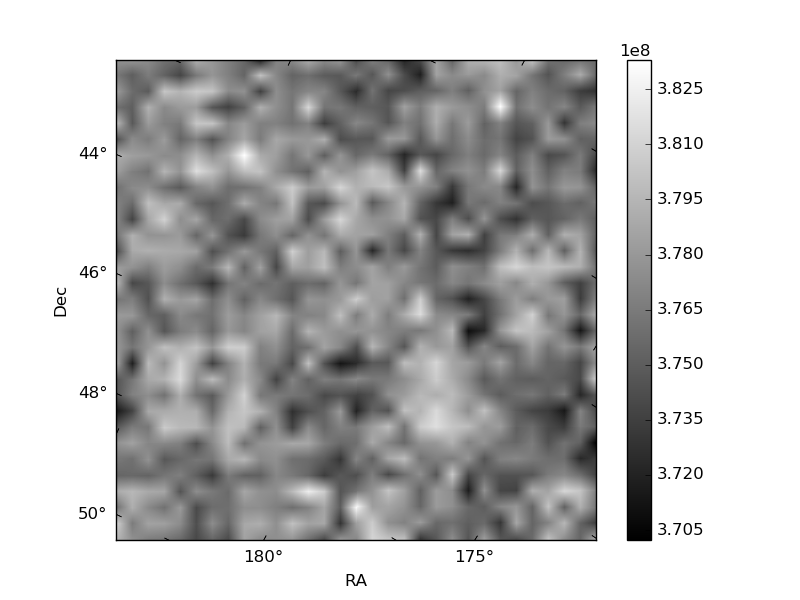
Quadrant B |
|---|---|---|---|
| Quadrant D | 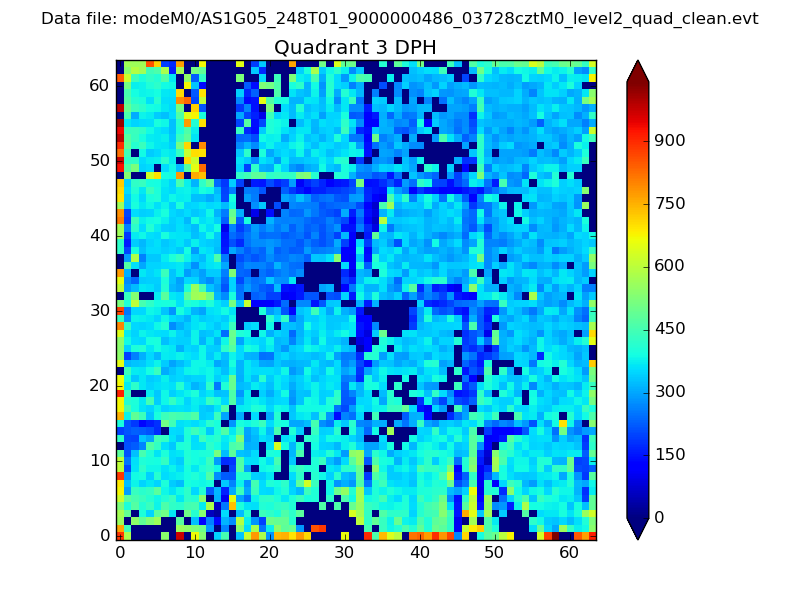 |
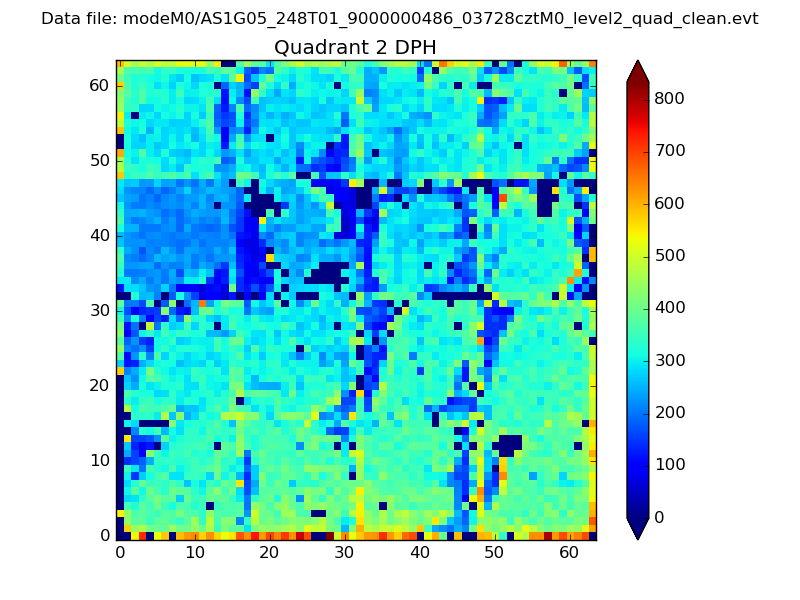 |
Quadrant C |
| Plot type | Count rate plots | Images |
|---|---|---|
| Comparison with Poisson distribution Blue bars denote a histogram of data divided into 1 sec bins. Red curve is a Poisson curve with rate = median count rate of data. |
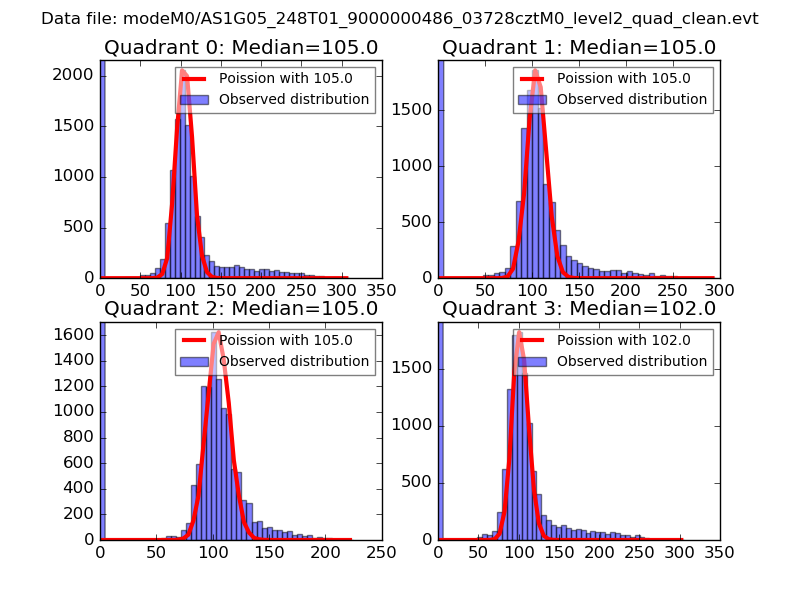 |
 |
| Quadrant-wise count rates Data is divided into 100 sec bins |
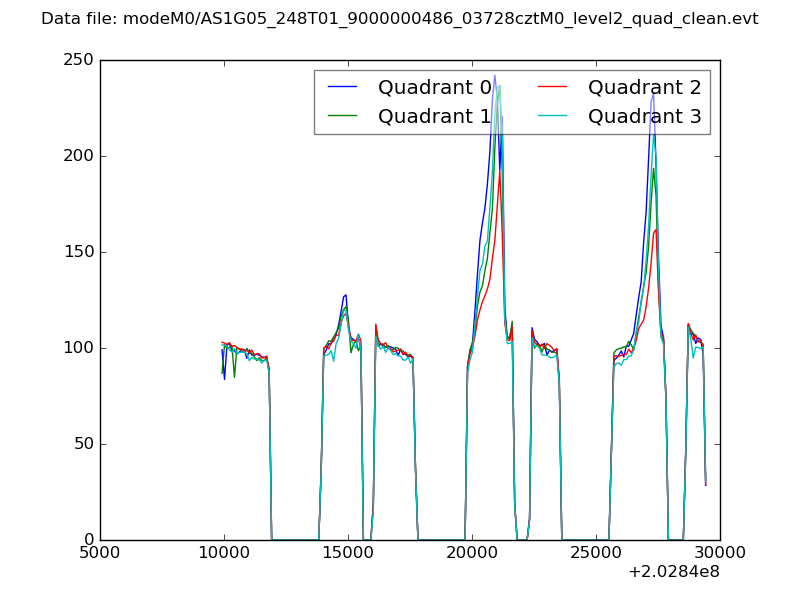 |
|
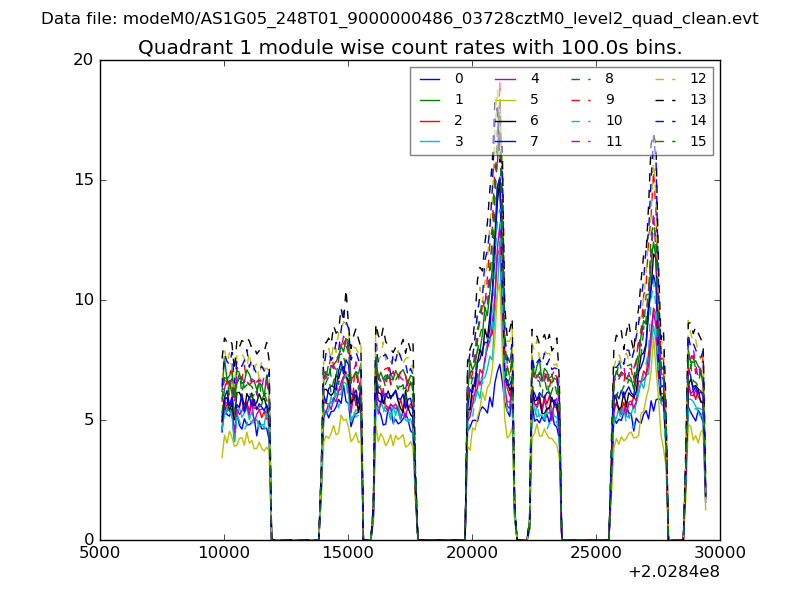
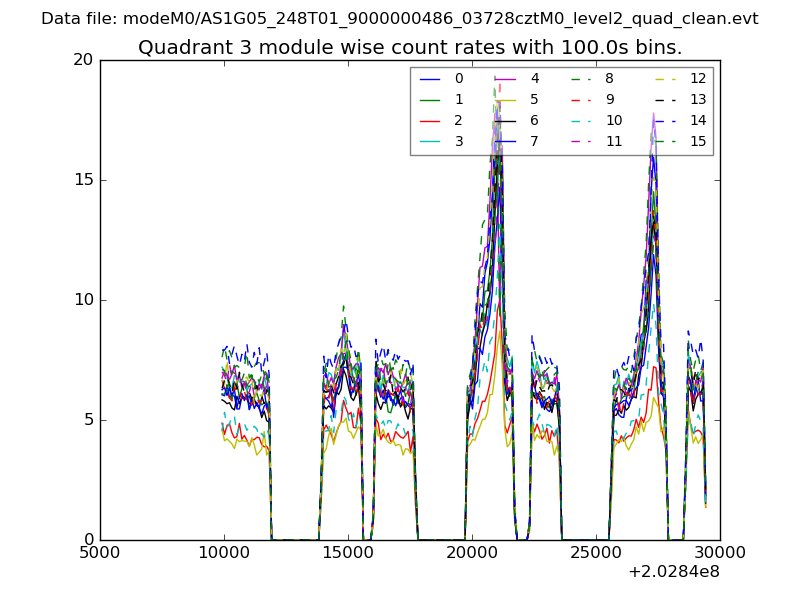
| Module-wise count rates for Quadrant A Data is divided into 100 sec bins |
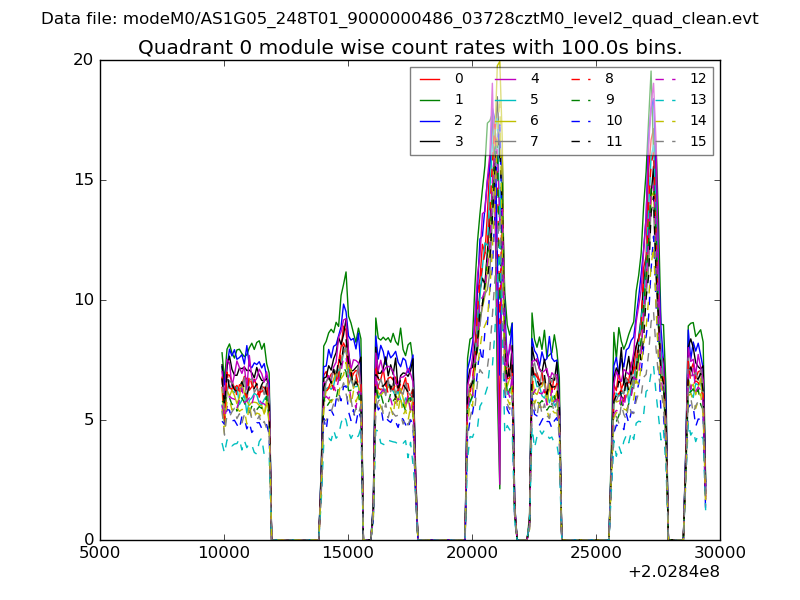 |
 |
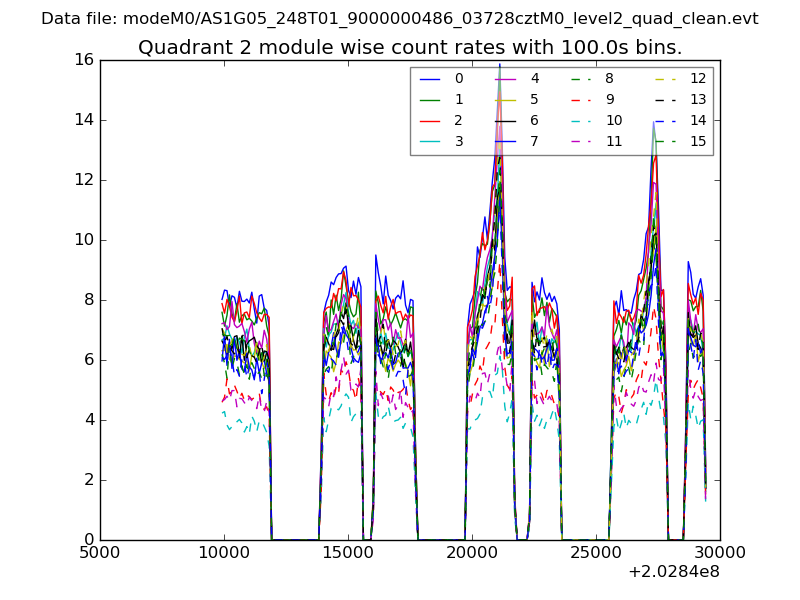
| Module-wise count rates for Quadrant B Data is divided into 100 sec bins |
 |
 |
| Module-wise count rates for Quadrant C Data is divided into 100 sec bins |
 |
 |
| Module-wise count rates for Quadrant D Data is divided into 100 sec bins |
 |
 |
| Parameter | Plot |
|---|---|
| CZT HV Monitor | 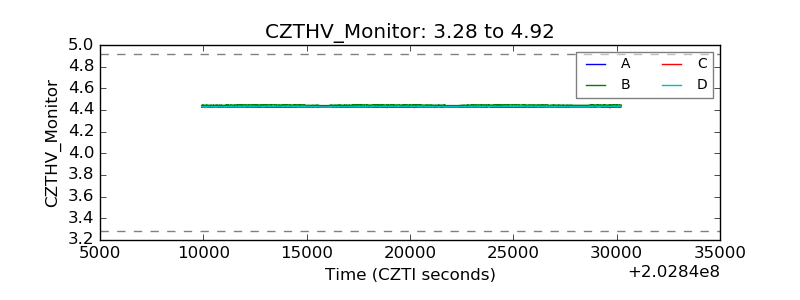 |
| D_VDD | 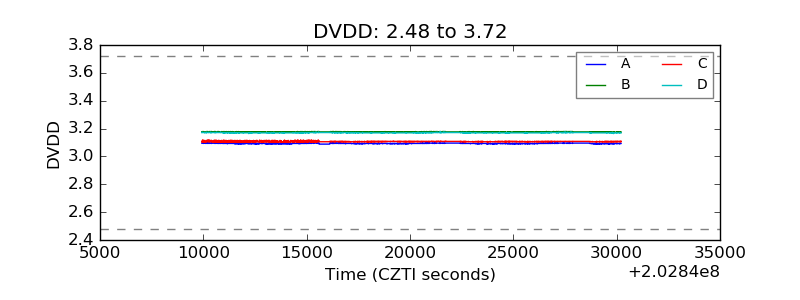 |
| Temperature 1 | 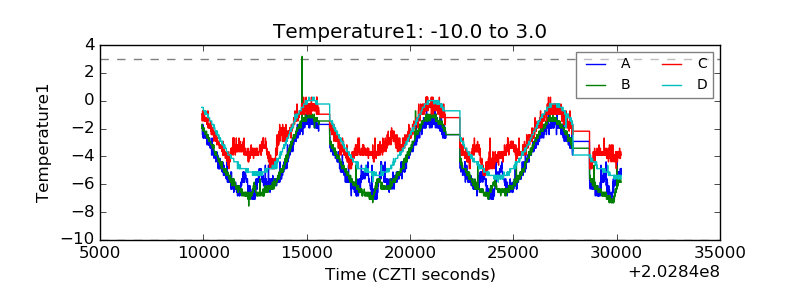 |
| Veto HV Monitor | 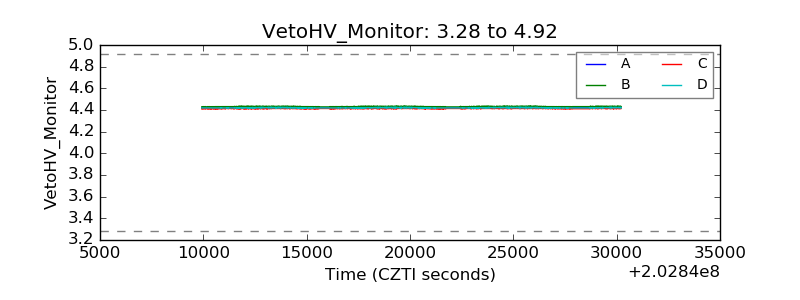 |
| Veto LLD | 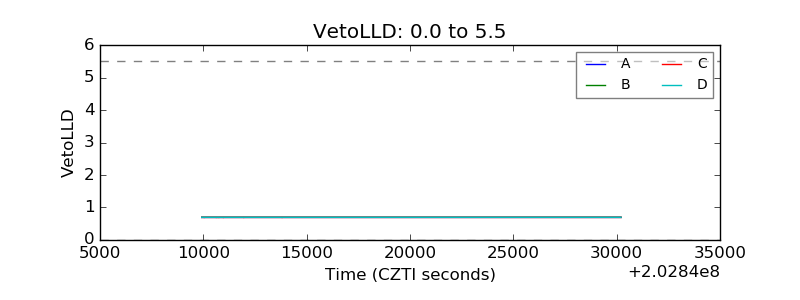 |
| Alpha Counter | 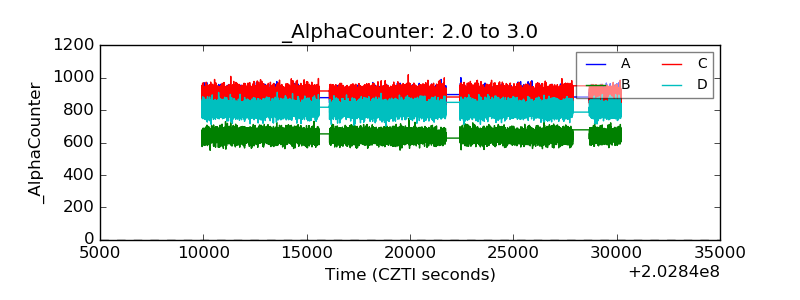 |
| _CPM_Rate |  |
| CZT Counter | 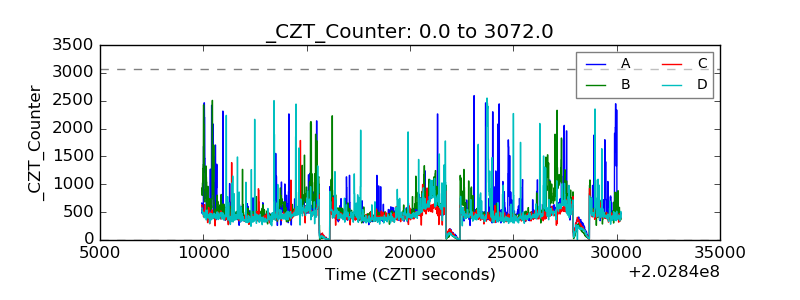 |
| +2.5 Volts monitor |  |
| +5 Volts monitor |  |
| Veto Counter | 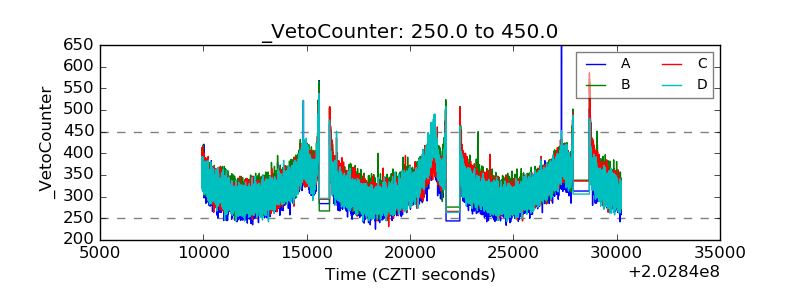 |