| Param | Original file | Final file |
|---|---|---|
| Filename | modeM0/AS1G05_248T01_9000000486_03729cztM0_level2.evt | modeM0/AS1G05_248T01_9000000486_03729cztM0_level2_quad_clean.evt |
| Size (bytes) | 511,580,160 | 72,748,800 |
| Size | 487.9 MB | 69.4 MB |
| Events in quadrant A | 4,459,427 | 428,807 |
| Events in quadrant B | 3,828,697 | 433,825 |
| Events in quadrant C | 3,152,213 | 427,795 |
| Events in quadrant D | 3,572,504 | 419,593 |
| Mode SS | |||
|---|---|---|---|
| Quadrant | BADHDUFLAG | Total packets | Discarded packets |
| A | 0 | 146 | 0 |
| B | 0 | 146 | 0 |
| C | 0 | 146 | 0 |
| D | 0 | 146 | 0 |
| Mode M9 | |||
|---|---|---|---|
| Quadrant | BADHDUFLAG | Total packets | Discarded packets |
| A | 0 | 17 | 0 |
| B | 0 | 17 | 0 |
| C | 0 | 17 | 0 |
| D | 0 | 17 | 0 |
| Mode M0 | |||
|---|---|---|---|
| Quadrant | BADHDUFLAG | Total packets | Discarded packets |
| A | 0 | 18055 | 3 |
| B | 0 | 16142 | 2 |
| C | 0 | 14421 | 2 |
| D | 0 | 15634 | 2 |
| Quadrant | Total seconds | Saturated seconds | Saturation percentage |
|---|---|---|---|
| A | 7073 | 342 | 4.835289% |
| B | 7073 | 137 | 1.936943% |
| C | 7073 | 43 | 0.607946% |
| D | 7073 | 104 | 1.470380% |
Noise dominated data is calculated using 1-second bins in cleaned event files. If a bin has >2000 counts, and if more than 50% of those come from <1% of pixels, then it is considered to be noise-dominated and hence unusable.
| Quadrant | # 1 sec bins | Bins with >0 counts | Bins with >2000 counts | High rate bins dominated by noise | Noise dominated (total time) | Noise dominated (detector-on time) | Marked lightcurve |
|---|---|---|---|---|---|---|---|
| A | 8798 | 7075 | 260 | 260 | 2.96% | 3.67% | 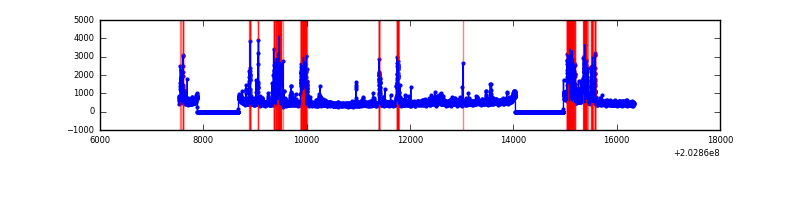 |
| B | 8798 | 7074 | 17 | 17 | 0.19% | 0.24% | 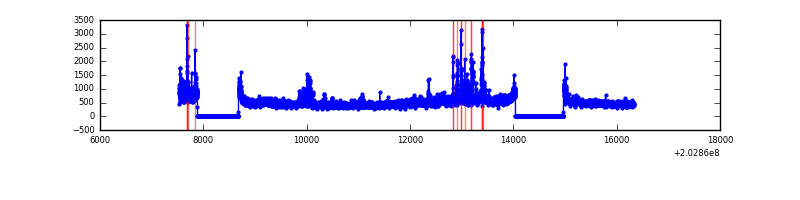 |
| C | 8798 | 7075 | 0 | 0 | 0.00% | 0.00% | 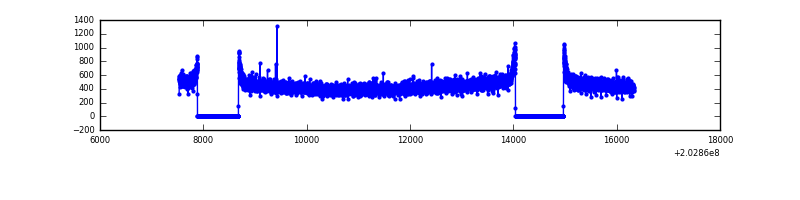 |
| D | 8798 | 7075 | 48 | 48 | 0.55% | 0.68% | 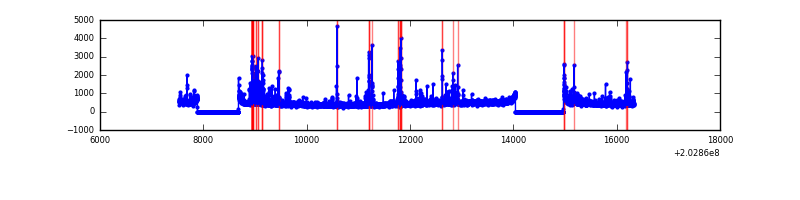 |
Top three noisy pixels from each quadrant. If the there are fewer than three noisy pixels in the level2.evt file, extra rows are filled as -1
| Pixel properties | Quadrant properties | ||||||
|---|---|---|---|---|---|---|---|
| Quadrant | DetID | PixID | Counts | Sigma | Mean | Median | Sigma |
| A | 0 | 118 | 786464 | 4698.29 | 813 | 794 | 167.2 |
| A | 13 | 251 | 285243 | 1701.0 | 813 | 794 | 167.2 |
| A | 8 | 15 | 106940 | 634.75 | 813 | 794 | 167.2 |
| B | 15 | 204 | 241641 | 1484.68 | 836 | 815 | 162.2 |
| B | 0 | 173 | 203730 | 1250.96 | 836 | 815 | 162.2 |
| B | 5 | 70 | 59605 | 362.44 | 836 | 815 | 162.2 |
| C | 13 | 61 | 6743 | 31.31 | 804 | 806 | 189.6 |
| C | 2 | 53 | 5334 | 23.88 | 804 | 806 | 189.6 |
| C | 7 | 202 | 3640 | 14.95 | 804 | 806 | 189.6 |
| D | 14 | 34 | 113652 | 588.26 | 794 | 771 | 191.9 |
| D | 13 | 239 | 101410 | 524.46 | 794 | 771 | 191.9 |
| D | 9 | 35 | 90699 | 468.64 | 794 | 771 | 191.9 |
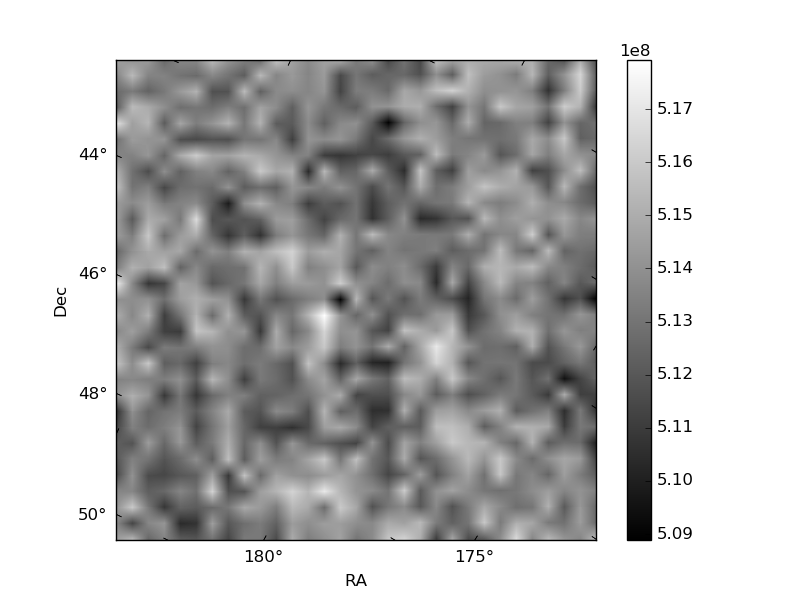
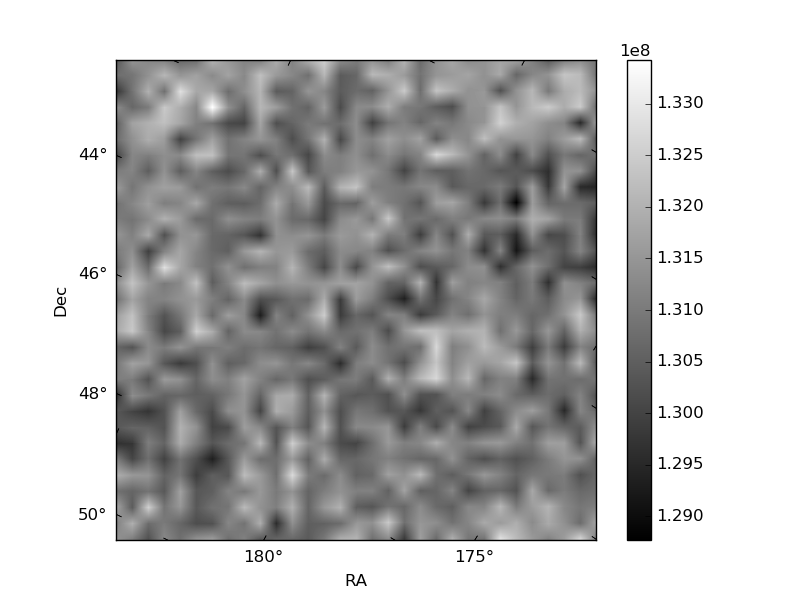
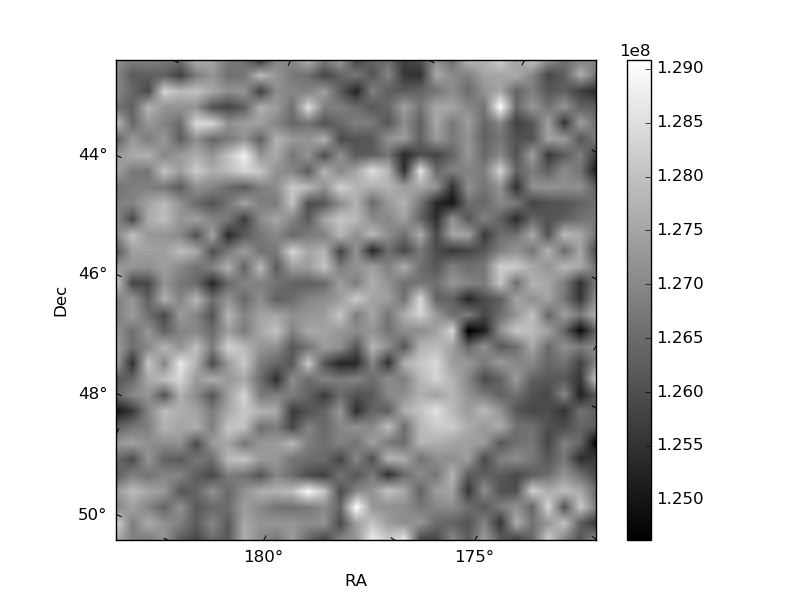
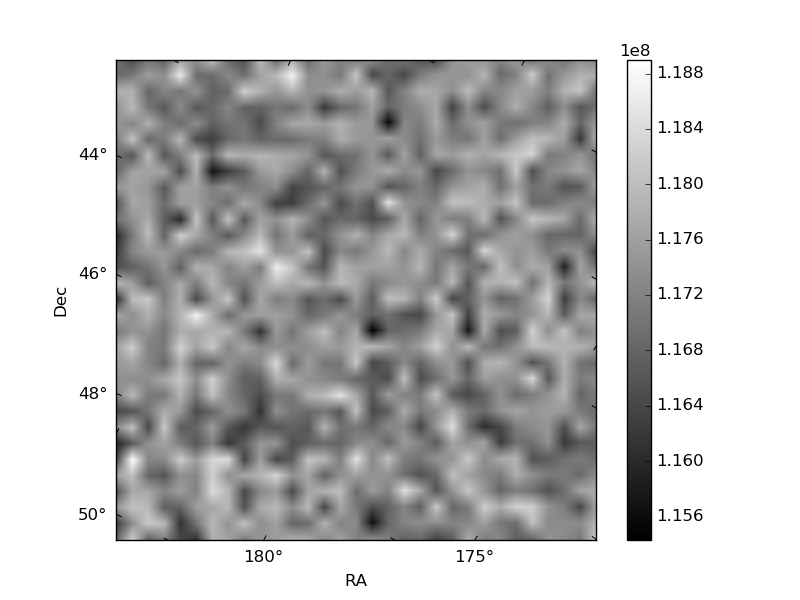
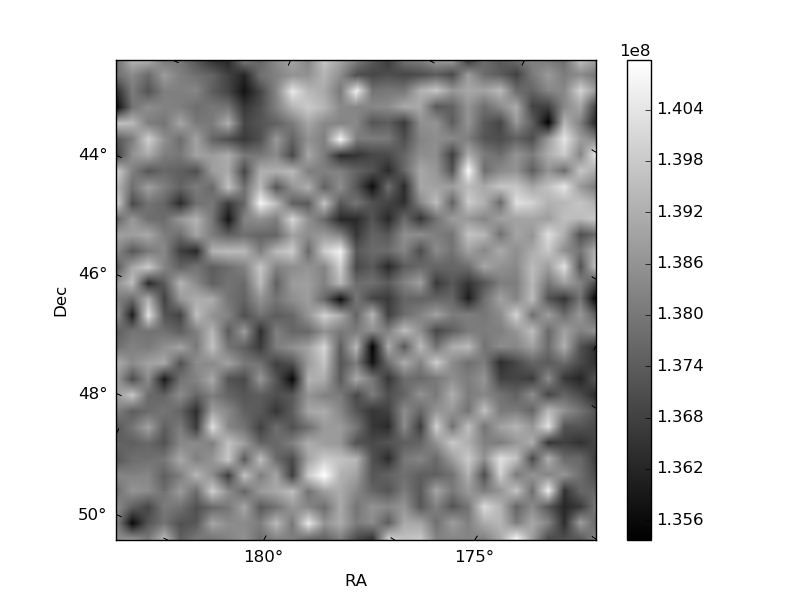
Histogram calculated using DETX and DETY for each event in the final _common_clean file
| Quadrant A | 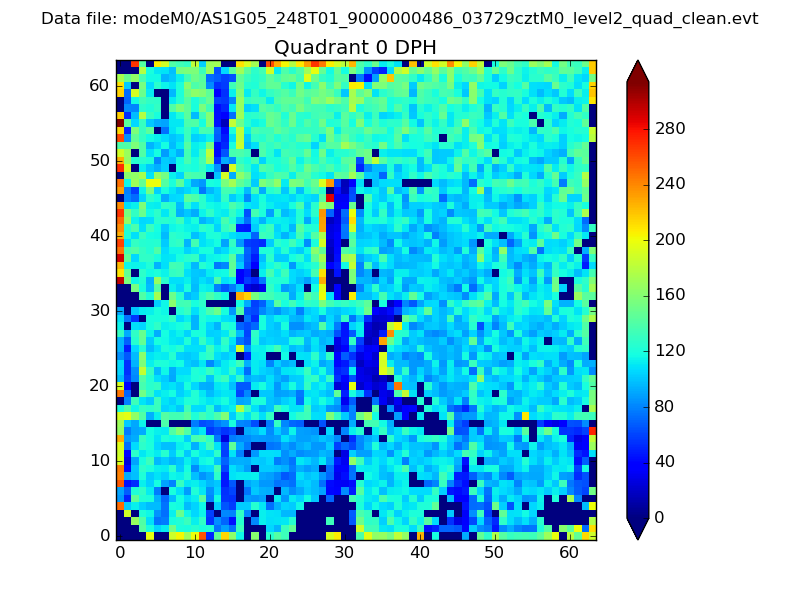 |
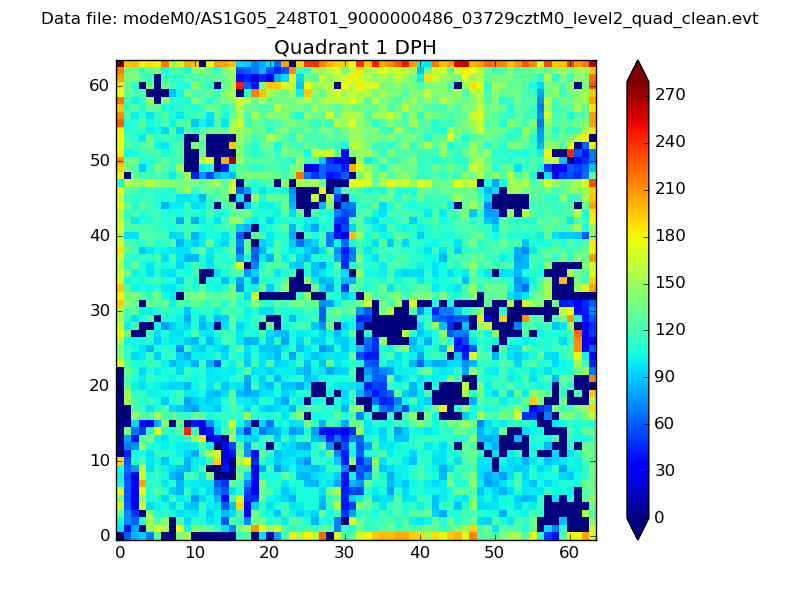 |
Quadrant B |
|---|---|---|---|
| Quadrant D | 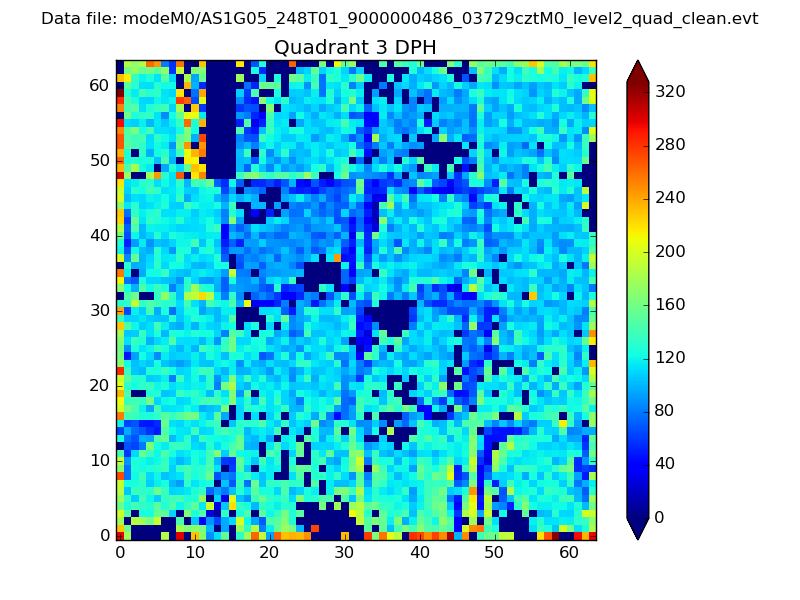 |
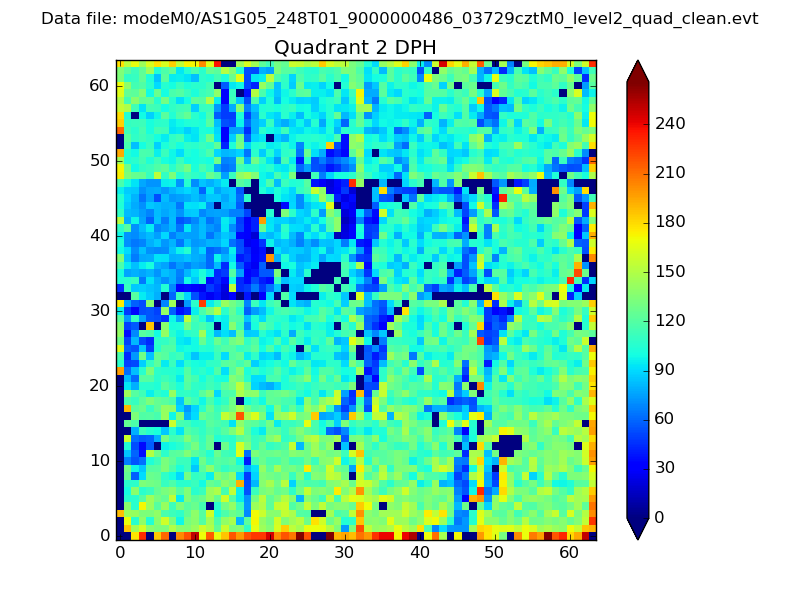 |
Quadrant C |
| Plot type | Count rate plots | Images |
|---|---|---|
| Comparison with Poisson distribution Blue bars denote a histogram of data divided into 1 sec bins. Red curve is a Poisson curve with rate = median count rate of data. |
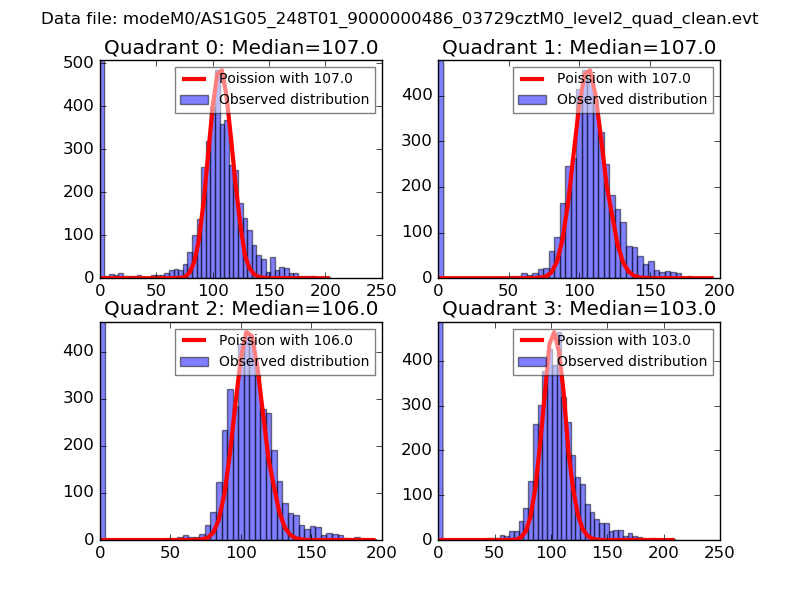 |
 |
| Quadrant-wise count rates Data is divided into 100 sec bins |
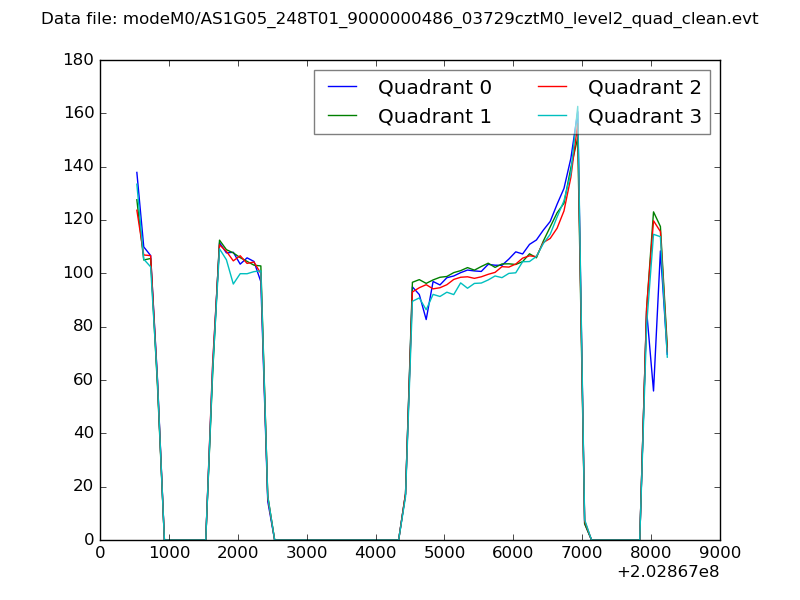 |
|
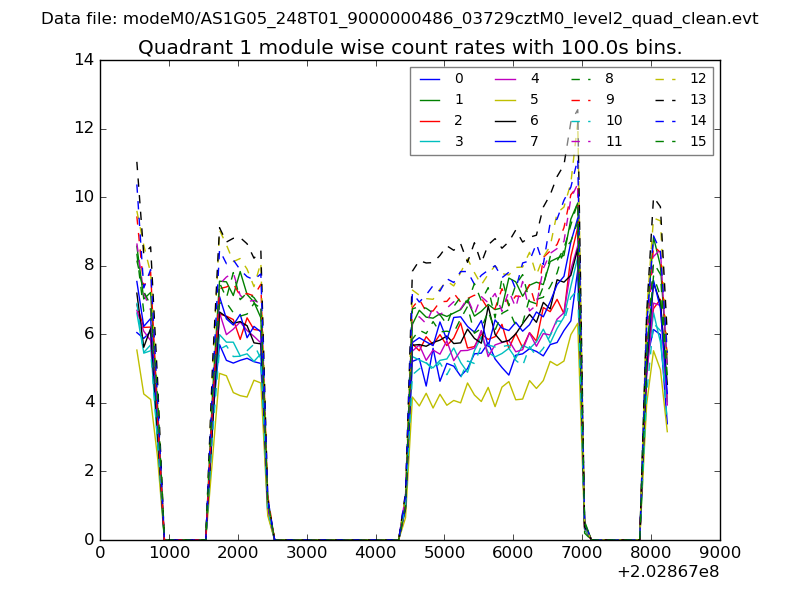
| Module-wise count rates for Quadrant A Data is divided into 100 sec bins |
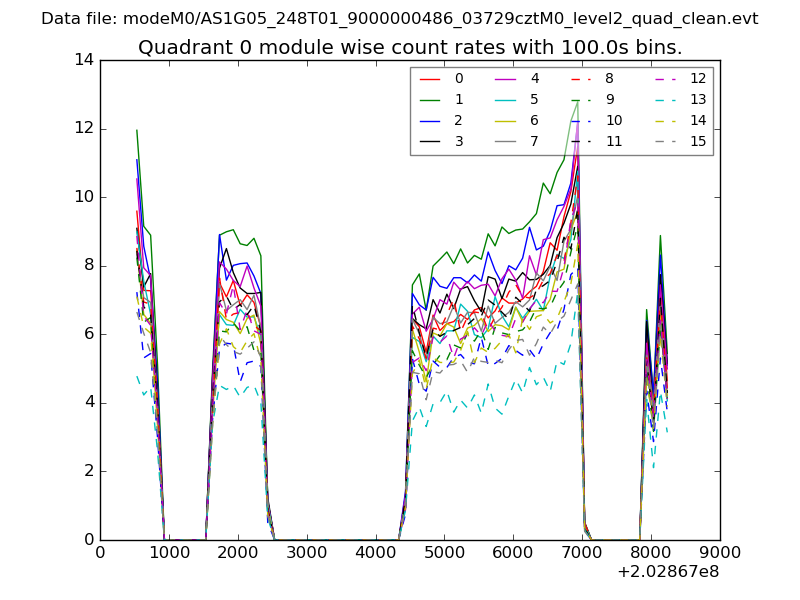 |
 |
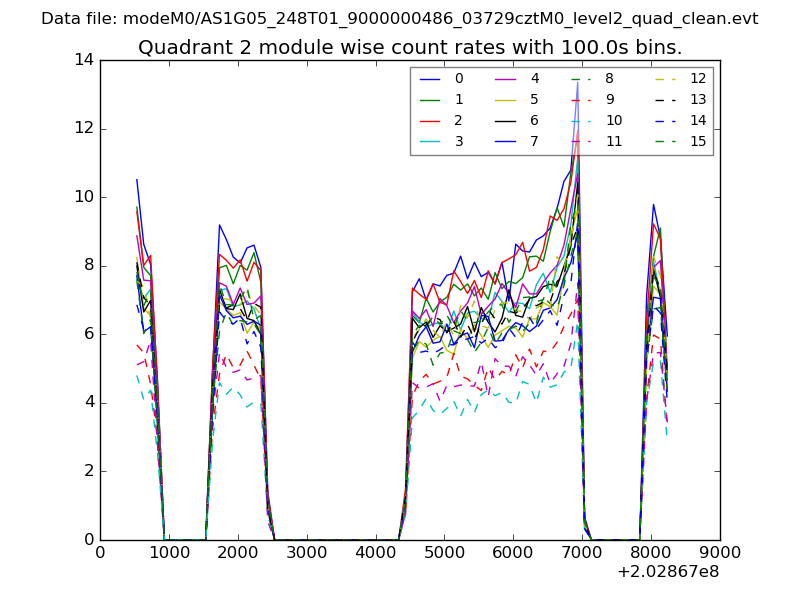
| Module-wise count rates for Quadrant B Data is divided into 100 sec bins |
 |
 |
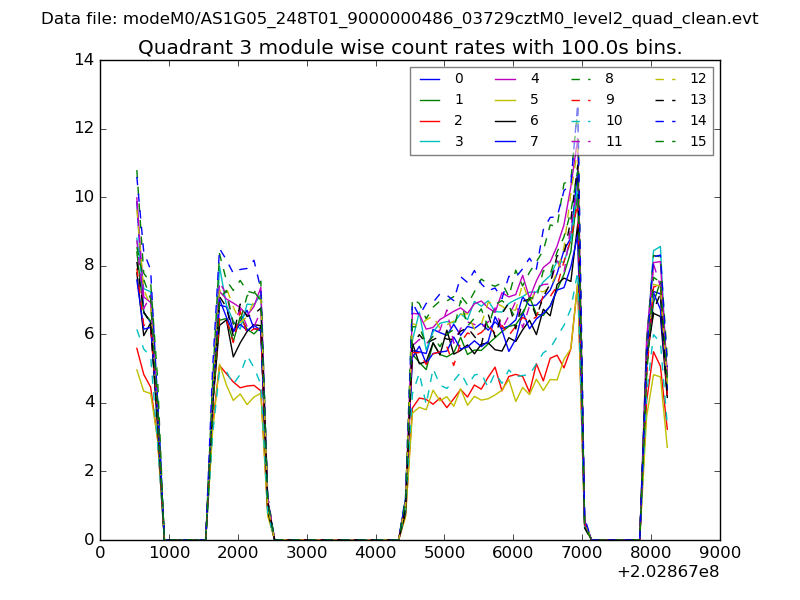
| Module-wise count rates for Quadrant C Data is divided into 100 sec bins |
 |
 |
| Module-wise count rates for Quadrant D Data is divided into 100 sec bins |
 |
 |
| Parameter | Plot |
|---|---|
| CZT HV Monitor | 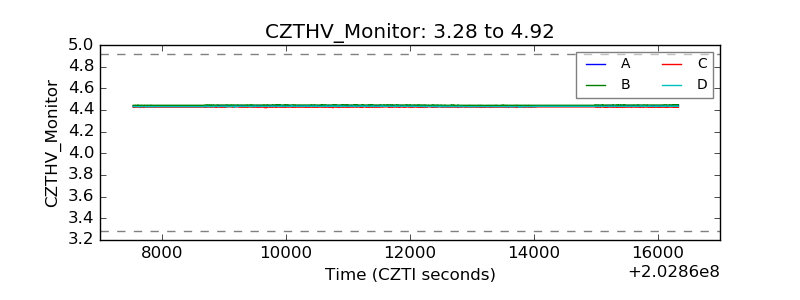 |
| D_VDD | 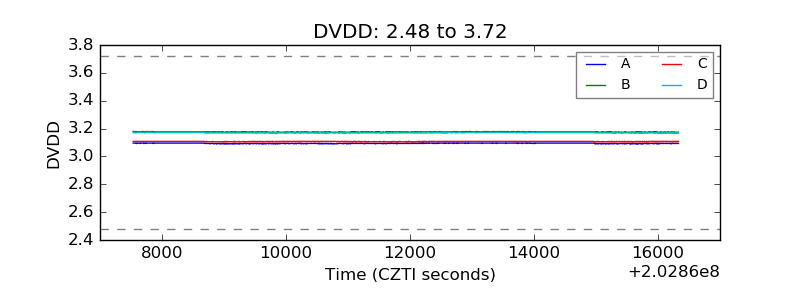 |
| Temperature 1 | 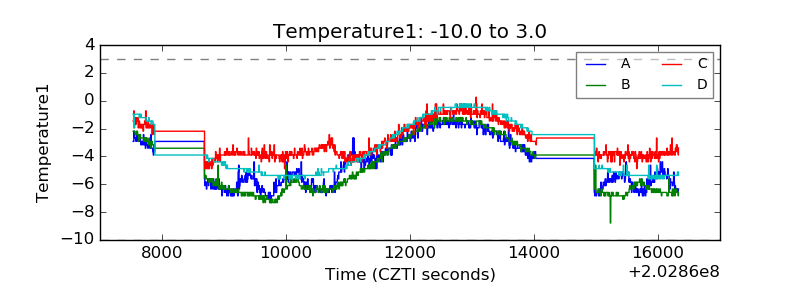 |
| Veto HV Monitor | 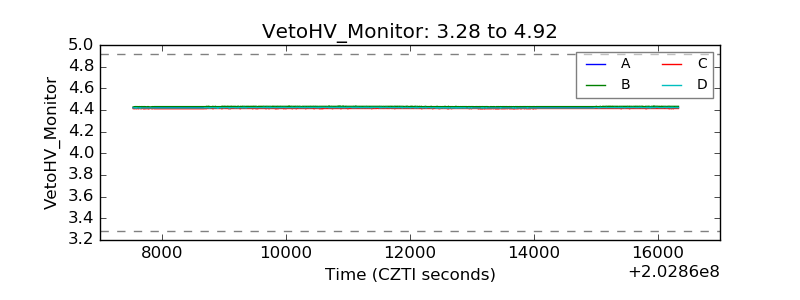 |
| Veto LLD | 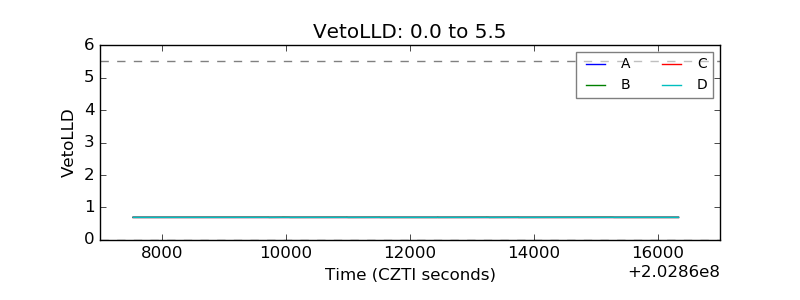 |
| Alpha Counter | 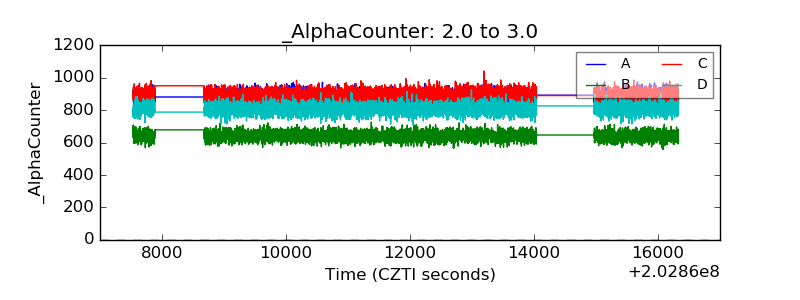 |
| _CPM_Rate | 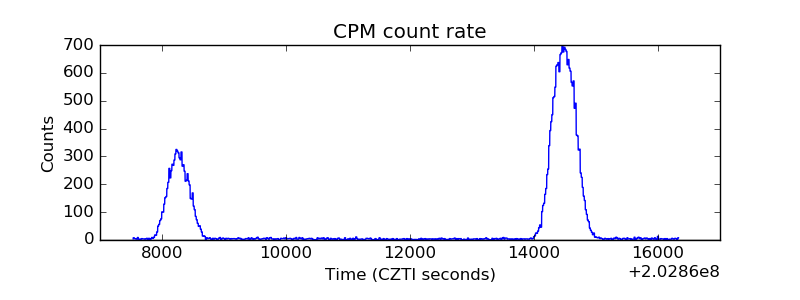 |
| CZT Counter | 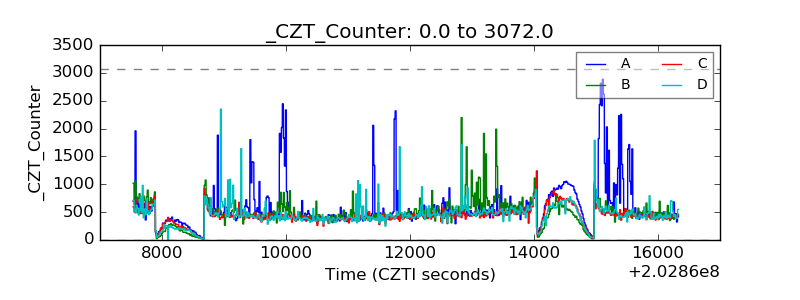 |
| +2.5 Volts monitor | 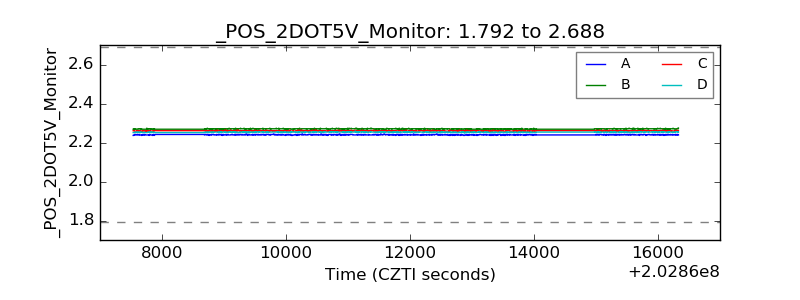 |
| +5 Volts monitor | 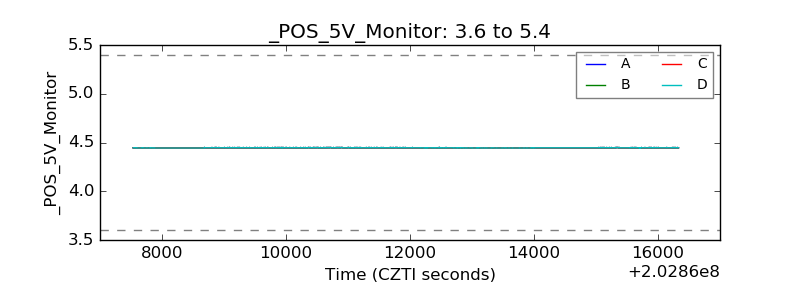 |
| Veto Counter | 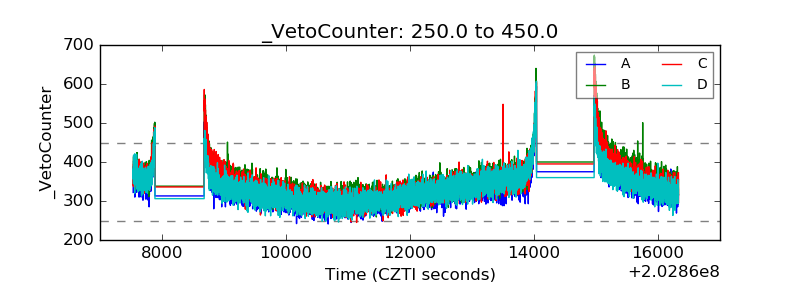 |