| Param | Original file | Final file |
|---|---|---|
| Filename | modeM0/AS1G05_248T01_9000000486_03731cztM0_level2.evt | modeM0/AS1G05_248T01_9000000486_03731cztM0_level2_quad_clean.evt |
| Size (bytes) | 476,997,120 | 57,087,360 |
| Size | 454.9 MB | 54.4 MB |
| Events in quadrant A | 3,807,884 | 326,408 |
| Events in quadrant B | 4,180,883 | 317,414 |
| Events in quadrant C | 2,939,351 | 317,668 |
| Events in quadrant D | 3,077,832 | 314,870 |
| Mode SS | |||
|---|---|---|---|
| Quadrant | BADHDUFLAG | Total packets | Discarded packets |
| A | 0 | 130 | 0 |
| B | 0 | 130 | 0 |
| C | 0 | 130 | 0 |
| D | 0 | 130 | 0 |
| Mode M9 | |||
|---|---|---|---|
| Quadrant | BADHDUFLAG | Total packets | Discarded packets |
| A | 0 | 11 | 0 |
| B | 0 | 11 | 0 |
| C | 0 | 11 | 0 |
| D | 0 | 11 | 0 |
| Mode M0 | |||
|---|---|---|---|
| Quadrant | BADHDUFLAG | Total packets | Discarded packets |
| A | 0 | 15589 | 2 |
| B | 0 | 16734 | 1 |
| C | 0 | 13357 | 1 |
| D | 0 | 13772 | 1 |
| Quadrant | Total seconds | Saturated seconds | Saturation percentage |
|---|---|---|---|
| A | 6482 | 182 | 2.807775% |
| B | 6482 | 219 | 3.378587% |
| C | 6482 | 61 | 0.941068% |
| D | 6482 | 64 | 0.987350% |
Noise dominated data is calculated using 1-second bins in cleaned event files. If a bin has >2000 counts, and if more than 50% of those come from <1% of pixels, then it is considered to be noise-dominated and hence unusable.
| Quadrant | # 1 sec bins | Bins with >0 counts | Bins with >2000 counts | High rate bins dominated by noise | Noise dominated (total time) | Noise dominated (detector-on time) | Marked lightcurve |
|---|---|---|---|---|---|---|---|
| A | 7527 | 6482 | 82 | 82 | 1.09% | 1.27% | 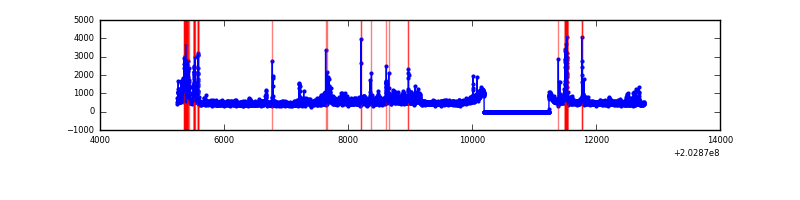 |
| B | 7527 | 6482 | 95 | 95 | 1.26% | 1.47% | 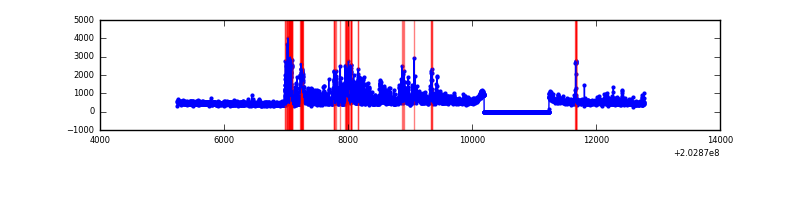 |
| C | 7527 | 6483 | 1 | 1 | 0.01% | 0.02% | 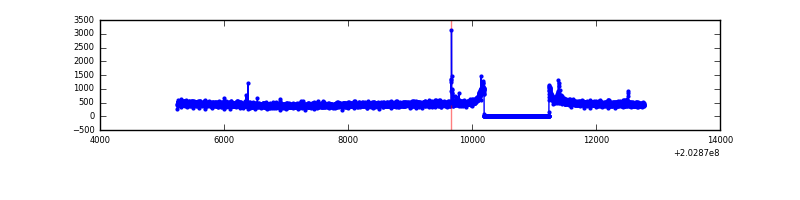 |
| D | 7527 | 6482 | 7 | 7 | 0.09% | 0.11% | 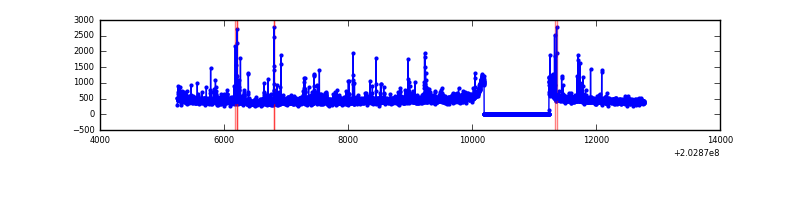 |
Top three noisy pixels from each quadrant. If the there are fewer than three noisy pixels in the level2.evt file, extra rows are filled as -1
| Pixel properties | Quadrant properties | ||||||
|---|---|---|---|---|---|---|---|
| Quadrant | DetID | PixID | Counts | Sigma | Mean | Median | Sigma |
| A | 8 | 15 | 334161 | 2104.05 | 768 | 750 | 158.5 |
| A | 0 | 118 | 256661 | 1614.97 | 768 | 750 | 158.5 |
| A | 13 | 251 | 159029 | 998.85 | 768 | 750 | 158.5 |
| B | 0 | 173 | 721829 | 4804.9 | 774 | 754 | 150.1 |
| B | 15 | 204 | 241968 | 1607.34 | 774 | 754 | 150.1 |
| B | 4 | 81 | 103098 | 681.97 | 774 | 754 | 150.1 |
| C | 12 | 4 | 29678 | 167.62 | 743 | 746 | 172.6 |
| C | 13 | 61 | 6196 | 31.57 | 743 | 746 | 172.6 |
| C | 2 | 53 | 3959 | 18.61 | 743 | 746 | 172.6 |
| D | 13 | 239 | 55925 | 306.96 | 743 | 721 | 179.8 |
| D | 2 | 37 | 46186 | 252.8 | 743 | 721 | 179.8 |
| D | 2 | 232 | 35120 | 191.27 | 743 | 721 | 179.8 |
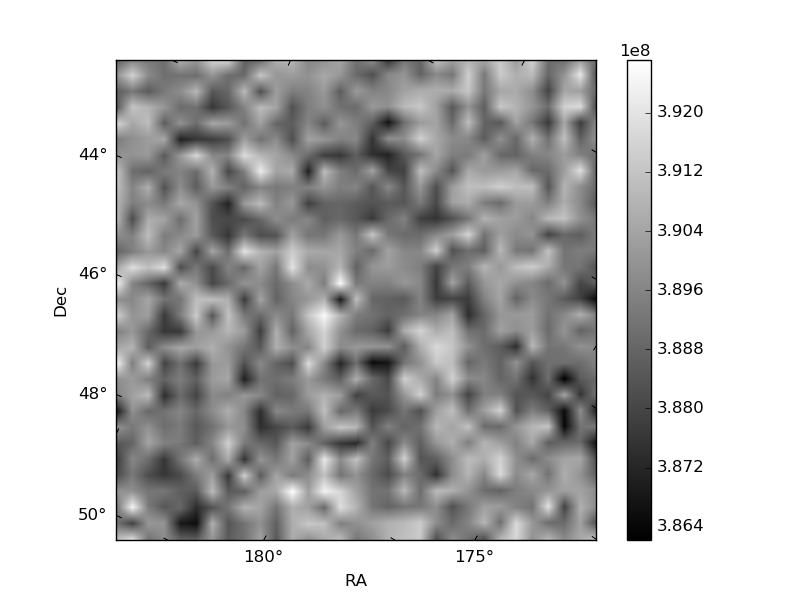
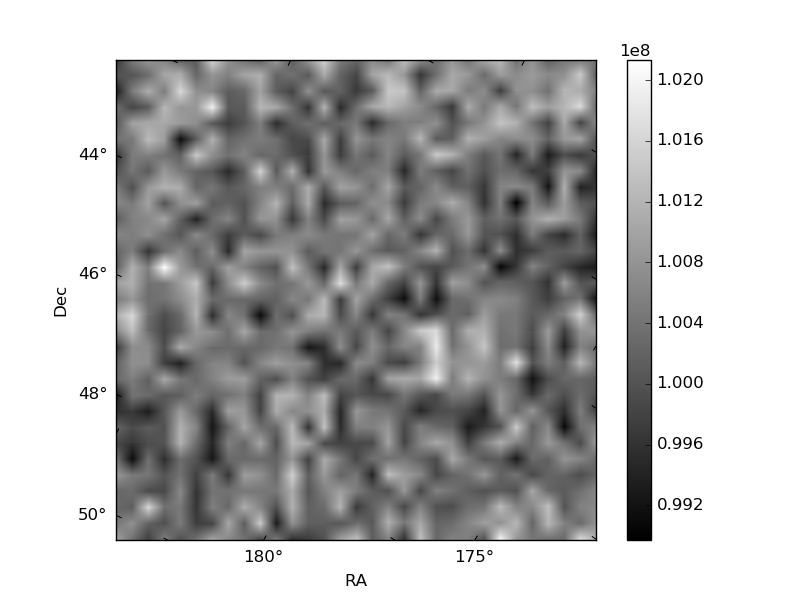
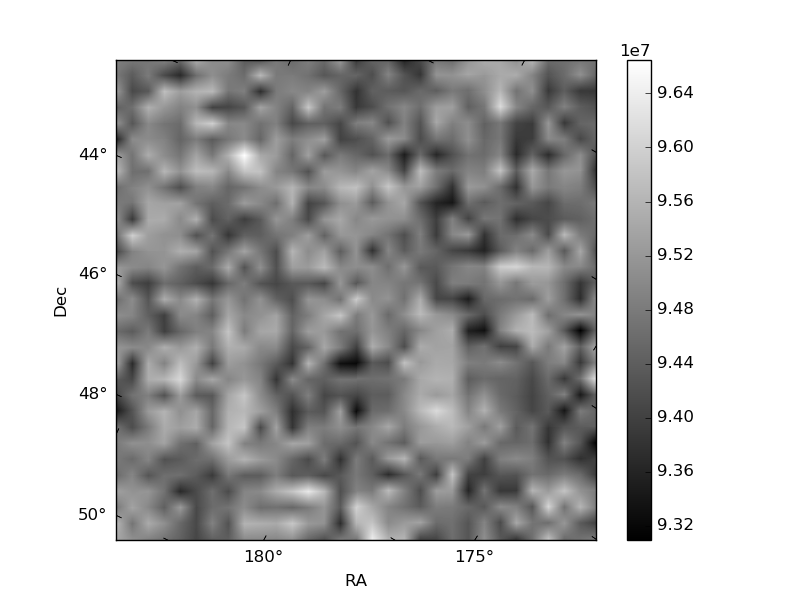
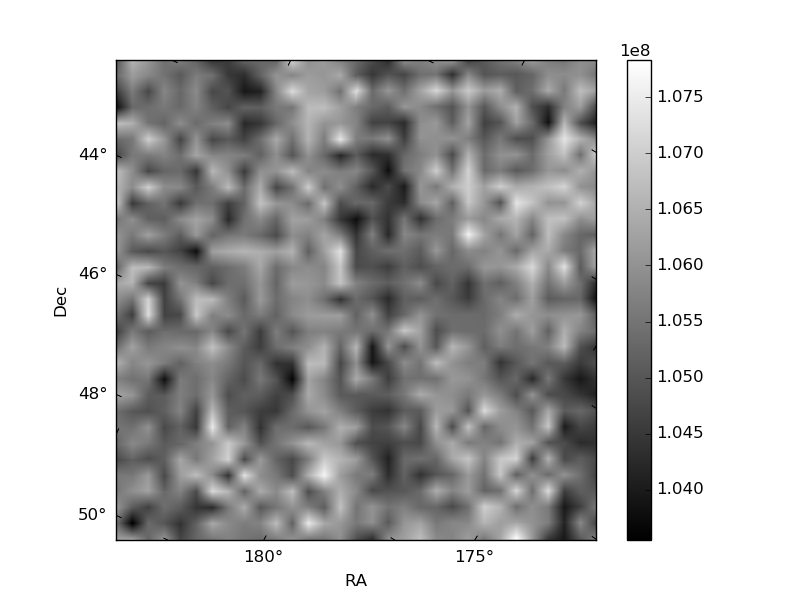
Histogram calculated using DETX and DETY for each event in the final _common_clean file
| Quadrant A | 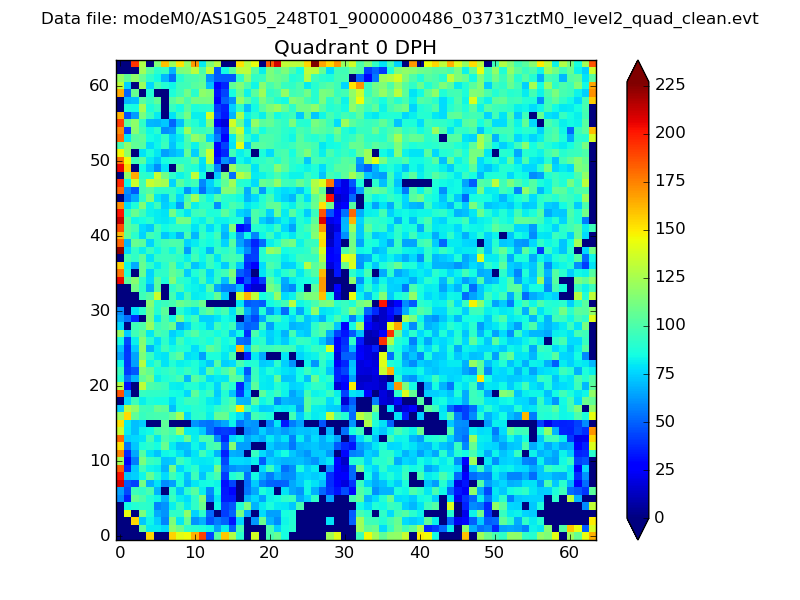 |
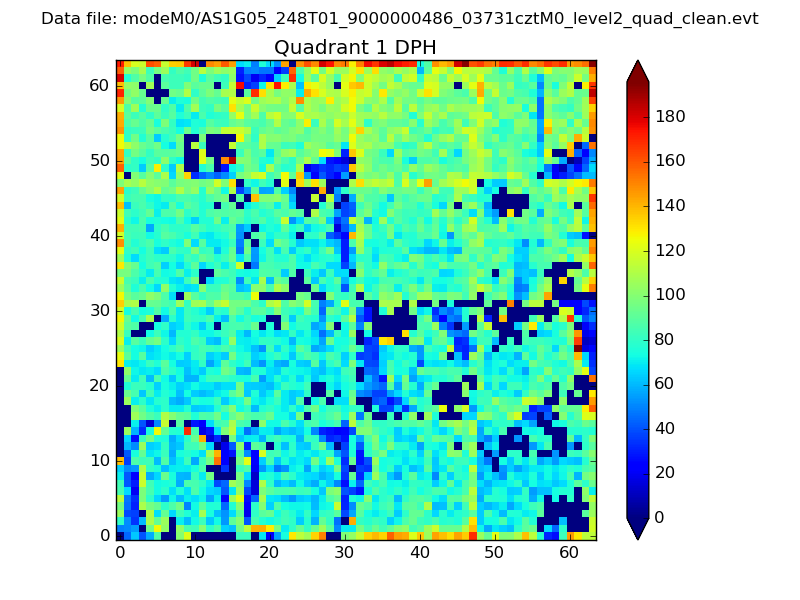 |
Quadrant B |
|---|---|---|---|
| Quadrant D | 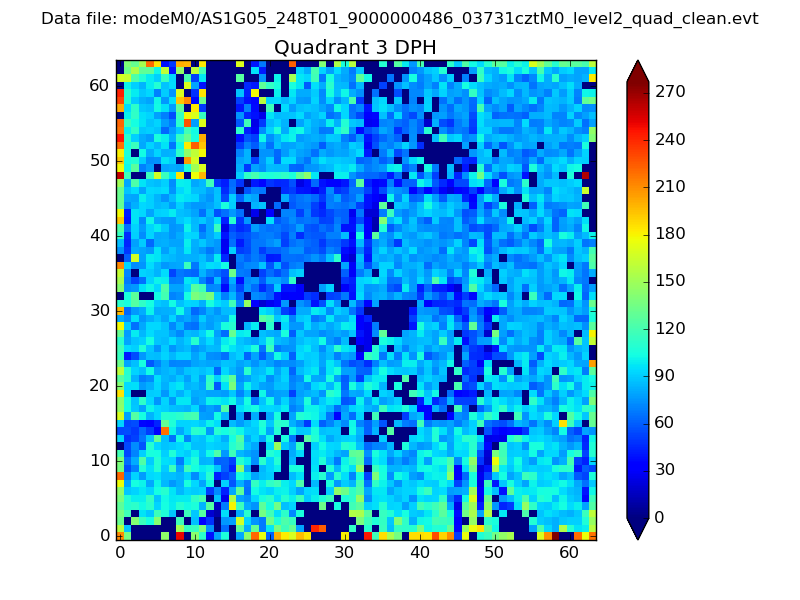 |
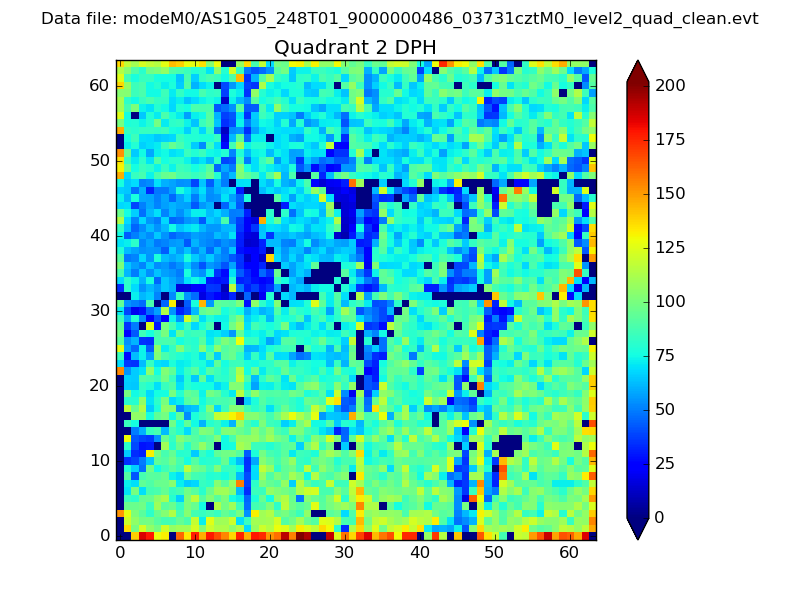 |
Quadrant C |
| Plot type | Count rate plots | Images |
|---|---|---|
| Comparison with Poisson distribution Blue bars denote a histogram of data divided into 1 sec bins. Red curve is a Poisson curve with rate = median count rate of data. |
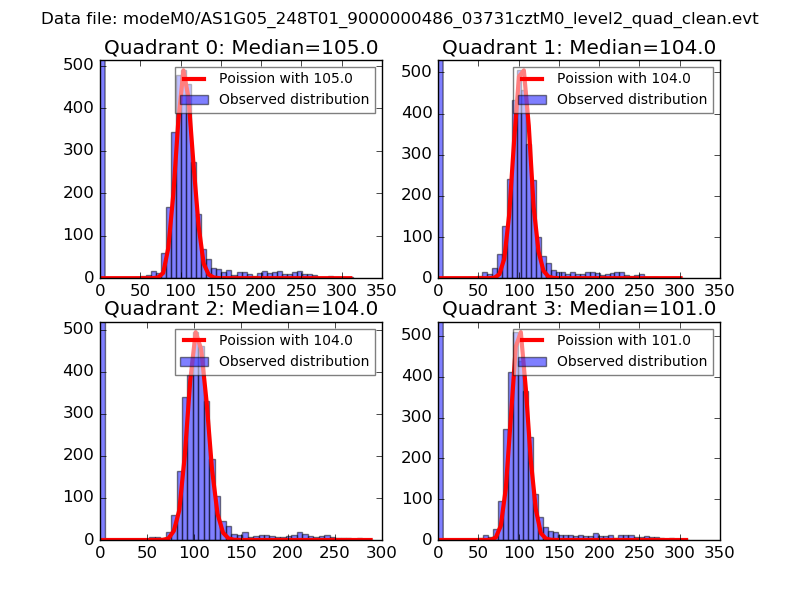 |
 |
| Quadrant-wise count rates Data is divided into 100 sec bins |
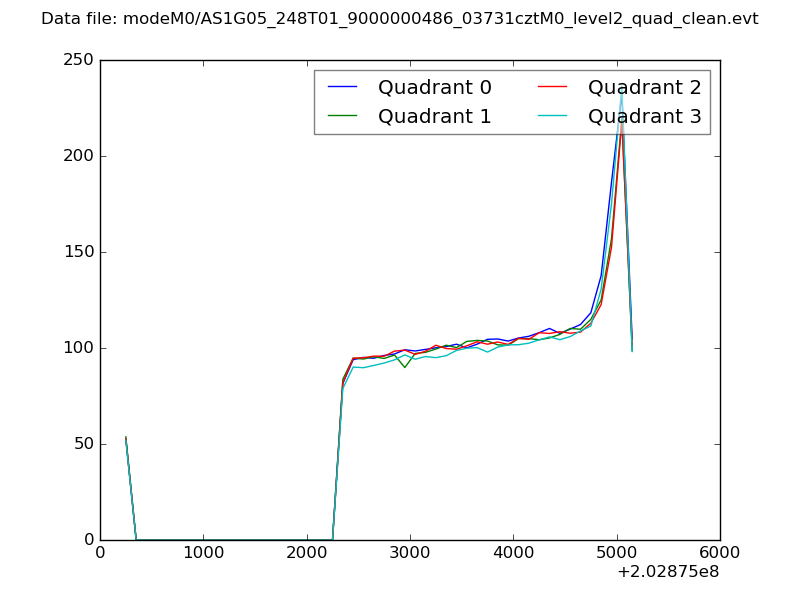 |
|
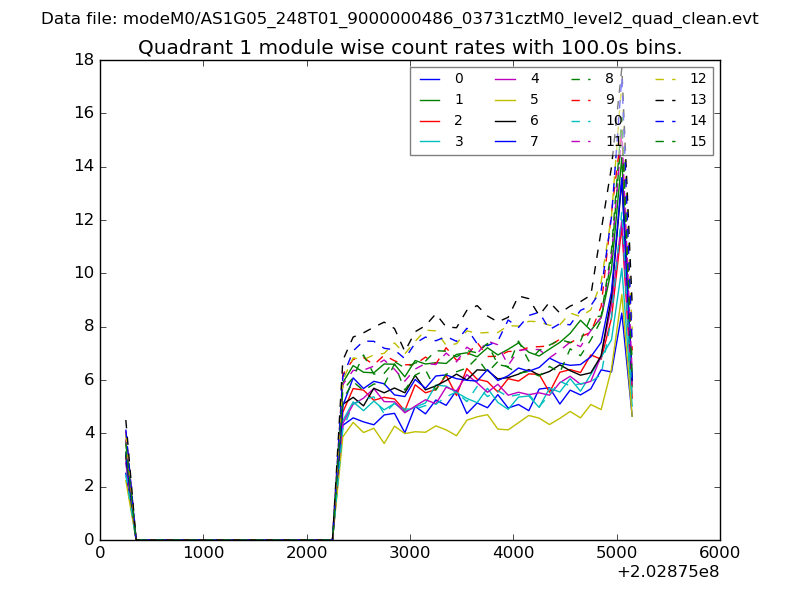
| Module-wise count rates for Quadrant A Data is divided into 100 sec bins |
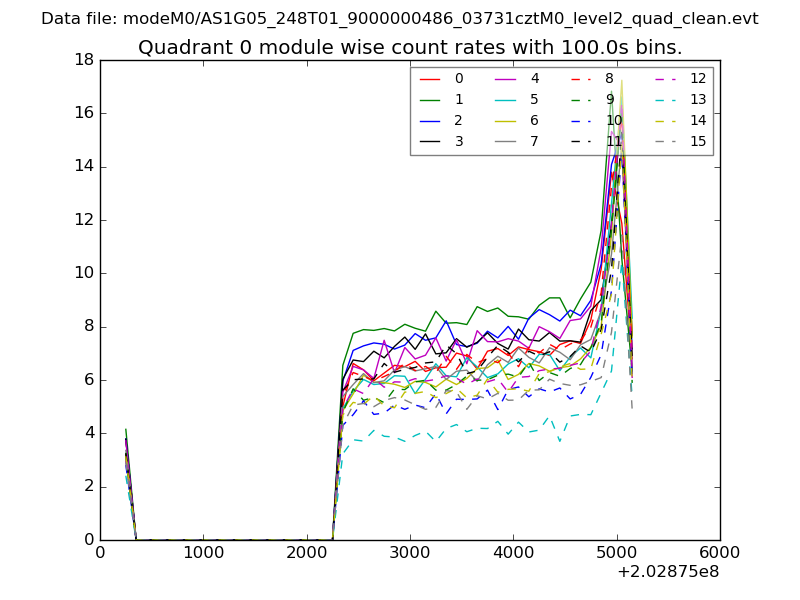 |
 |
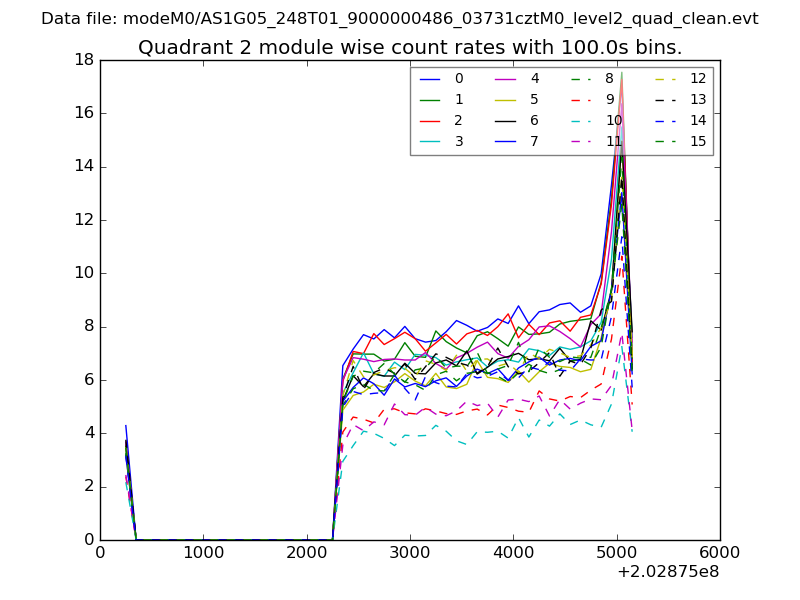
| Module-wise count rates for Quadrant B Data is divided into 100 sec bins |
 |
 |
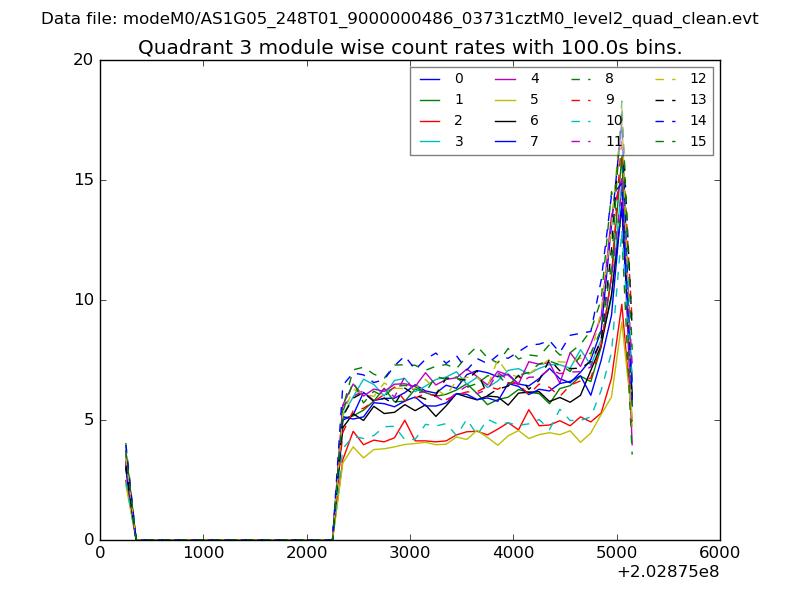
| Module-wise count rates for Quadrant C Data is divided into 100 sec bins |
 |
 |
| Module-wise count rates for Quadrant D Data is divided into 100 sec bins |
 |
 |
| Parameter | Plot |
|---|---|
| CZT HV Monitor | 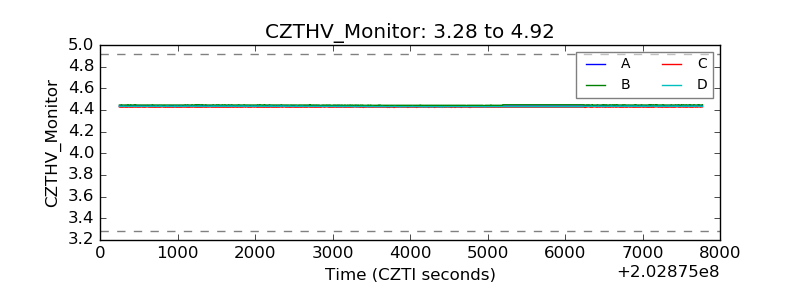 |
| D_VDD | 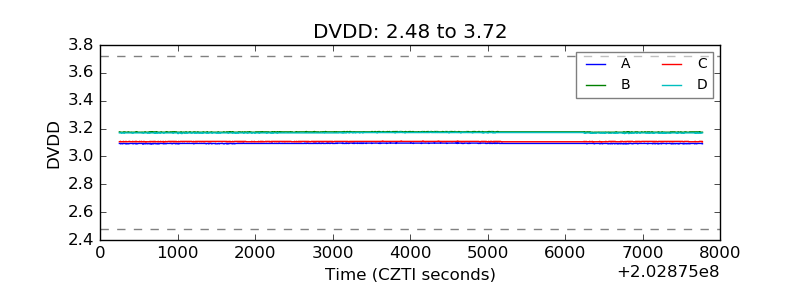 |
| Temperature 1 | 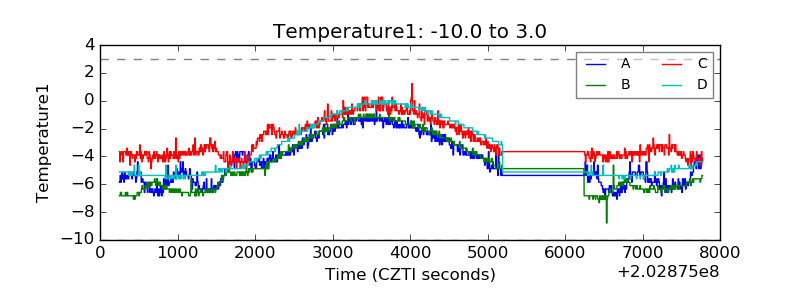 |
| Veto HV Monitor | 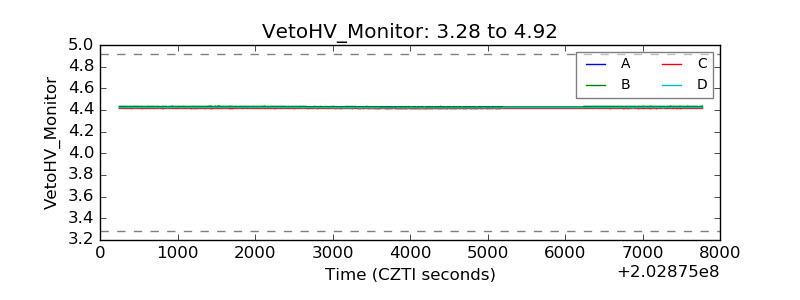 |
| Veto LLD | 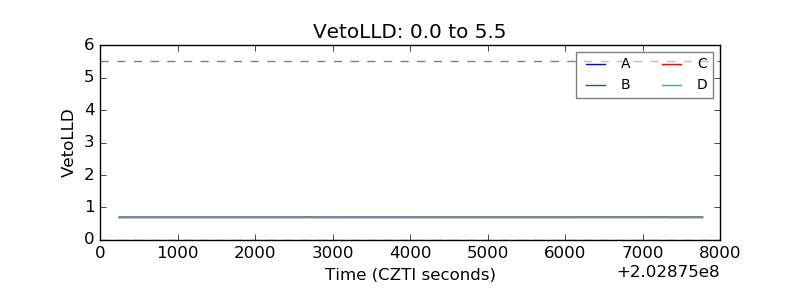 |
| Alpha Counter | 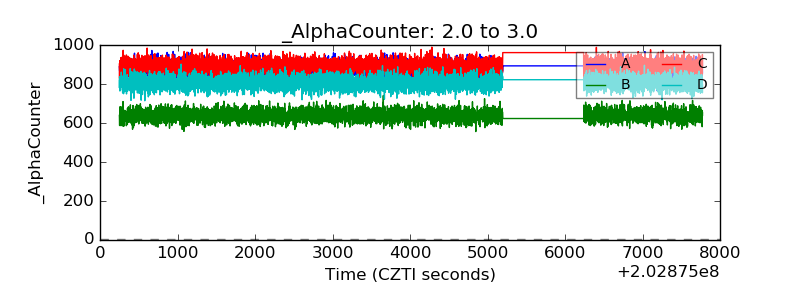 |
| _CPM_Rate | 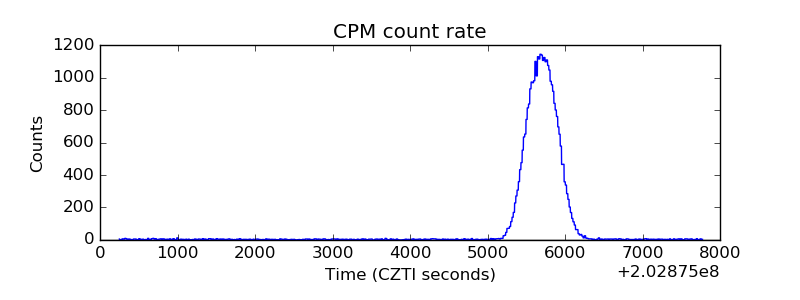 |
| CZT Counter | 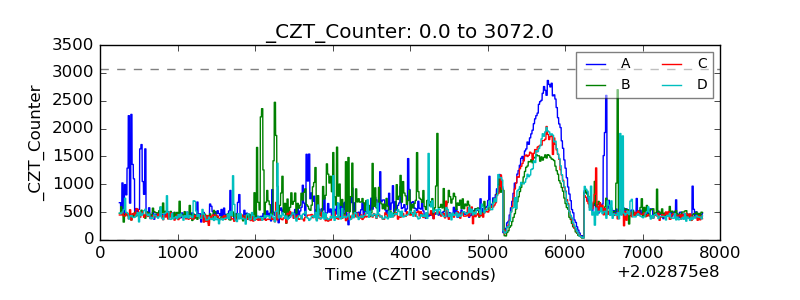 |
| +2.5 Volts monitor |  |
| +5 Volts monitor |  |
| Veto Counter | 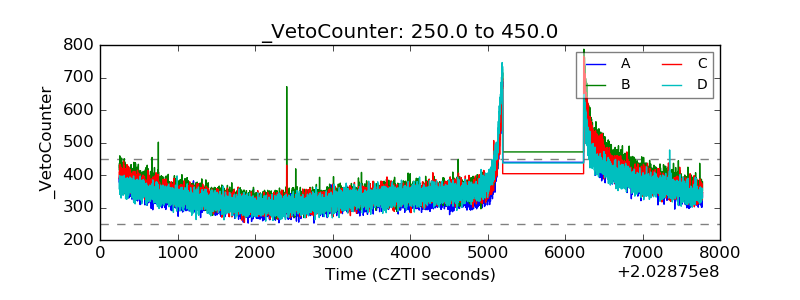 |