| Param | Original file | Final file |
|---|---|---|
| Filename | modeM0/AS1G05_248T01_9000000486_03732cztM0_level2.evt | modeM0/AS1G05_248T01_9000000486_03732cztM0_level2_quad_clean.evt |
| Size (bytes) | 478,558,080 | 57,844,800 |
| Size | 456.4 MB | 55.2 MB |
| Events in quadrant A | 4,360,165 | 307,158 |
| Events in quadrant B | 3,600,884 | 337,504 |
| Events in quadrant C | 2,970,968 | 333,857 |
| Events in quadrant D | 3,126,633 | 326,364 |
| Mode SS | |||
|---|---|---|---|
| Quadrant | BADHDUFLAG | Total packets | Discarded packets |
| A | 0 | 128 | 0 |
| B | 0 | 128 | 0 |
| C | 0 | 128 | 0 |
| D | 0 | 128 | 0 |
| Mode M9 | |||
|---|---|---|---|
| Quadrant | BADHDUFLAG | Total packets | Discarded packets |
| A | 0 | 16 | 0 |
| B | 0 | 16 | 0 |
| C | 0 | 16 | 0 |
| D | 0 | 17 | 0 |
| Mode M0 | |||
|---|---|---|---|
| Quadrant | BADHDUFLAG | Total packets | Discarded packets |
| A | 0 | 17162 | 3 |
| B | 0 | 14797 | 2 |
| C | 0 | 13236 | 2 |
| D | 0 | 13786 | 2 |
| Quadrant | Total seconds | Saturated seconds | Saturation percentage |
|---|---|---|---|
| A | 6399 | 512 | 8.001250% |
| B | 6399 | 125 | 1.953430% |
| C | 6399 | 56 | 0.875137% |
| D | 6399 | 75 | 1.172058% |
Noise dominated data is calculated using 1-second bins in cleaned event files. If a bin has >2000 counts, and if more than 50% of those come from <1% of pixels, then it is considered to be noise-dominated and hence unusable.
| Quadrant | # 1 sec bins | Bins with >0 counts | Bins with >2000 counts | High rate bins dominated by noise | Noise dominated (total time) | Noise dominated (detector-on time) | Marked lightcurve |
|---|---|---|---|---|---|---|---|
| A | 7544 | 6400 | 364 | 364 | 4.83% | 5.69% | 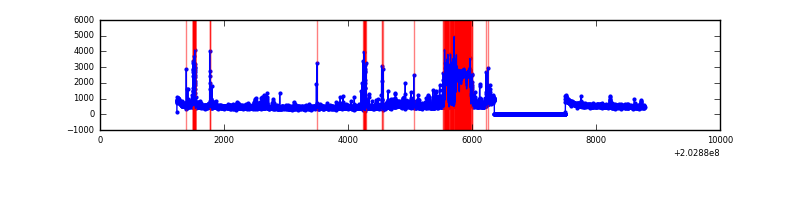 |
| B | 7544 | 6399 | 33 | 33 | 0.44% | 0.52% | 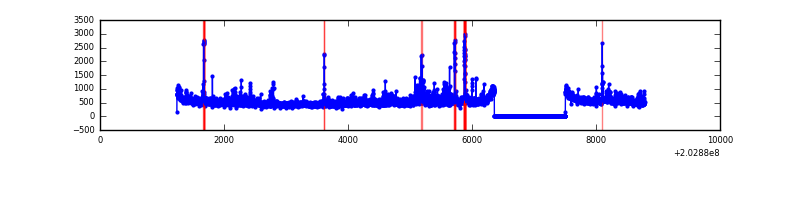 |
| C | 7544 | 6400 | 0 | 0 | 0.00% | 0.00% | 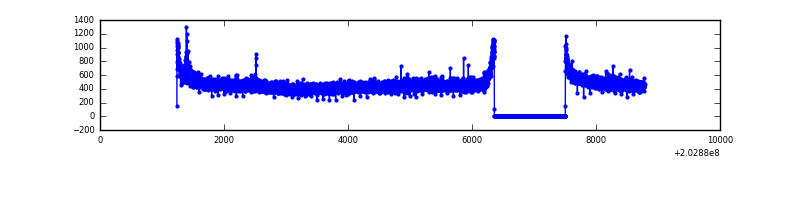 |
| D | 7544 | 6400 | 20 | 20 | 0.27% | 0.31% | 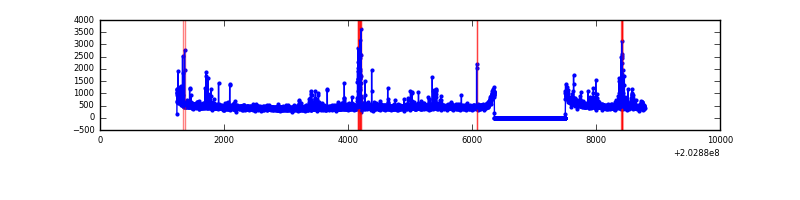 |
Top three noisy pixels from each quadrant. If the there are fewer than three noisy pixels in the level2.evt file, extra rows are filled as -1
| Pixel properties | Quadrant properties | ||||||
|---|---|---|---|---|---|---|---|
| Quadrant | DetID | PixID | Counts | Sigma | Mean | Median | Sigma |
| A | 13 | 251 | 1095572 | 7111.97 | 757 | 742 | 153.9 |
| A | 8 | 15 | 201049 | 1301.19 | 757 | 742 | 153.9 |
| A | 15 | 174 | 72687 | 467.35 | 757 | 742 | 153.9 |
| B | 4 | 81 | 187573 | 1225.34 | 795 | 775 | 152.4 |
| B | 15 | 204 | 148904 | 971.68 | 795 | 775 | 152.4 |
| B | 3 | 0 | 62749 | 406.53 | 795 | 775 | 152.4 |
| C | 12 | 4 | 18342 | 100.0 | 755 | 759 | 175.8 |
| C | 13 | 61 | 6234 | 31.14 | 755 | 759 | 175.8 |
| C | 1 | 16 | 2425 | 9.47 | 755 | 759 | 175.8 |
| D | 13 | 239 | 58902 | 318.26 | 757 | 735 | 182.8 |
| D | 2 | 33 | 51855 | 279.7 | 757 | 735 | 182.8 |
| D | 14 | 34 | 46669 | 251.33 | 757 | 735 | 182.8 |
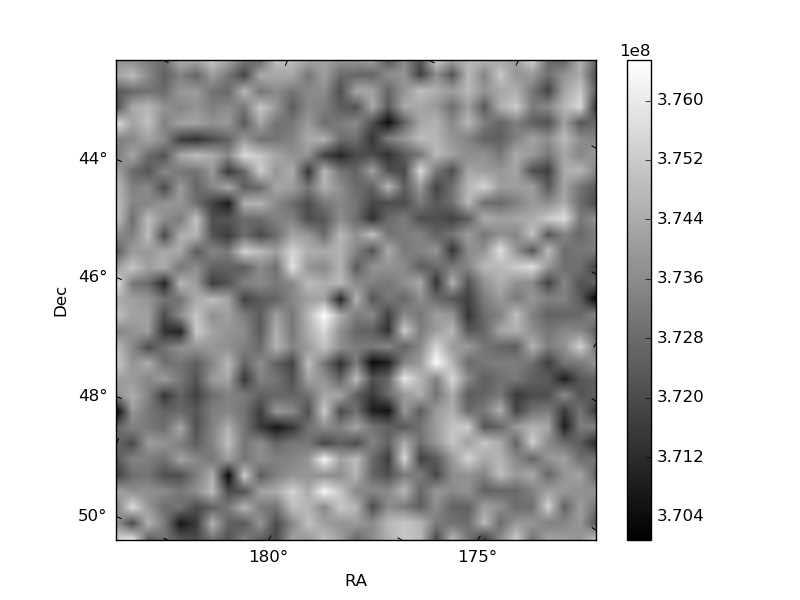
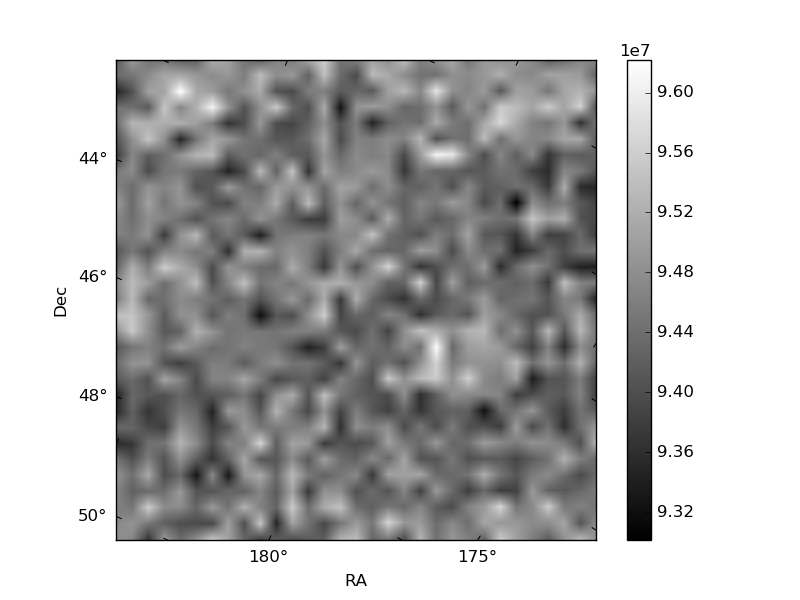
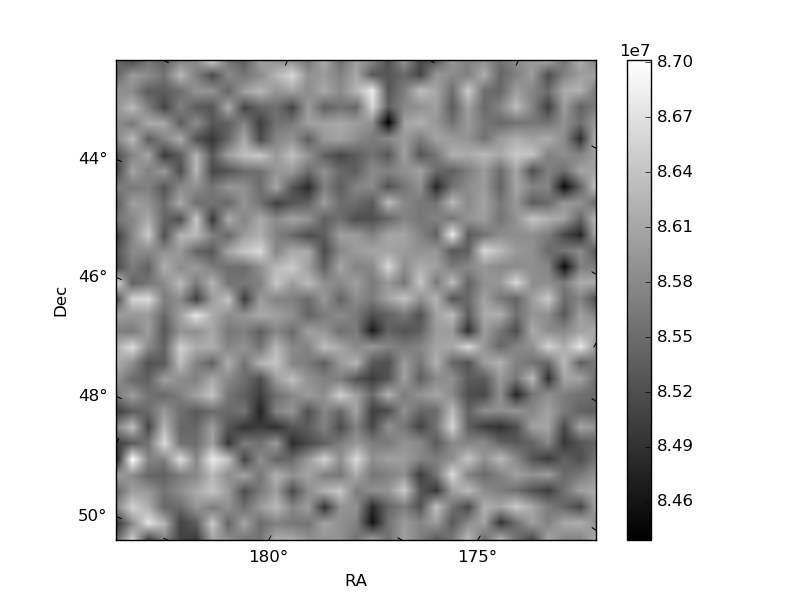
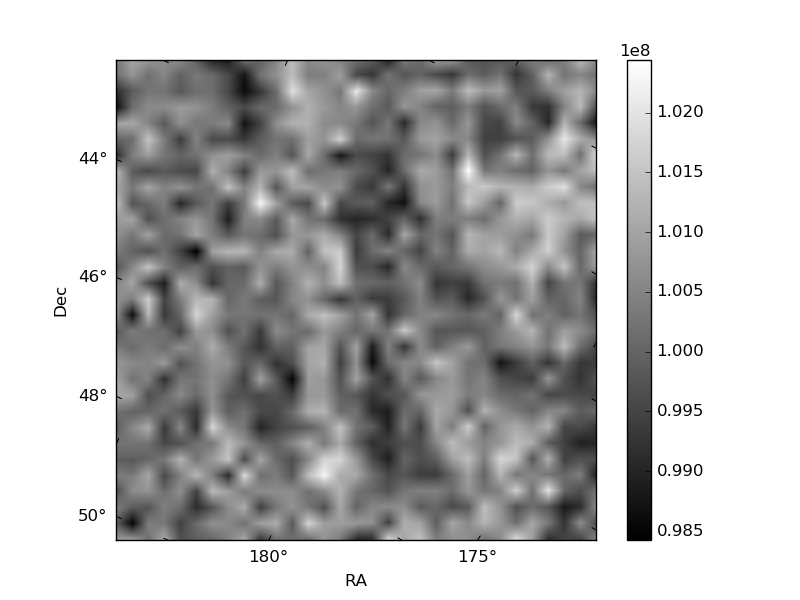
Histogram calculated using DETX and DETY for each event in the final _common_clean file
| Quadrant A | 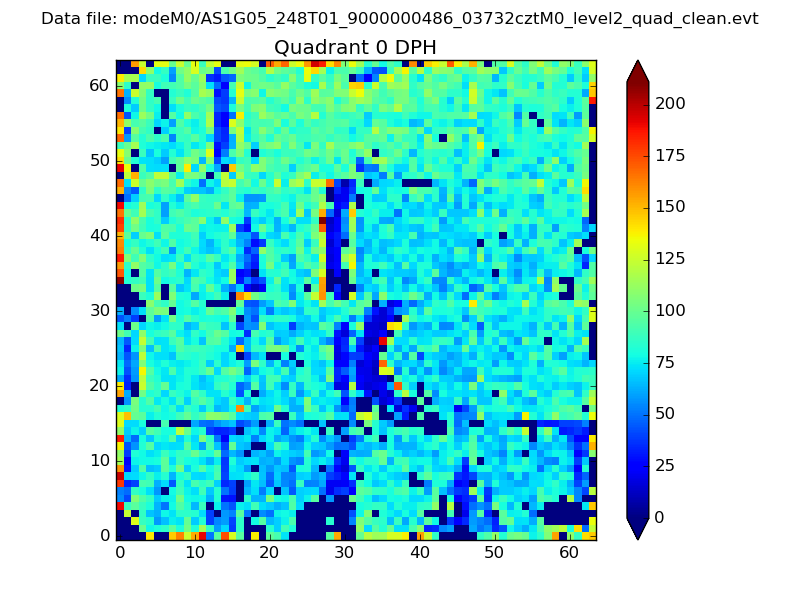 |
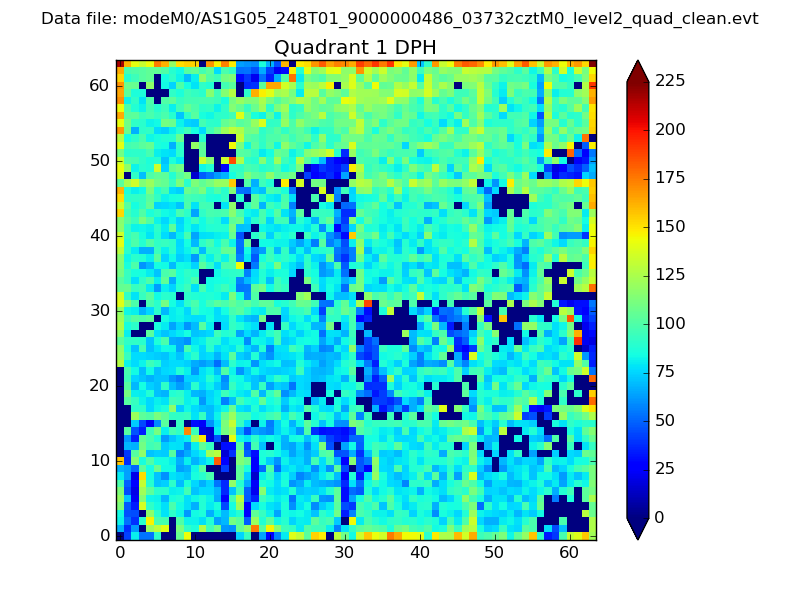 |
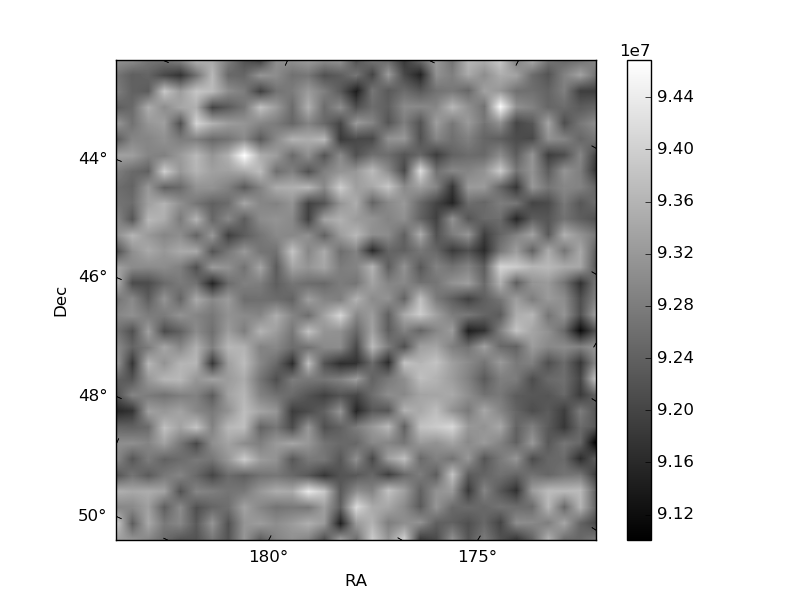
Quadrant B |
|---|---|---|---|
| Quadrant D | 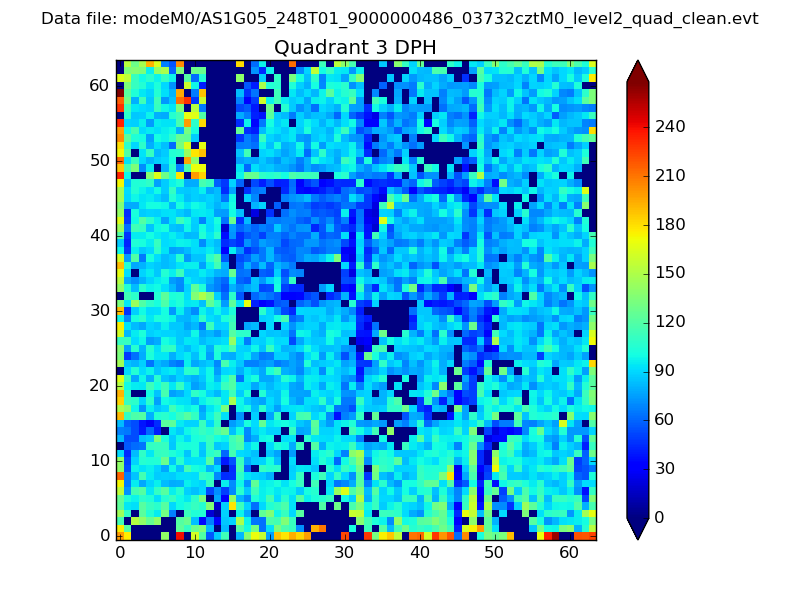 |
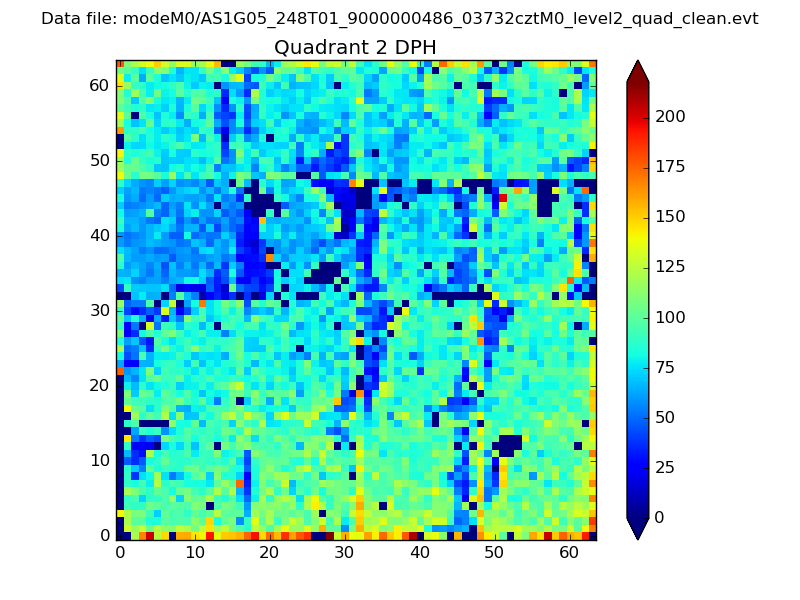 |
Quadrant C |
| Plot type | Count rate plots | Images |
|---|---|---|
| Comparison with Poisson distribution Blue bars denote a histogram of data divided into 1 sec bins. Red curve is a Poisson curve with rate = median count rate of data. |
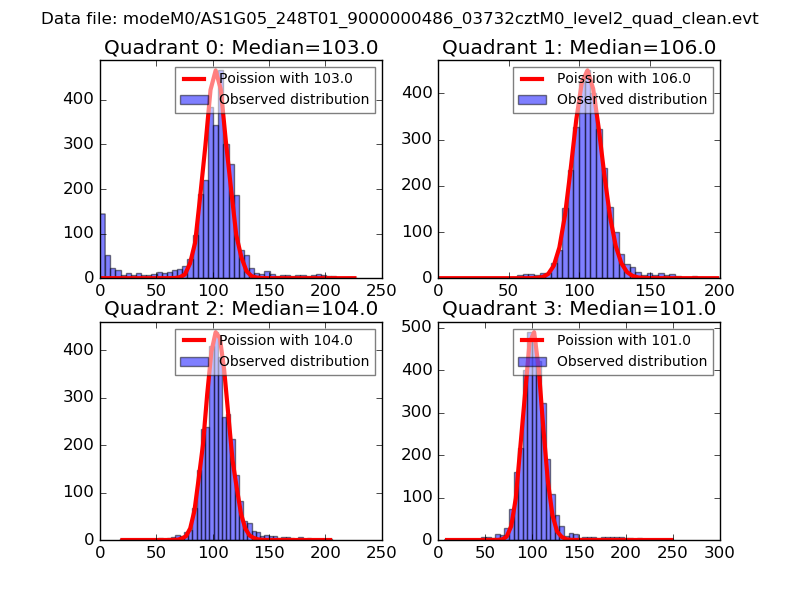 |
 |
| Quadrant-wise count rates Data is divided into 100 sec bins |
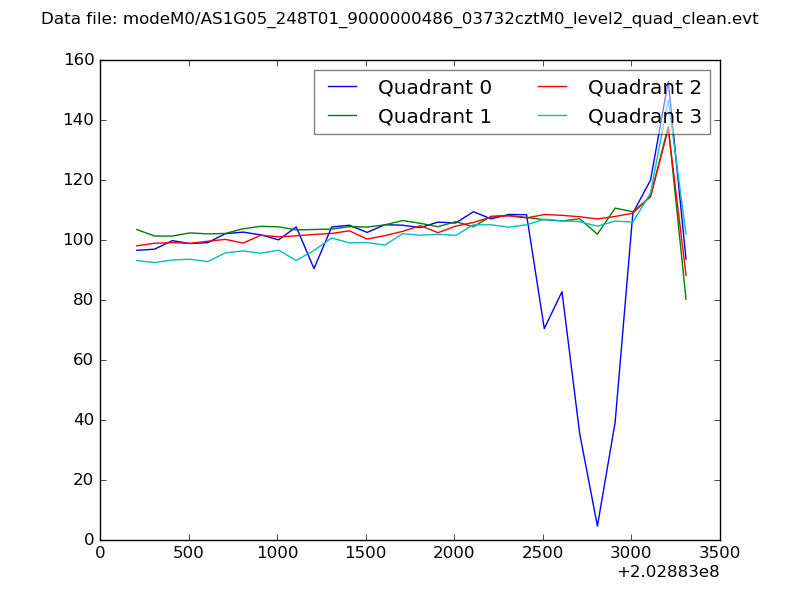 |
|
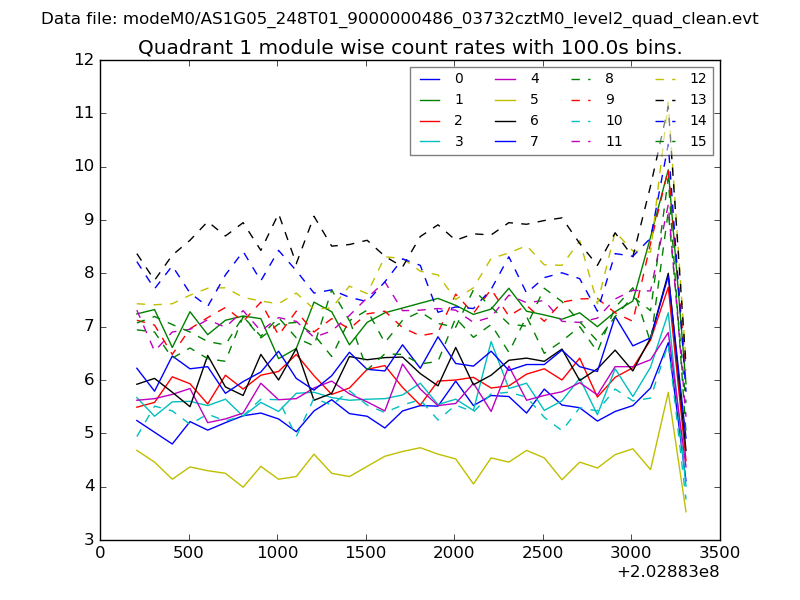
| Module-wise count rates for Quadrant A Data is divided into 100 sec bins |
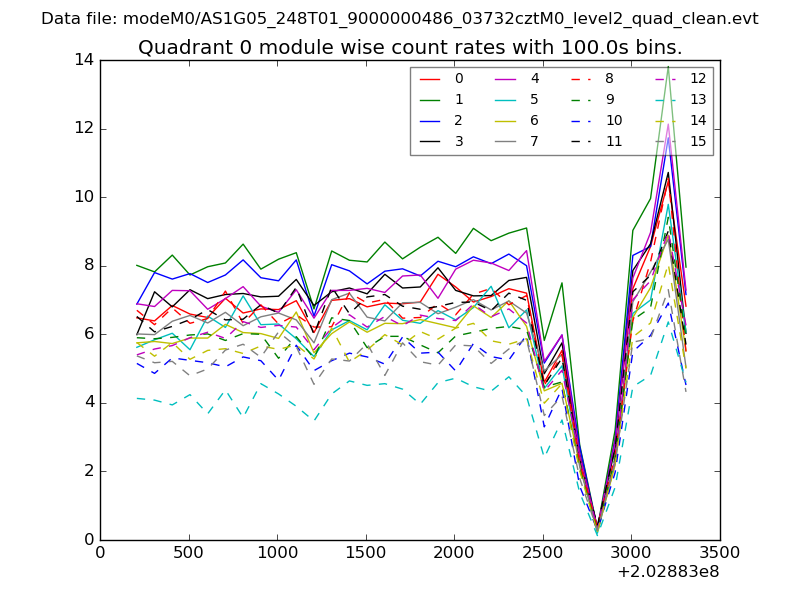 |
 |
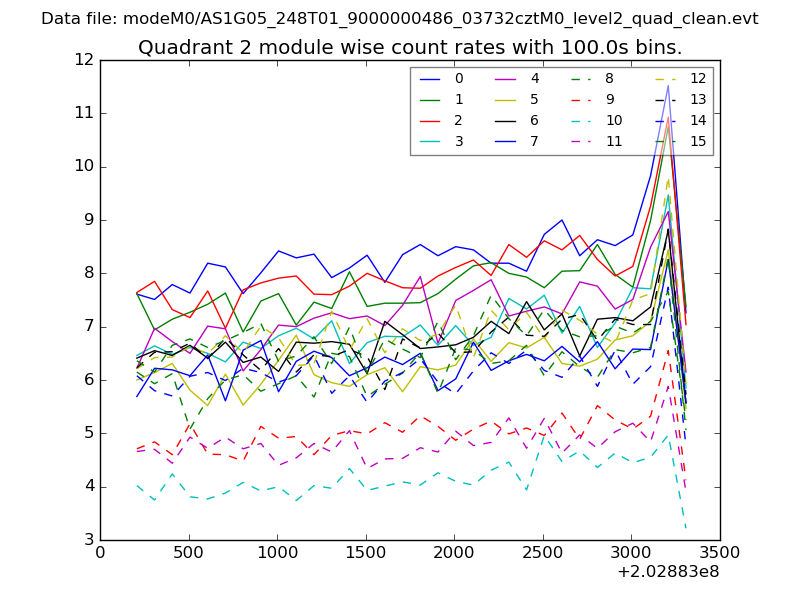
| Module-wise count rates for Quadrant B Data is divided into 100 sec bins |
 |
 |
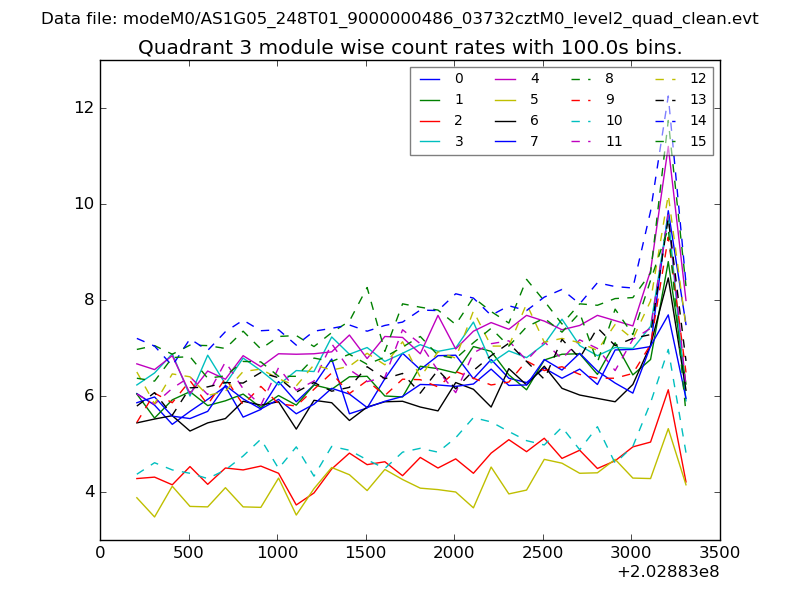
| Module-wise count rates for Quadrant C Data is divided into 100 sec bins |
 |
 |
| Module-wise count rates for Quadrant D Data is divided into 100 sec bins |
 |
 |
| Parameter | Plot |
|---|---|
| CZT HV Monitor | 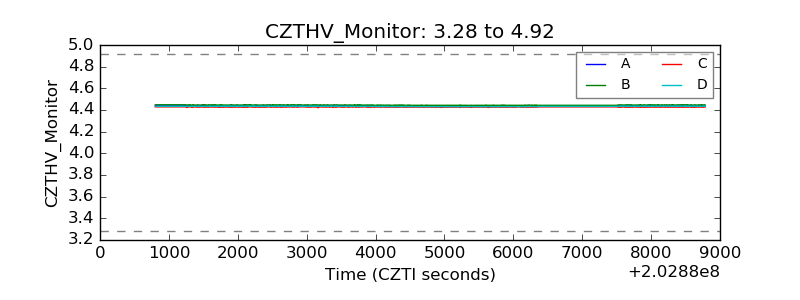 |
| D_VDD | 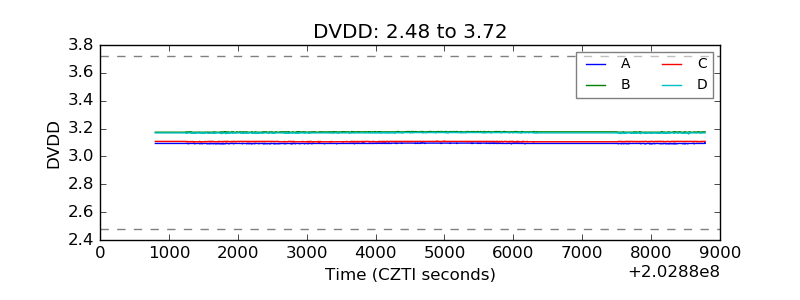 |
| Temperature 1 | 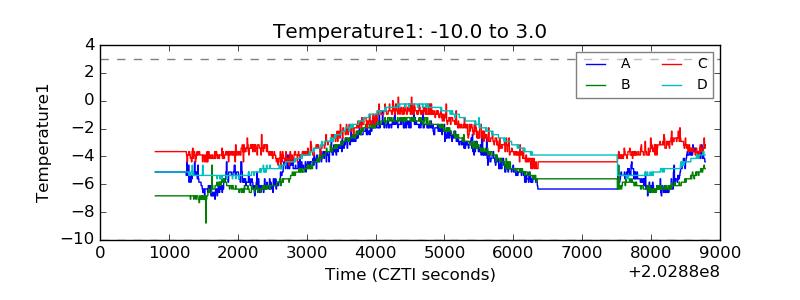 |
| Veto HV Monitor | 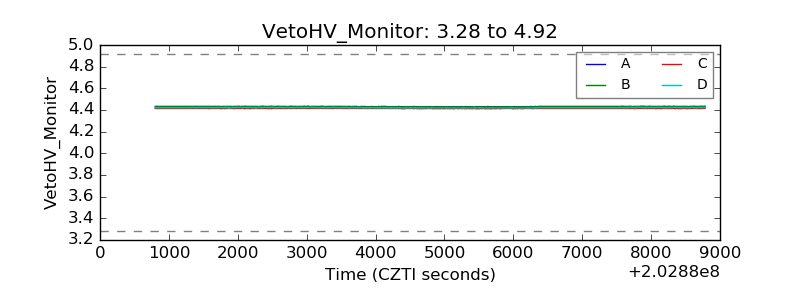 |
| Veto LLD | 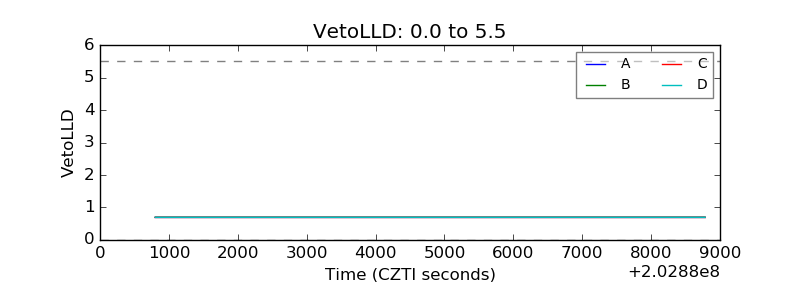 |
| Alpha Counter | 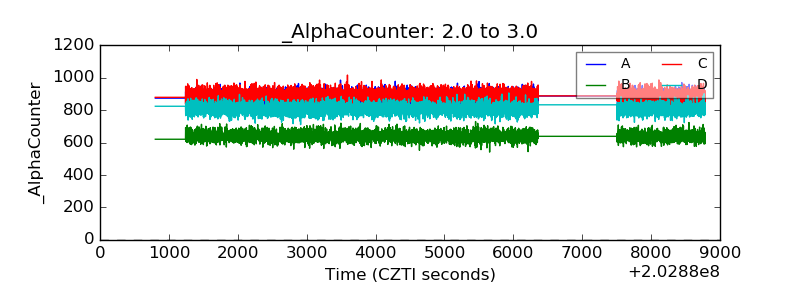 |
| _CPM_Rate | 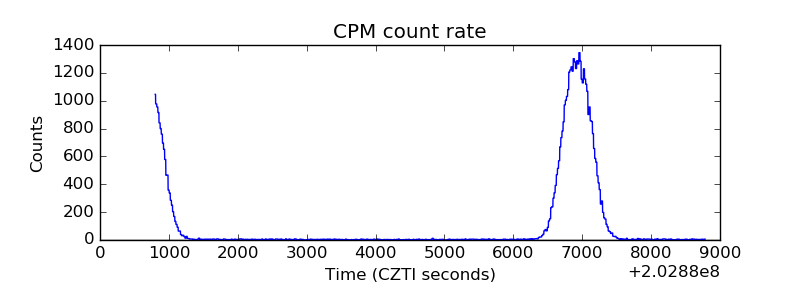 |
| CZT Counter | 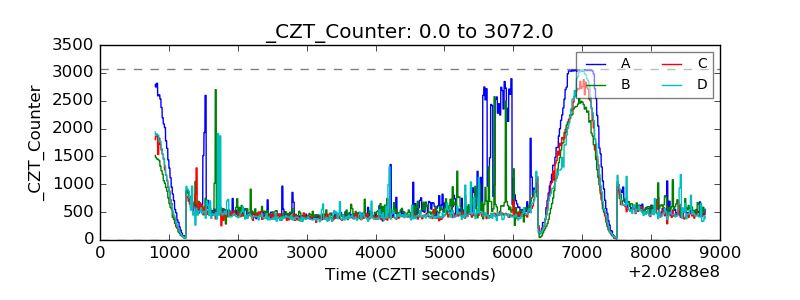 |
| +2.5 Volts monitor | 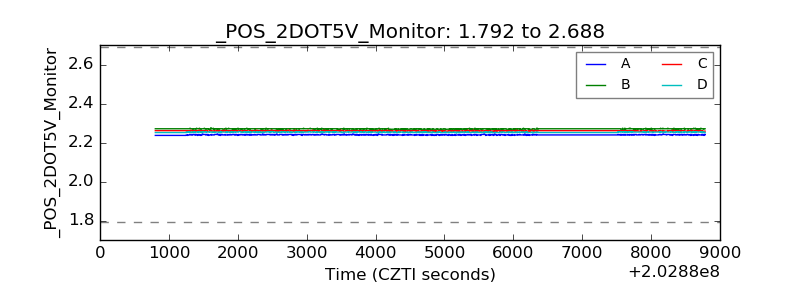 |
| +5 Volts monitor | 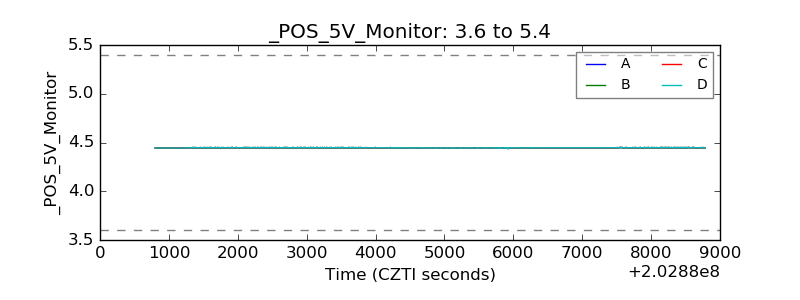 |
| Veto Counter | 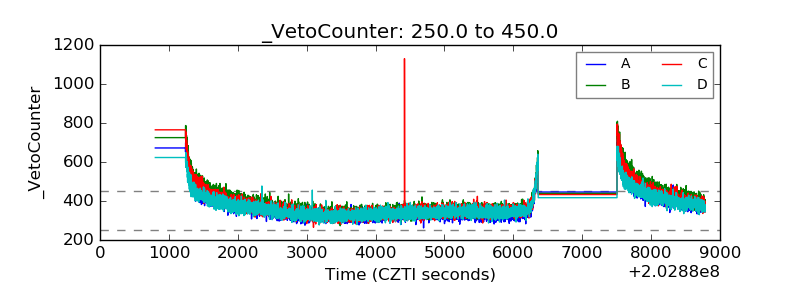 |