| Param | Original file | Final file |
|---|---|---|
| Filename | modeM0/AS1G05_248T01_9000000486_03733cztM0_level2.evt | modeM0/AS1G05_248T01_9000000486_03733cztM0_level2_quad_clean.evt |
| Size (bytes) | 487,465,920 | 66,824,640 |
| Size | 464.9 MB | 63.7 MB |
| Events in quadrant A | 3,859,544 | 394,835 |
| Events in quadrant B | 4,372,126 | 402,103 |
| Events in quadrant C | 2,986,083 | 398,742 |
| Events in quadrant D | 3,115,973 | 386,113 |
| Mode SS | |||
|---|---|---|---|
| Quadrant | BADHDUFLAG | Total packets | Discarded packets |
| A | 0 | 128 | 0 |
| B | 0 | 128 | 0 |
| C | 0 | 128 | 0 |
| D | 0 | 128 | 0 |
| Mode M9 | |||
|---|---|---|---|
| Quadrant | BADHDUFLAG | Total packets | Discarded packets |
| A | 0 | 12 | 0 |
| B | 0 | 12 | 0 |
| C | 0 | 12 | 0 |
| D | 0 | 12 | 0 |
| Mode M0 | |||
|---|---|---|---|
| Quadrant | BADHDUFLAG | Total packets | Discarded packets |
| A | 0 | 15360 | 2 |
| B | 0 | 17197 | 1 |
| C | 0 | 13025 | 1 |
| D | 0 | 13499 | 1 |
| Quadrant | Total seconds | Saturated seconds | Saturation percentage |
|---|---|---|---|
| A | 6325 | 261 | 4.126482% |
| B | 6325 | 183 | 2.893281% |
| C | 6325 | 49 | 0.774704% |
| D | 6325 | 70 | 1.106719% |
Noise dominated data is calculated using 1-second bins in cleaned event files. If a bin has >2000 counts, and if more than 50% of those come from <1% of pixels, then it is considered to be noise-dominated and hence unusable.
| Quadrant | # 1 sec bins | Bins with >0 counts | Bins with >2000 counts | High rate bins dominated by noise | Noise dominated (total time) | Noise dominated (detector-on time) | Marked lightcurve |
|---|---|---|---|---|---|---|---|
| A | 7540 | 6325 | 153 | 153 | 2.03% | 2.42% | 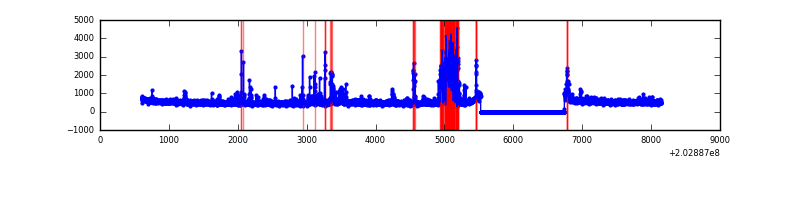 |
| B | 7540 | 6325 | 79 | 79 | 1.05% | 1.25% | 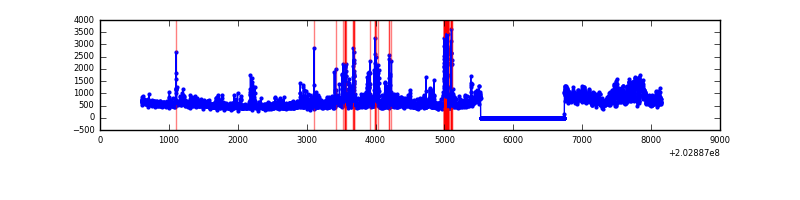 |
| C | 7540 | 6326 | 1 | 1 | 0.01% | 0.02% | 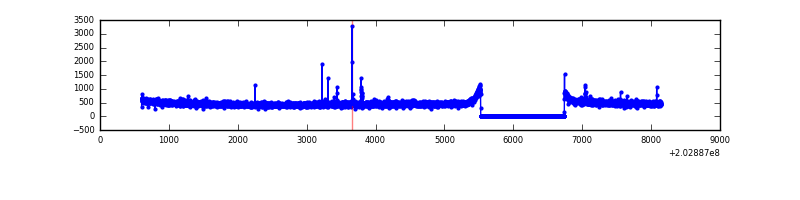 |
| D | 7540 | 6325 | 13 | 13 | 0.17% | 0.21% | 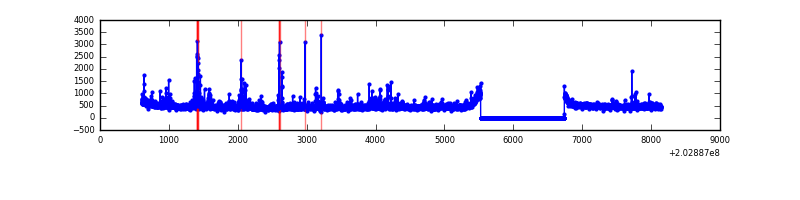 |
Top three noisy pixels from each quadrant. If the there are fewer than three noisy pixels in the level2.evt file, extra rows are filled as -1
| Pixel properties | Quadrant properties | ||||||
|---|---|---|---|---|---|---|---|
| Quadrant | DetID | PixID | Counts | Sigma | Mean | Median | Sigma |
| A | 13 | 251 | 455026 | 2865.78 | 783 | 766 | 158.5 |
| A | 8 | 15 | 169628 | 1065.3 | 783 | 766 | 158.5 |
| A | 0 | 118 | 124460 | 780.35 | 783 | 766 | 158.5 |
| B | 0 | 173 | 862221 | 5726.51 | 791 | 775 | 150.4 |
| B | 15 | 204 | 199828 | 1323.22 | 791 | 775 | 150.4 |
| B | 4 | 81 | 133457 | 882.01 | 791 | 775 | 150.4 |
| C | 1 | 226 | 12651 | 67.82 | 755 | 760 | 175.3 |
| C | 1 | 16 | 11982 | 64.01 | 755 | 760 | 175.3 |
| C | 12 | 4 | 9405 | 49.31 | 755 | 760 | 175.3 |
| D | 14 | 34 | 76134 | 412.68 | 758 | 738 | 182.7 |
| D | 13 | 239 | 56338 | 304.33 | 758 | 738 | 182.7 |
| D | 2 | 37 | 26402 | 140.47 | 758 | 738 | 182.7 |
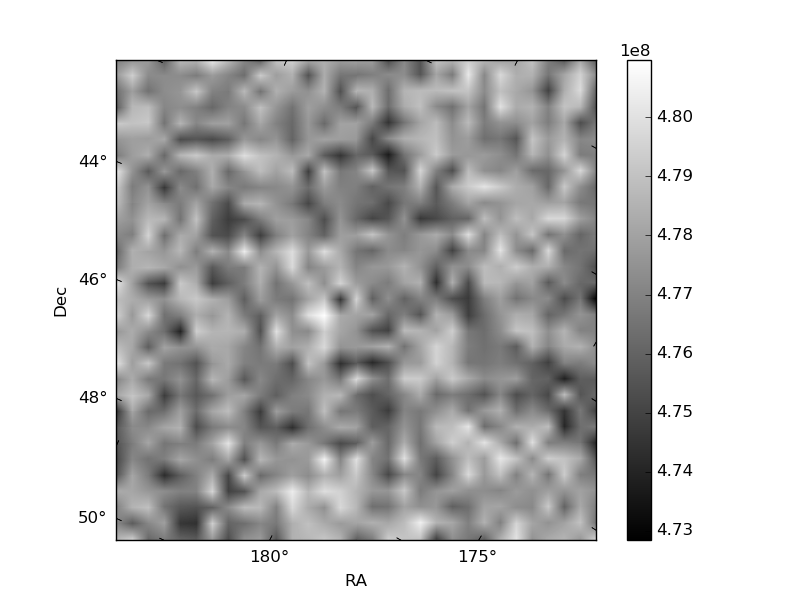
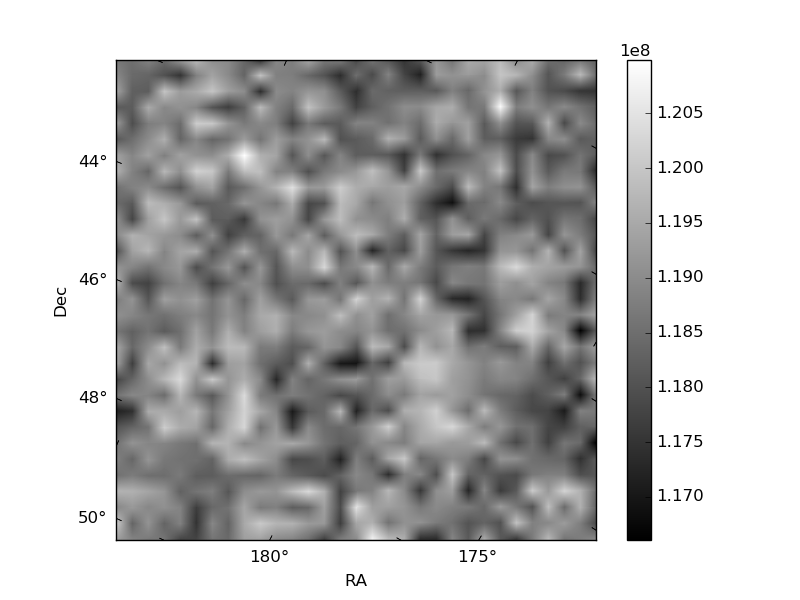
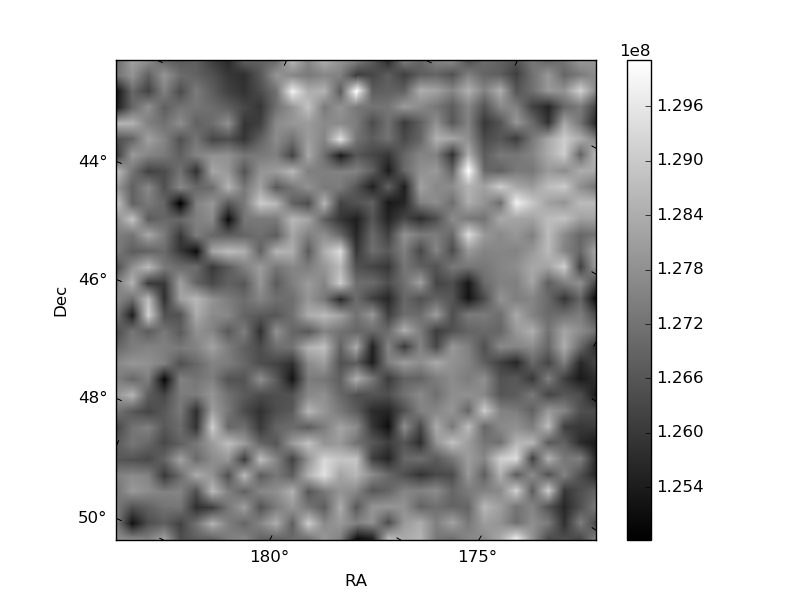
Histogram calculated using DETX and DETY for each event in the final _common_clean file
| Quadrant A | 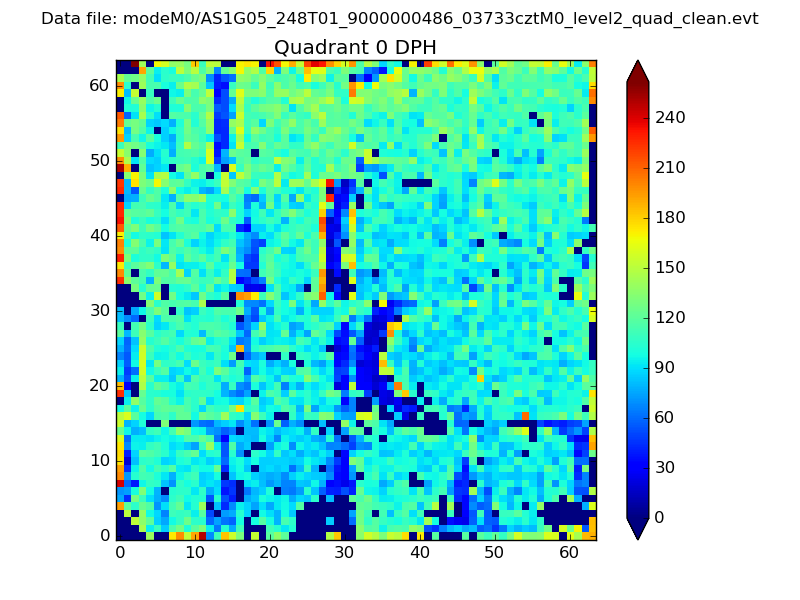 |
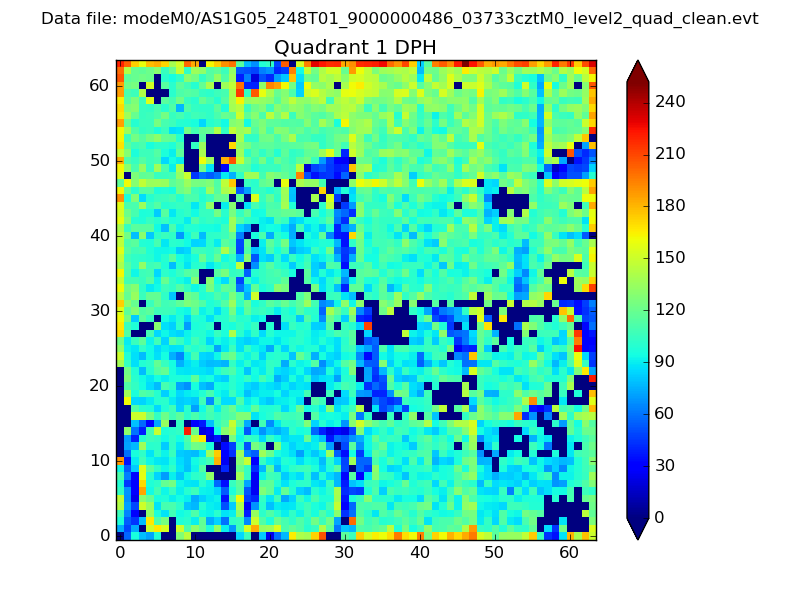 |
Quadrant B |
|---|---|---|---|
| Quadrant D | 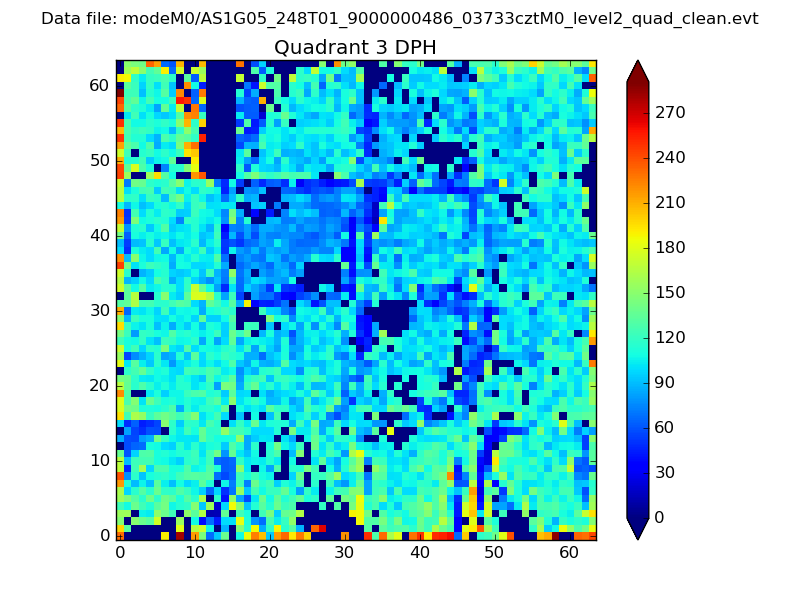 |
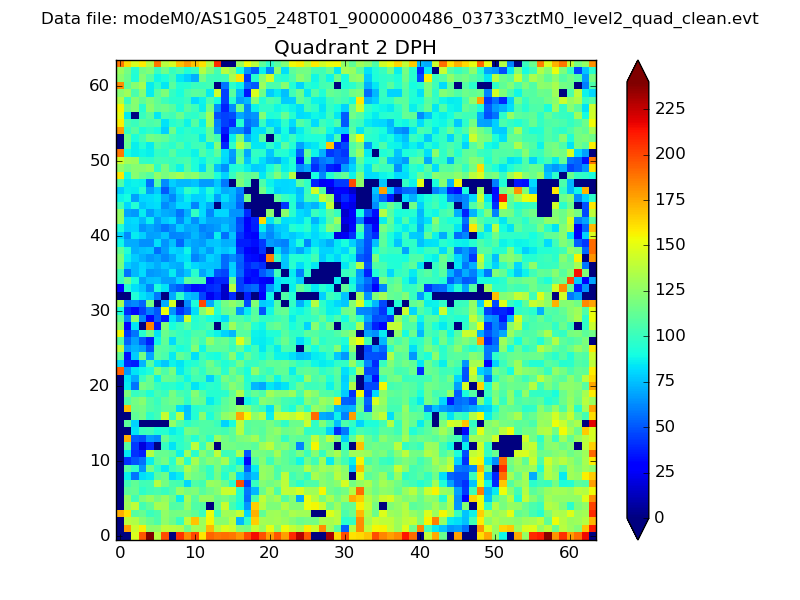 |
Quadrant C |
| Plot type | Count rate plots | Images |
|---|---|---|
| Comparison with Poisson distribution Blue bars denote a histogram of data divided into 1 sec bins. Red curve is a Poisson curve with rate = median count rate of data. |
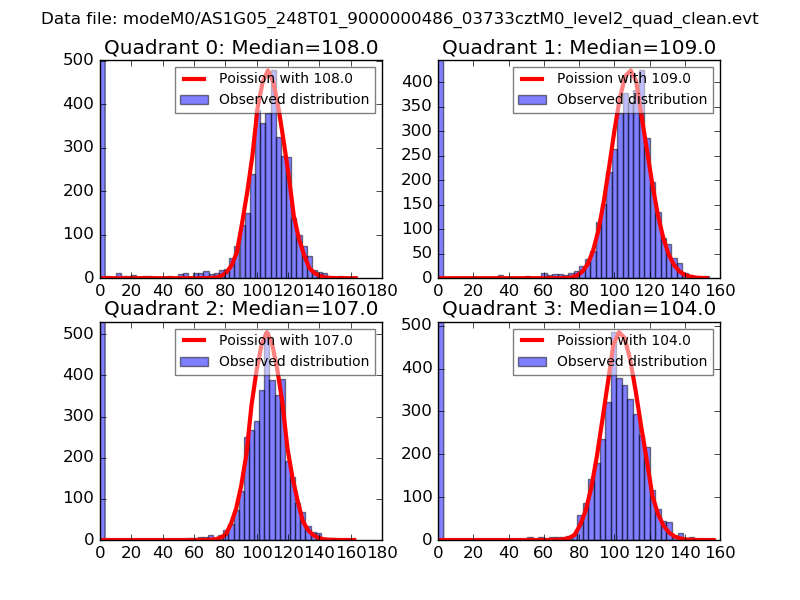 |
 |
| Quadrant-wise count rates Data is divided into 100 sec bins |
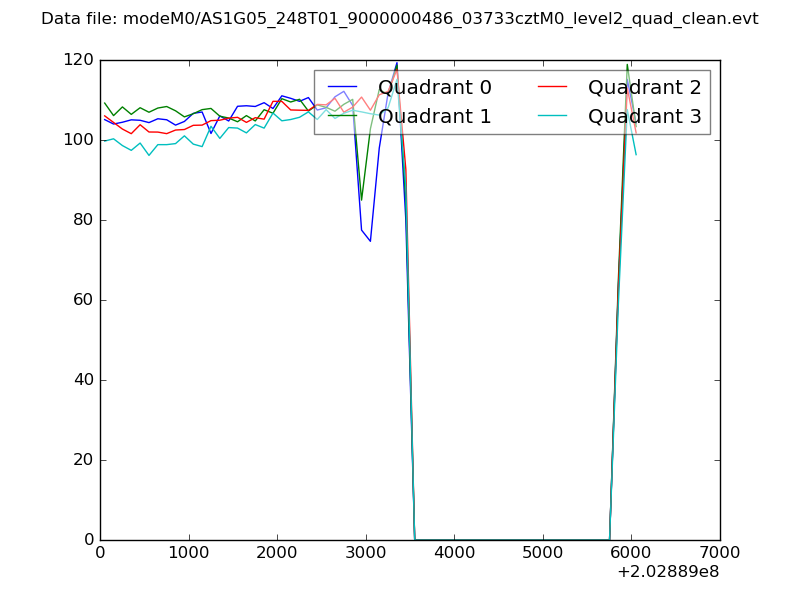 |
|
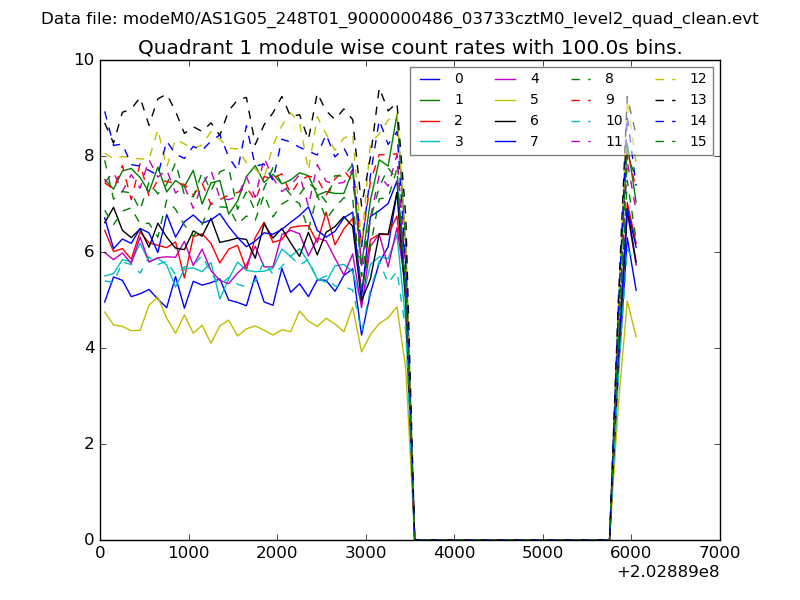
| Module-wise count rates for Quadrant A Data is divided into 100 sec bins |
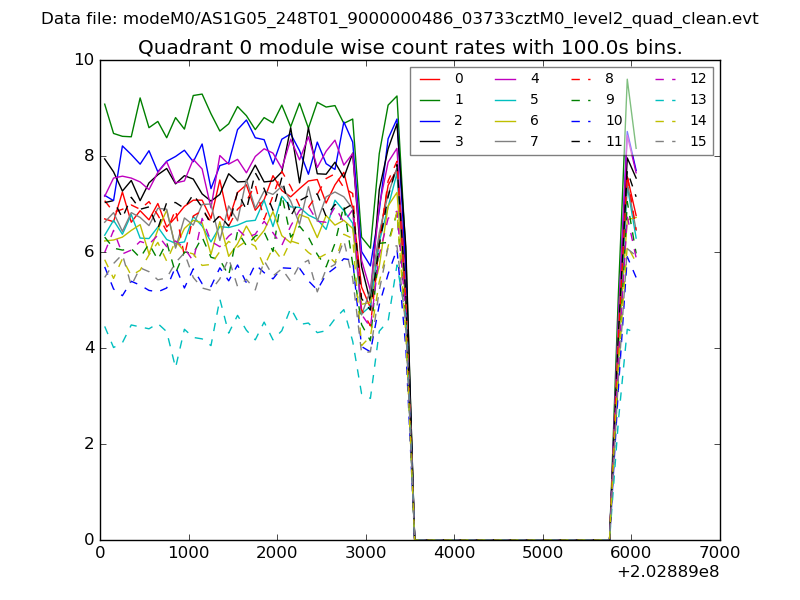 |
 |
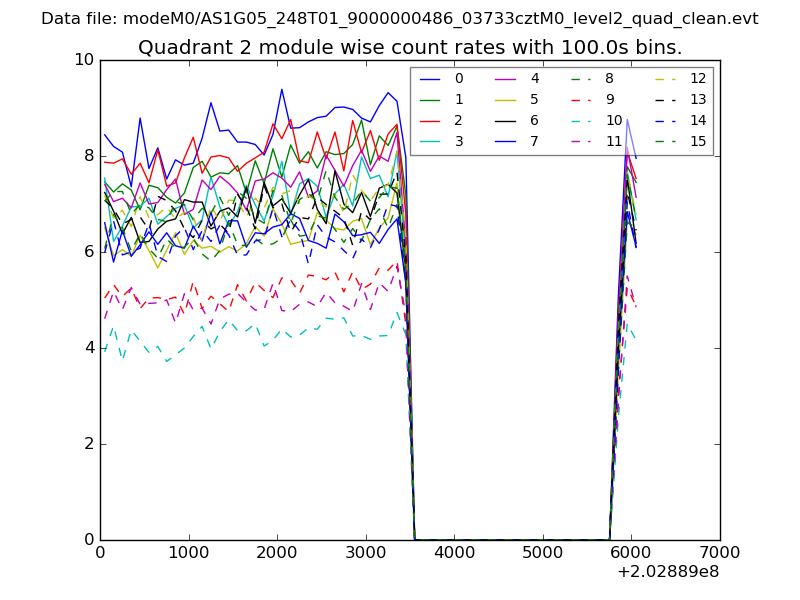
| Module-wise count rates for Quadrant B Data is divided into 100 sec bins |
 |
 |
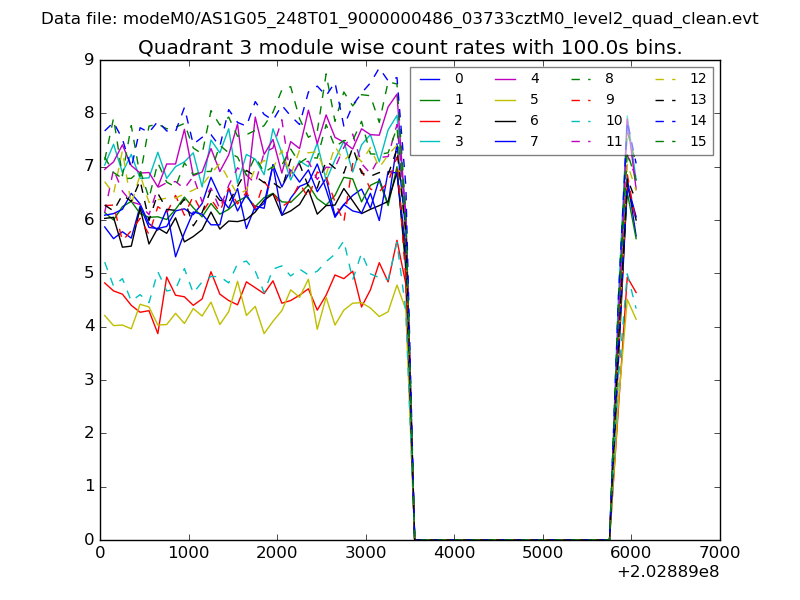
| Module-wise count rates for Quadrant C Data is divided into 100 sec bins |
 |
 |
| Module-wise count rates for Quadrant D Data is divided into 100 sec bins |
 |
 |
| Parameter | Plot |
|---|---|
| CZT HV Monitor | 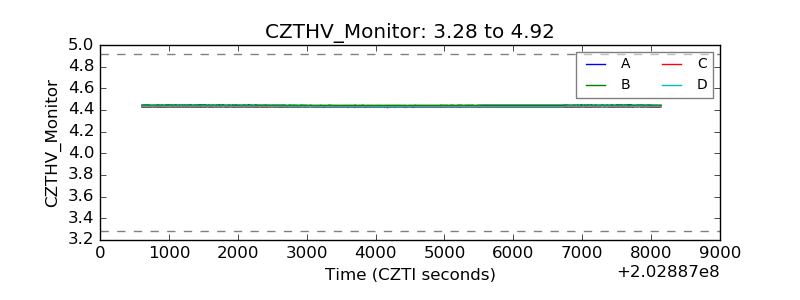 |
| D_VDD | 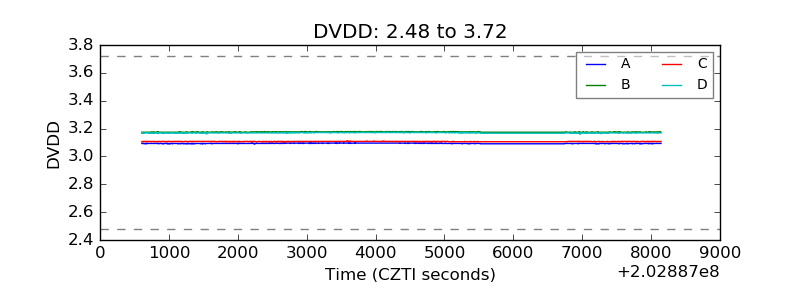 |
| Temperature 1 | 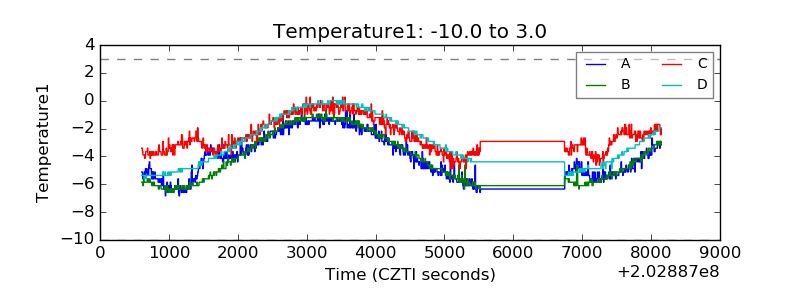 |
| Veto HV Monitor | 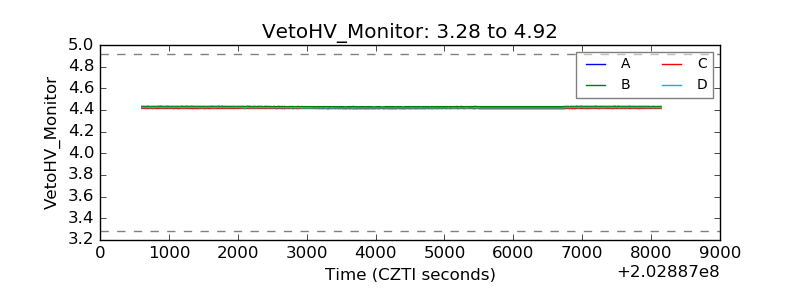 |
| Veto LLD | 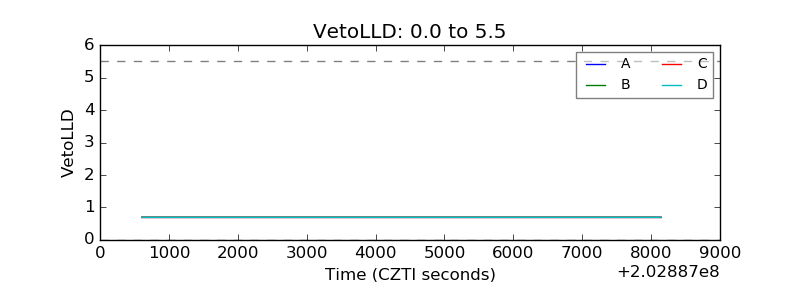 |
| Alpha Counter | 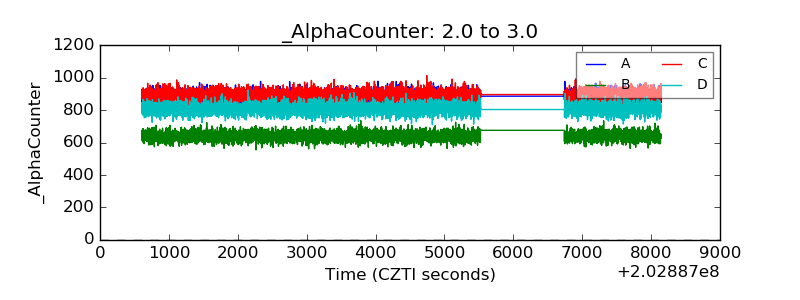 |
| _CPM_Rate | 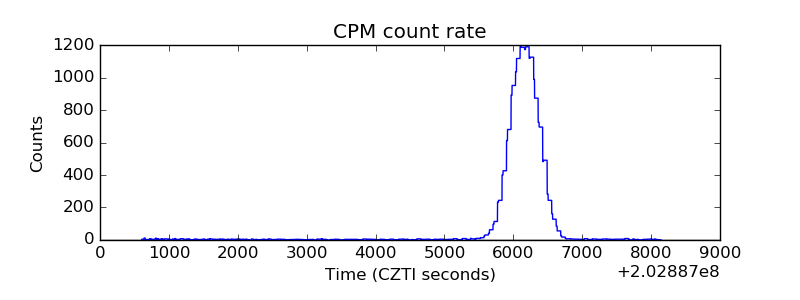 |
| CZT Counter | 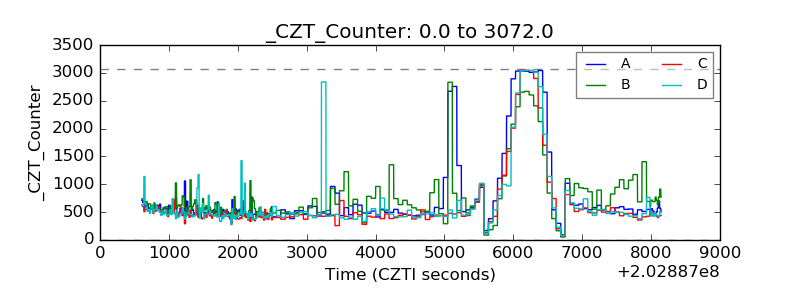 |
| +2.5 Volts monitor |  |
| +5 Volts monitor |  |
| Veto Counter | 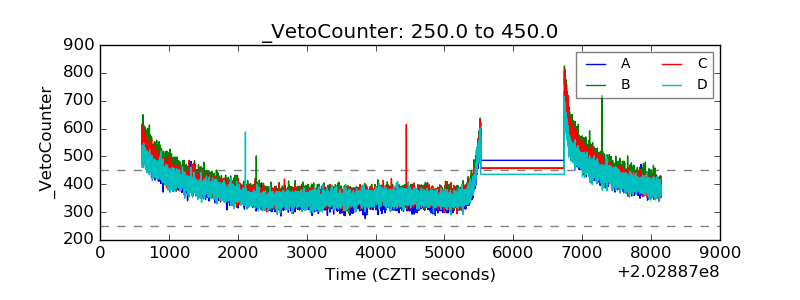 |