| Param | Original file | Final file |
|---|---|---|
| Filename | modeM0/AS1G05_248T01_9000000486_03736cztM0_level2.evt | modeM0/AS1G05_248T01_9000000486_03736cztM0_level2_quad_clean.evt |
| Size (bytes) | 532,494,720 | 88,675,200 |
| Size | 507.8 MB | 84.6 MB |
| Events in quadrant A | 5,097,090 | 528,441 |
| Events in quadrant B | 4,149,422 | 569,642 |
| Events in quadrant C | 3,167,957 | 561,995 |
| Events in quadrant D | 3,246,206 | 546,633 |
| Mode SS | |||
|---|---|---|---|
| Quadrant | BADHDUFLAG | Total packets | Discarded packets |
| A | 0 | 142 | 0 |
| B | 0 | 142 | 0 |
| C | 0 | 142 | 0 |
| D | 0 | 142 | 0 |
| Mode M9 | |||
|---|---|---|---|
| Quadrant | BADHDUFLAG | Total packets | Discarded packets |
| A | 0 | 9 | 0 |
| B | 0 | 9 | 0 |
| C | 0 | 9 | 0 |
| D | 0 | 9 | 0 |
| Mode M0 | |||
|---|---|---|---|
| Quadrant | BADHDUFLAG | Total packets | Discarded packets |
| A | 0 | 19702 | 3 |
| B | 0 | 16729 | 2 |
| C | 0 | 14219 | 2 |
| D | 0 | 14597 | 2 |
| Quadrant | Total seconds | Saturated seconds | Saturation percentage |
|---|---|---|---|
| A | 6854 | 793 | 11.569886% |
| B | 6854 | 144 | 2.100963% |
| C | 6854 | 80 | 1.167202% |
| D | 6854 | 97 | 1.415232% |
Noise dominated data is calculated using 1-second bins in cleaned event files. If a bin has >2000 counts, and if more than 50% of those come from <1% of pixels, then it is considered to be noise-dominated and hence unusable.
| Quadrant | # 1 sec bins | Bins with >0 counts | Bins with >2000 counts | High rate bins dominated by noise | Noise dominated (total time) | Noise dominated (detector-on time) | Marked lightcurve |
|---|---|---|---|---|---|---|---|
| A | 7839 | 6854 | 617 | 617 | 7.87% | 9.00% | 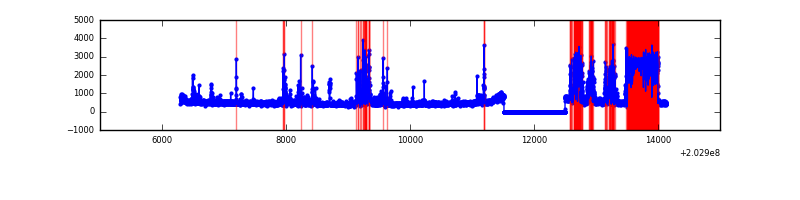 |
| B | 7839 | 6855 | 39 | 39 | 0.50% | 0.57% | 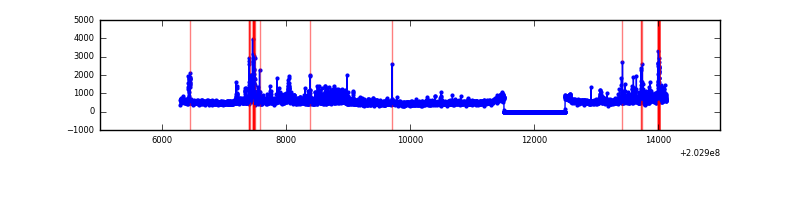 |
| C | 7839 | 6855 | 4 | 4 | 0.05% | 0.06% | 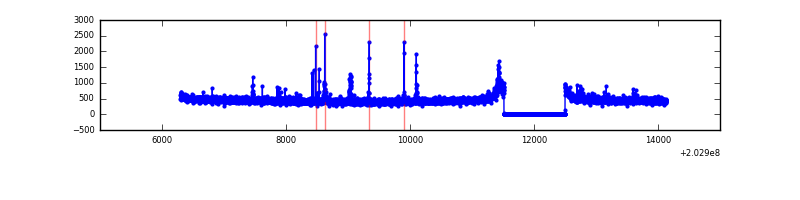 |
| D | 7839 | 6855 | 21 | 21 | 0.27% | 0.31% | 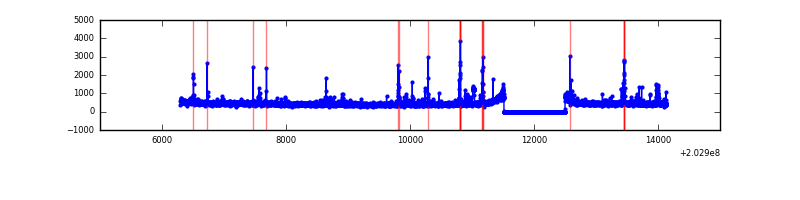 |
Top three noisy pixels from each quadrant. If the there are fewer than three noisy pixels in the level2.evt file, extra rows are filled as -1
| Pixel properties | Quadrant properties | ||||||
|---|---|---|---|---|---|---|---|
| Quadrant | DetID | PixID | Counts | Sigma | Mean | Median | Sigma |
| A | 13 | 251 | 1699956 | 10749.3 | 770 | 753 | 158.1 |
| A | 0 | 118 | 246520 | 1554.74 | 770 | 753 | 158.1 |
| A | 0 | 50 | 63113 | 394.49 | 770 | 753 | 158.1 |
| B | 15 | 204 | 435705 | 2782.57 | 814 | 794 | 156.3 |
| B | 0 | 173 | 360548 | 2301.72 | 814 | 794 | 156.3 |
| B | 0 | 228 | 64653 | 408.57 | 814 | 794 | 156.3 |
| C | 2 | 53 | 81453 | 442.01 | 784 | 786 | 182.5 |
| C | 9 | 247 | 8897 | 44.44 | 784 | 786 | 182.5 |
| C | 12 | 4 | 8879 | 44.34 | 784 | 786 | 182.5 |
| D | 13 | 223 | 46187 | 237.2 | 790 | 766 | 191.5 |
| D | 10 | 246 | 44058 | 226.09 | 790 | 766 | 191.5 |
| D | 13 | 239 | 40348 | 206.71 | 790 | 766 | 191.5 |
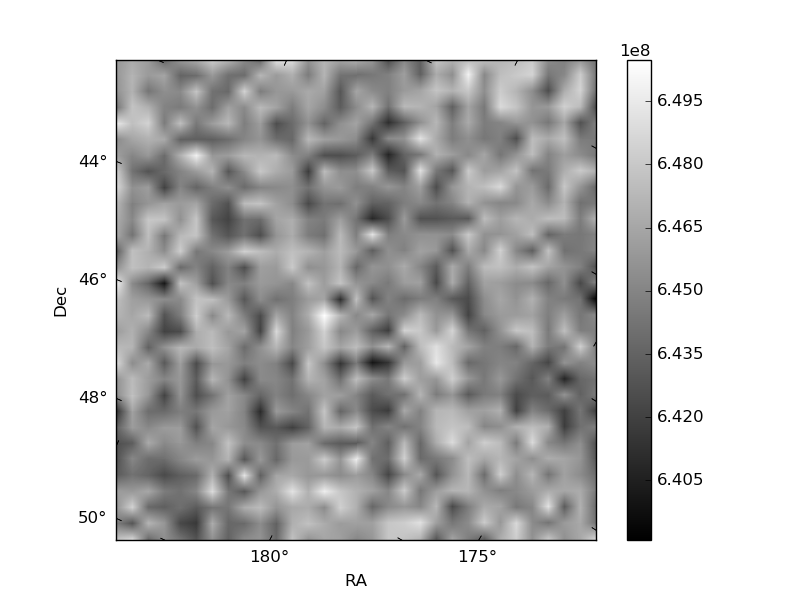
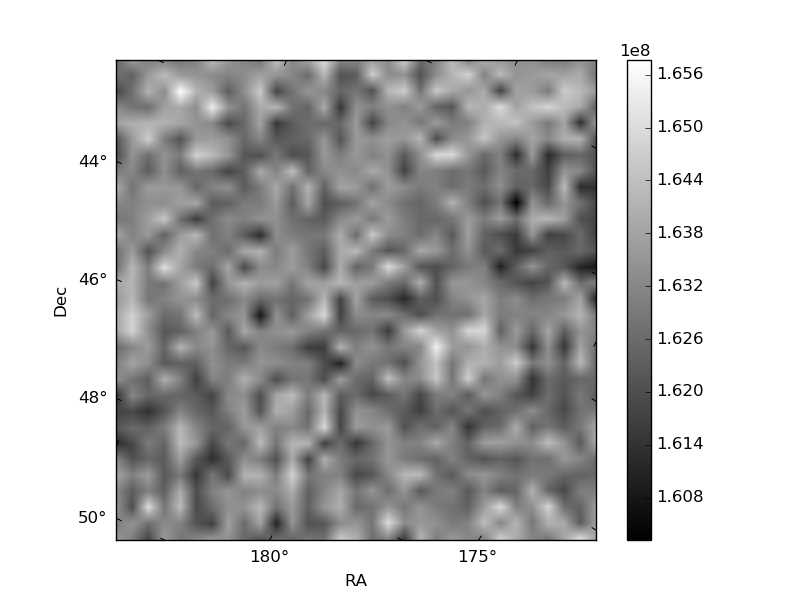
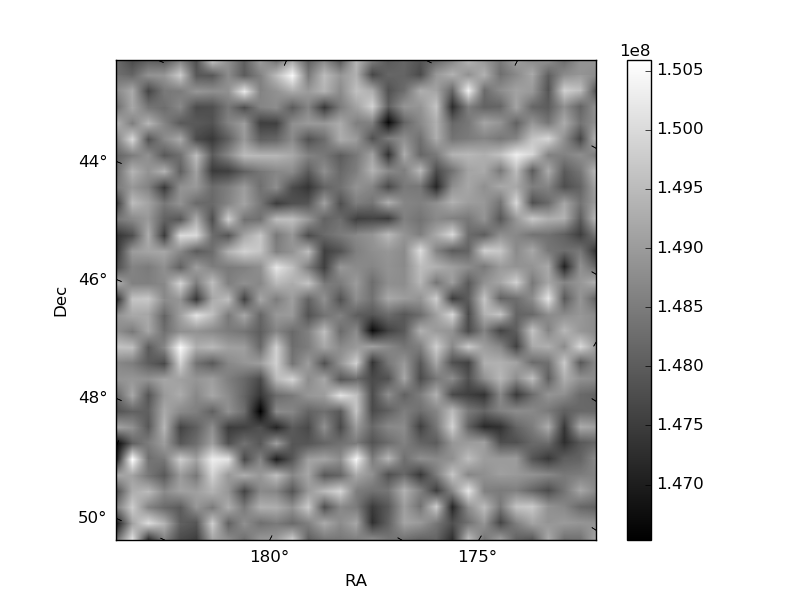
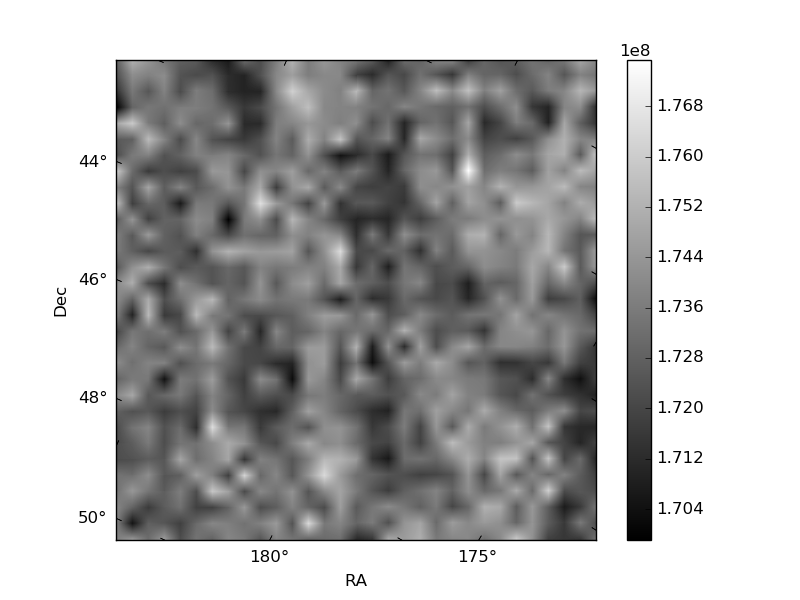
Histogram calculated using DETX and DETY for each event in the final _common_clean file
| Quadrant A | 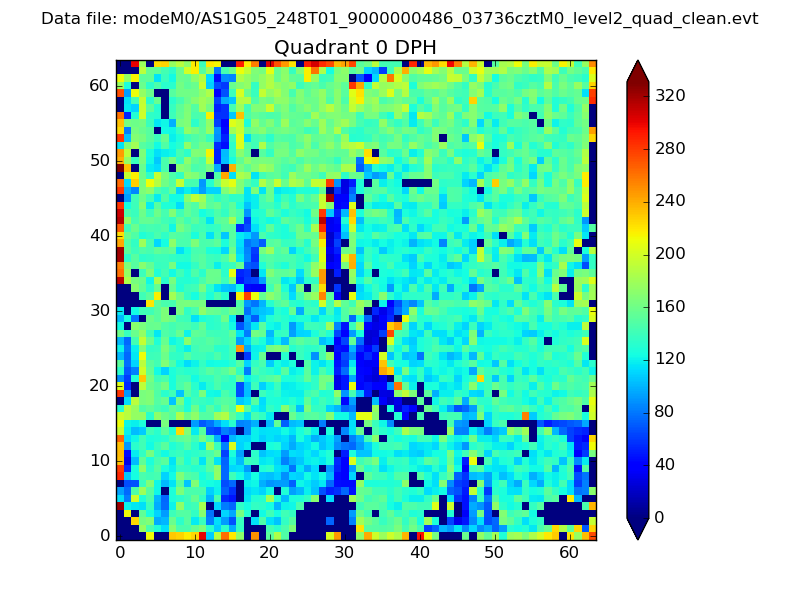 |
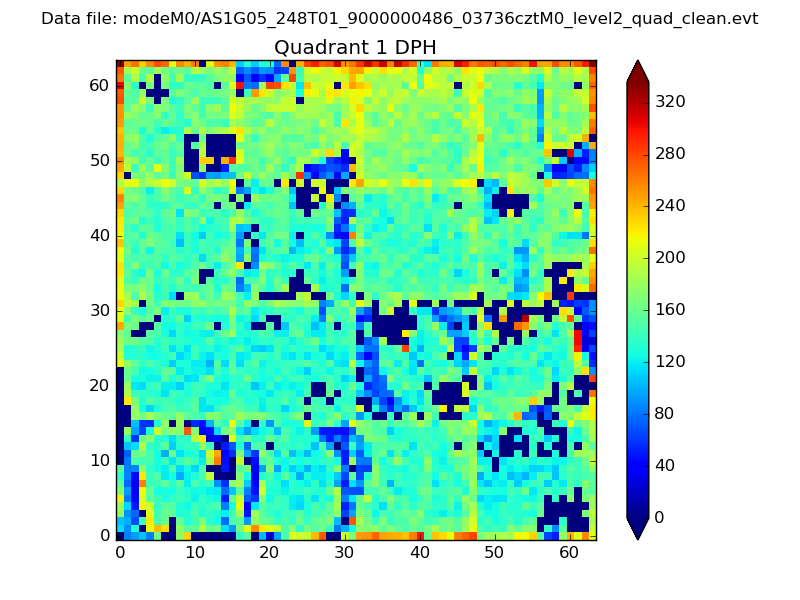 |
Quadrant B |
|---|---|---|---|
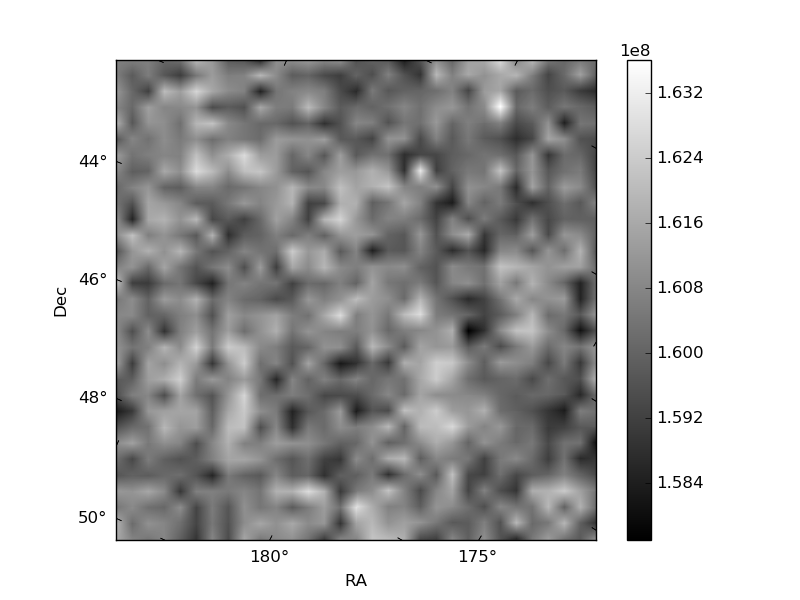
| Quadrant D | 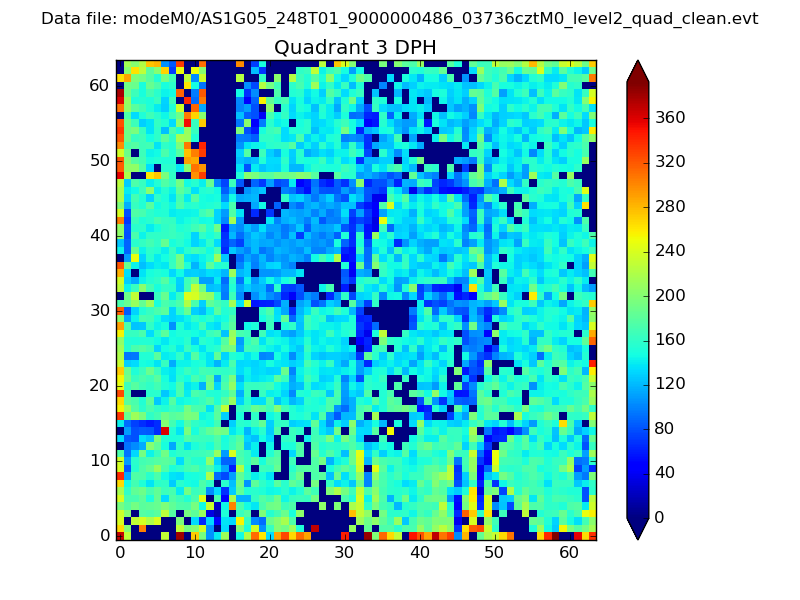 |
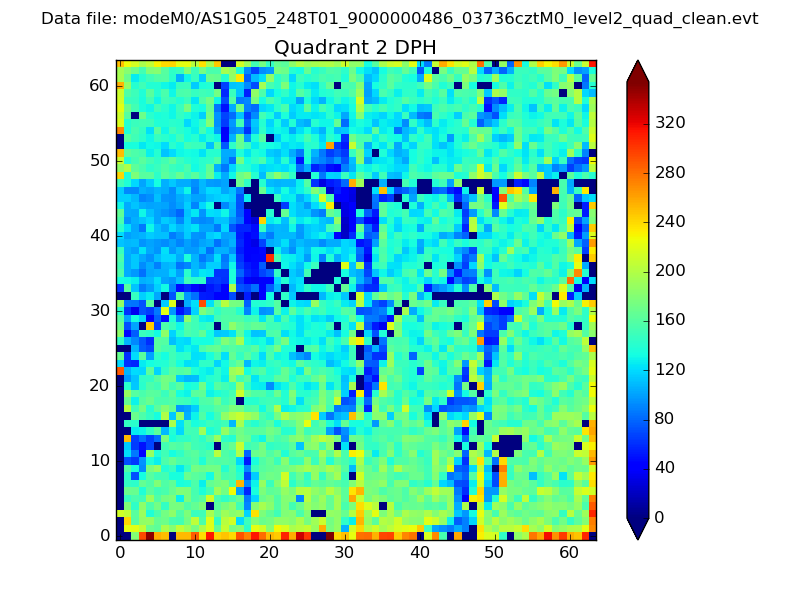 |
Quadrant C |
| Plot type | Count rate plots | Images |
|---|---|---|
| Comparison with Poisson distribution Blue bars denote a histogram of data divided into 1 sec bins. Red curve is a Poisson curve with rate = median count rate of data. |
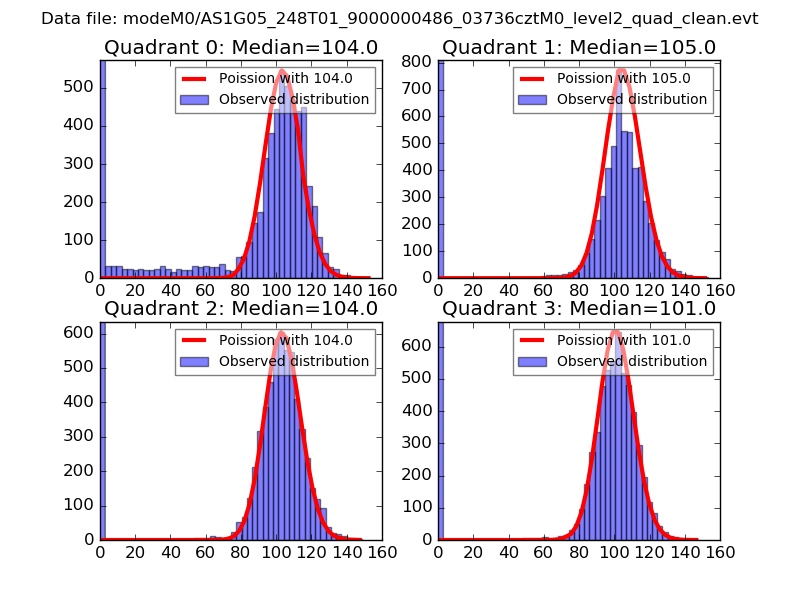 |
 |
| Quadrant-wise count rates Data is divided into 100 sec bins |
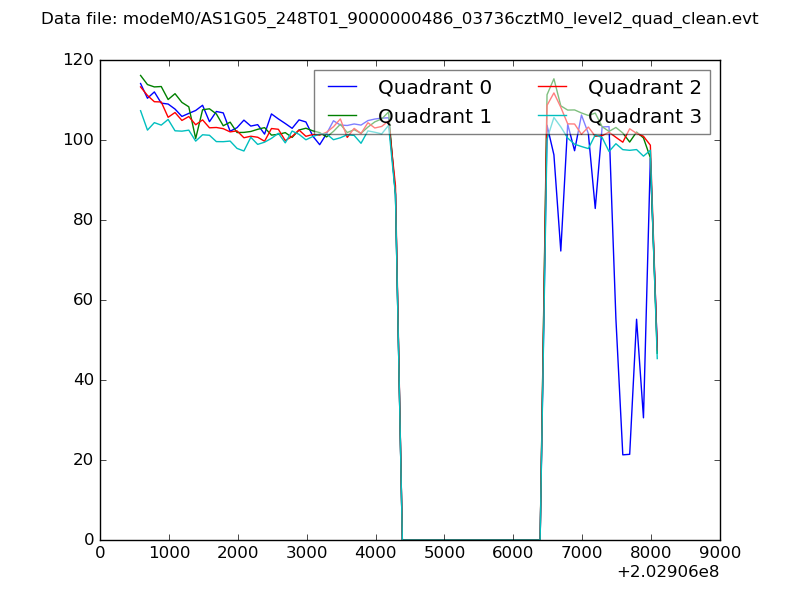 |
|
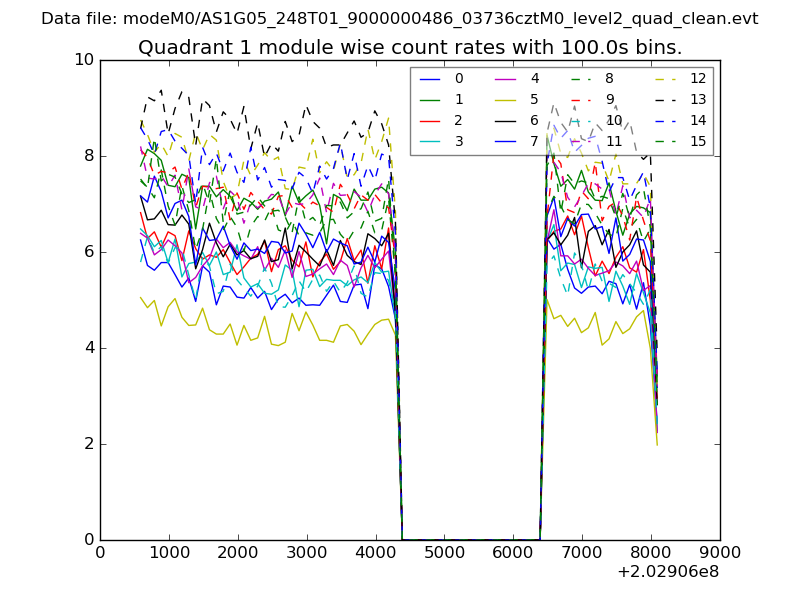
| Module-wise count rates for Quadrant A Data is divided into 100 sec bins |
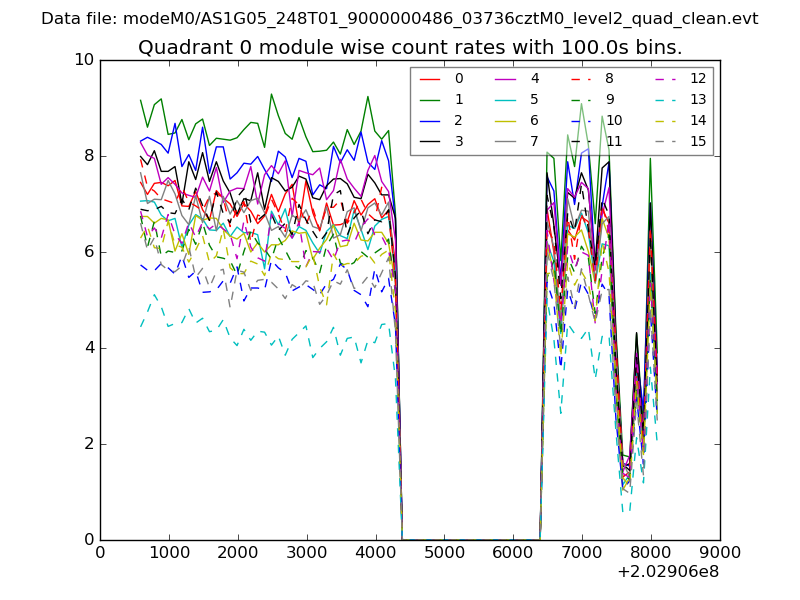 |
 |
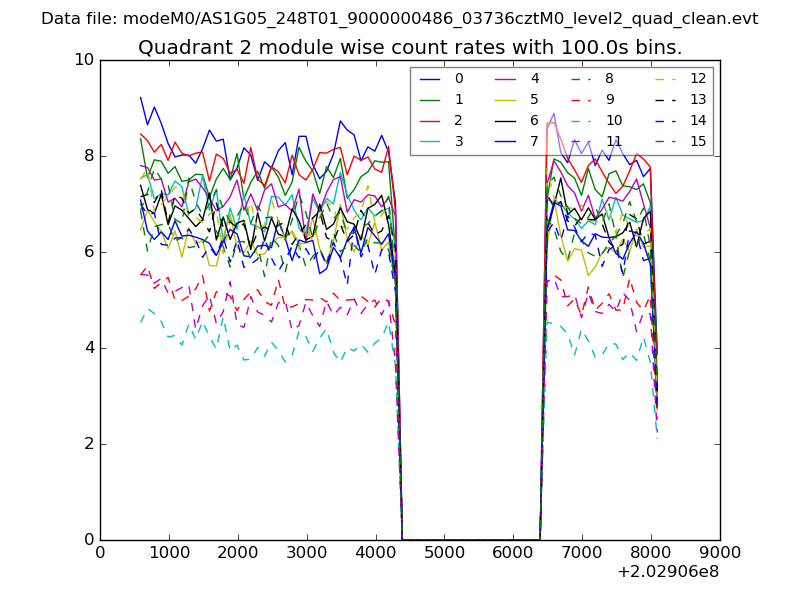
| Module-wise count rates for Quadrant B Data is divided into 100 sec bins |
 |
 |
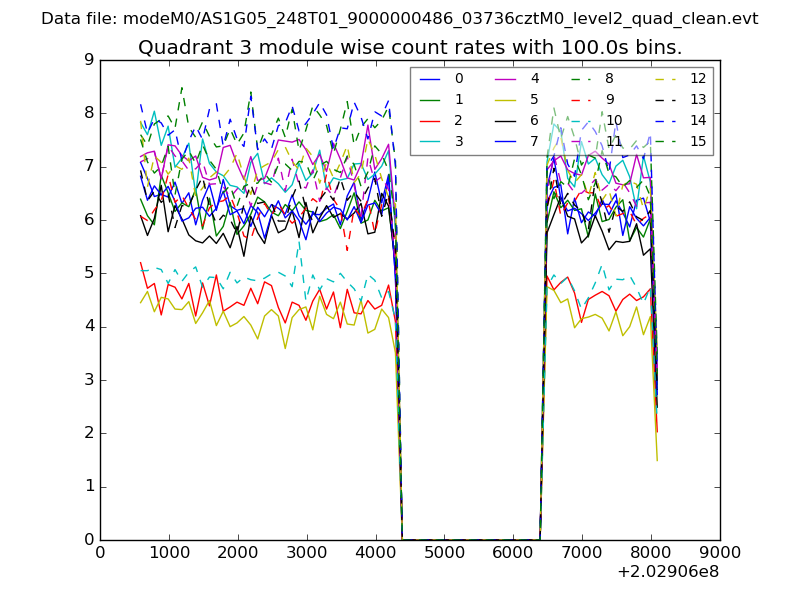
| Module-wise count rates for Quadrant C Data is divided into 100 sec bins |
 |
 |
| Module-wise count rates for Quadrant D Data is divided into 100 sec bins |
 |
 |
| Parameter | Plot |
|---|---|
| CZT HV Monitor | 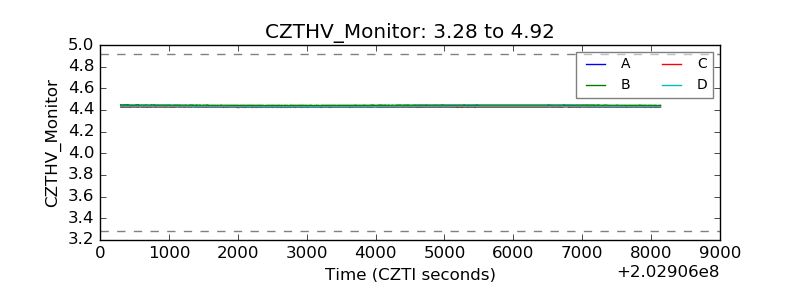 |
| D_VDD | 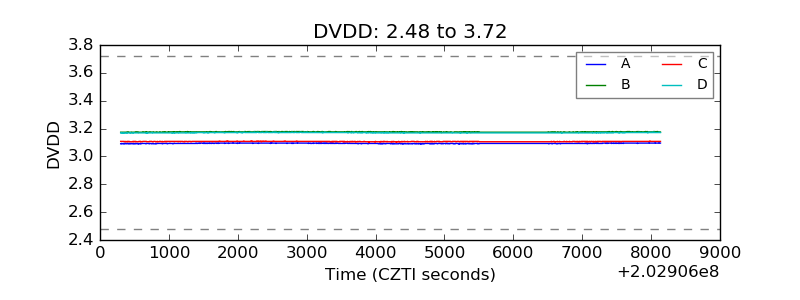 |
| Temperature 1 |  |
| Veto HV Monitor | 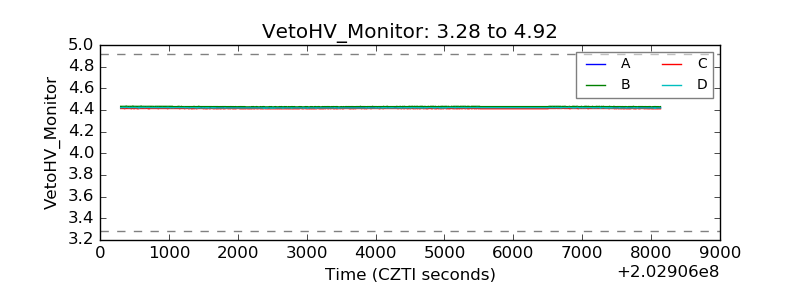 |
| Veto LLD | 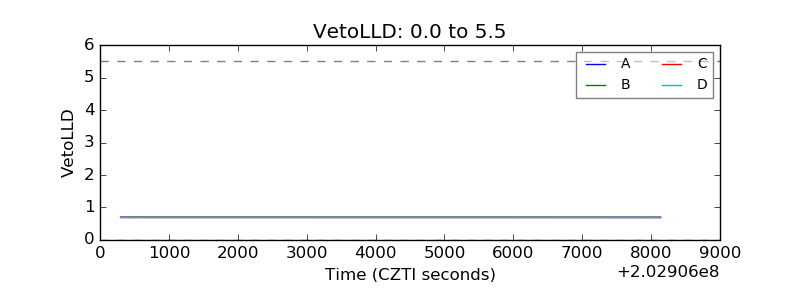 |
| Alpha Counter | 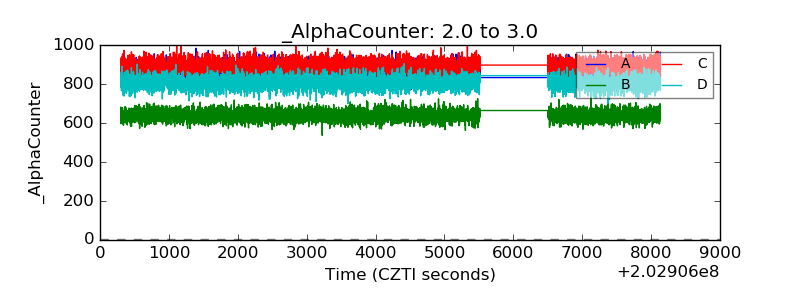 |
| _CPM_Rate | 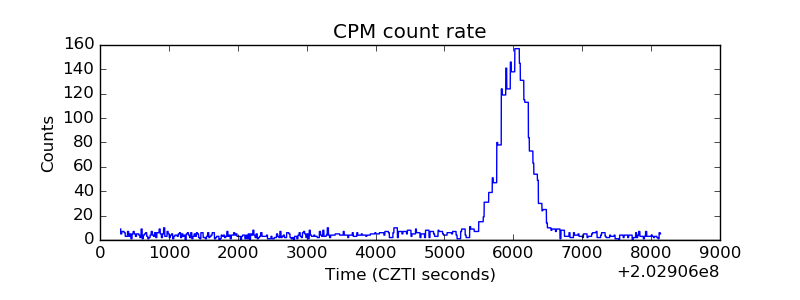 |
| CZT Counter | 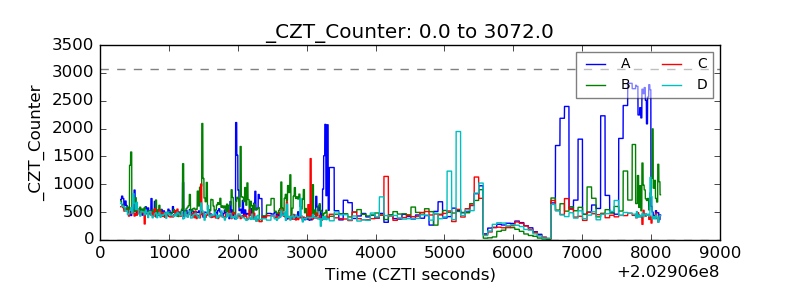 |
| +2.5 Volts monitor |  |
| +5 Volts monitor | 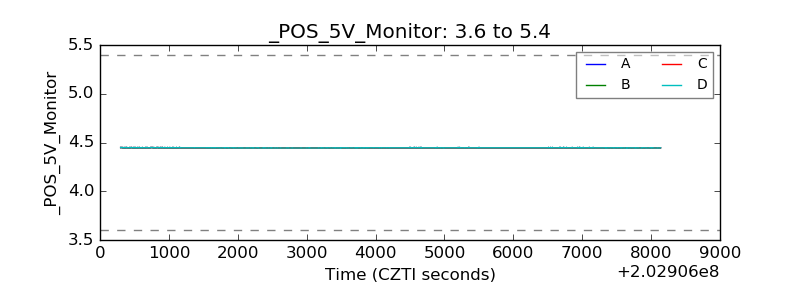 |
| Veto Counter | 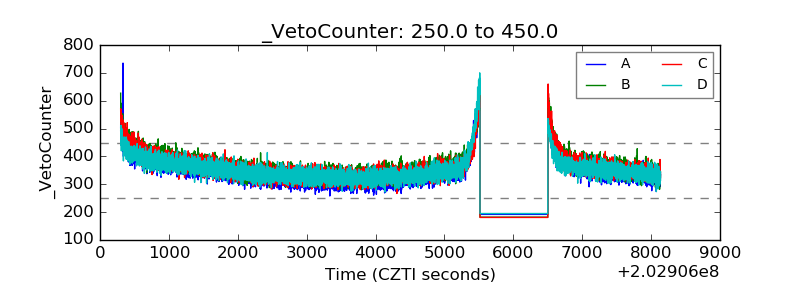 |