| Param | Original file | Final file |
|---|---|---|
| Filename | modeM0/AS1G05_248T01_9000000486_03738cztM0_level2.evt | modeM0/AS1G05_248T01_9000000486_03738cztM0_level2_quad_clean.evt |
| Size (bytes) | 513,789,120 | 75,936,960 |
| Size | 490.0 MB | 72.4 MB |
| Events in quadrant A | 4,376,185 | 454,831 |
| Events in quadrant B | 4,302,308 | 463,603 |
| Events in quadrant C | 2,989,517 | 465,190 |
| Events in quadrant D | 3,439,795 | 450,849 |
| Mode SS | |||
|---|---|---|---|
| Quadrant | BADHDUFLAG | Total packets | Discarded packets |
| A | 0 | 136 | 0 |
| B | 0 | 136 | 0 |
| C | 0 | 136 | 0 |
| D | 0 | 136 | 0 |
| Mode M9 | |||
|---|---|---|---|
| Quadrant | BADHDUFLAG | Total packets | Discarded packets |
| A | 0 | 2 | 0 |
| B | 0 | 2 | 0 |
| C | 0 | 2 | 0 |
| D | 0 | 2 | 0 |
| Mode M0 | |||
|---|---|---|---|
| Quadrant | BADHDUFLAG | Total packets | Discarded packets |
| A | 0 | 17468 | 2 |
| B | 0 | 17253 | 1 |
| C | 0 | 13833 | 1 |
| D | 0 | 15176 | 1 |
| Quadrant | Total seconds | Saturated seconds | Saturation percentage |
|---|---|---|---|
| A | 6663 | 322 | 4.832658% |
| B | 6663 | 152 | 2.281255% |
| C | 6663 | 25 | 0.375206% |
| D | 6663 | 96 | 1.440792% |
Noise dominated data is calculated using 1-second bins in cleaned event files. If a bin has >2000 counts, and if more than 50% of those come from <1% of pixels, then it is considered to be noise-dominated and hence unusable.
| Quadrant | # 1 sec bins | Bins with >0 counts | Bins with >2000 counts | High rate bins dominated by noise | Noise dominated (total time) | Noise dominated (detector-on time) | Marked lightcurve |
|---|---|---|---|---|---|---|---|
| A | 6913 | 6664 | 178 | 178 | 2.57% | 2.67% | 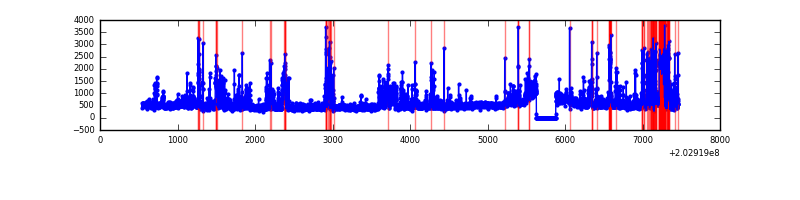 |
| B | 6913 | 6664 | 34 | 34 | 0.49% | 0.51% |  |
| C | 6913 | 6664 | 1 | 1 | 0.01% | 0.02% | 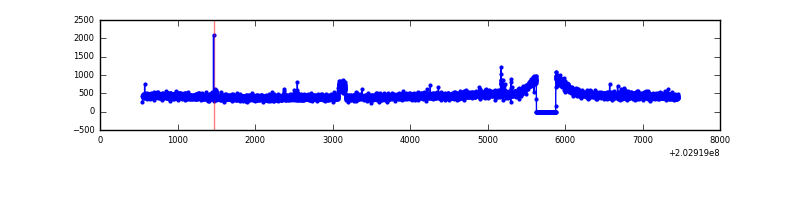 |
| D | 6913 | 6664 | 59 | 59 | 0.85% | 0.89% |  |
Top three noisy pixels from each quadrant. If the there are fewer than three noisy pixels in the level2.evt file, extra rows are filled as -1
| Pixel properties | Quadrant properties | ||||||
|---|---|---|---|---|---|---|---|
| Quadrant | DetID | PixID | Counts | Sigma | Mean | Median | Sigma |
| A | 0 | 118 | 554591 | 3506.85 | 758 | 741 | 157.9 |
| A | 13 | 251 | 551962 | 3490.2 | 758 | 741 | 157.9 |
| A | 0 | 128 | 128140 | 806.66 | 758 | 741 | 157.9 |
| B | 15 | 204 | 562233 | 3669.08 | 777 | 757 | 153.0 |
| B | 0 | 173 | 425488 | 2775.49 | 777 | 757 | 153.0 |
| B | 14 | 167 | 115793 | 751.73 | 777 | 757 | 153.0 |
| C | 2 | 53 | 32424 | 178.27 | 753 | 757 | 177.6 |
| C | 12 | 4 | 13262 | 70.4 | 753 | 757 | 177.6 |
| C | 13 | 61 | 6485 | 32.25 | 753 | 757 | 177.6 |
| D | 9 | 35 | 178138 | 966.35 | 753 | 732 | 183.6 |
| D | 2 | 118 | 165402 | 896.98 | 753 | 732 | 183.6 |
| D | 14 | 34 | 130647 | 707.66 | 753 | 732 | 183.6 |
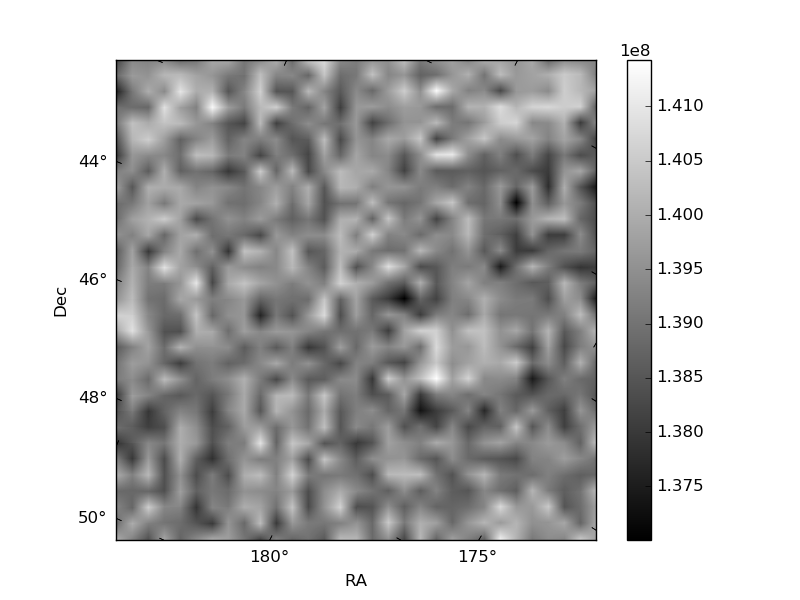
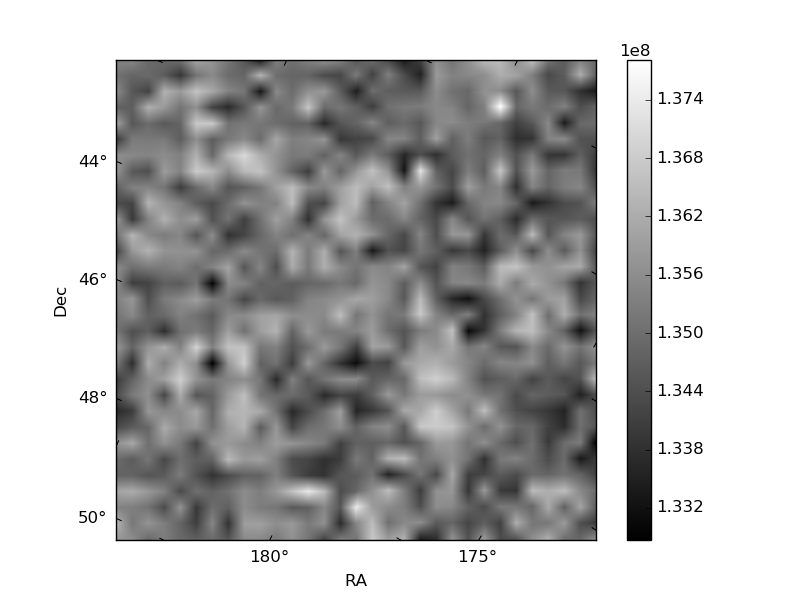
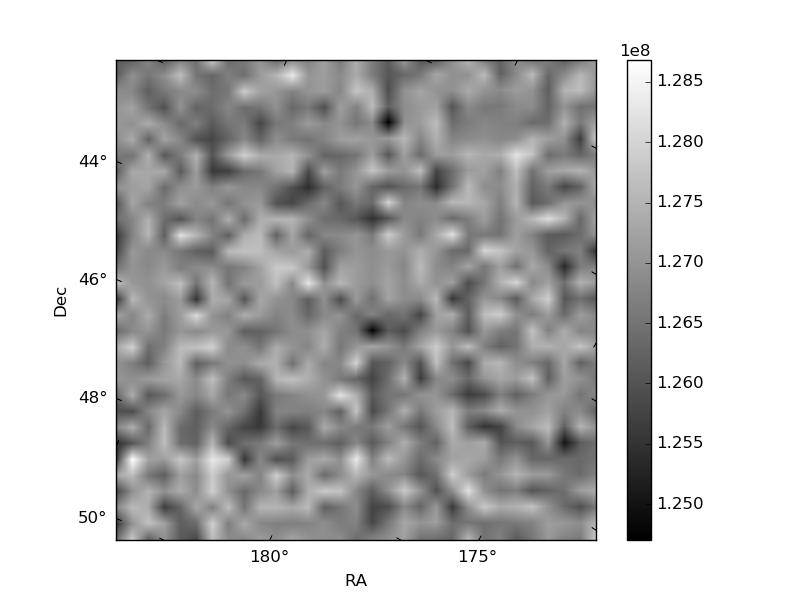
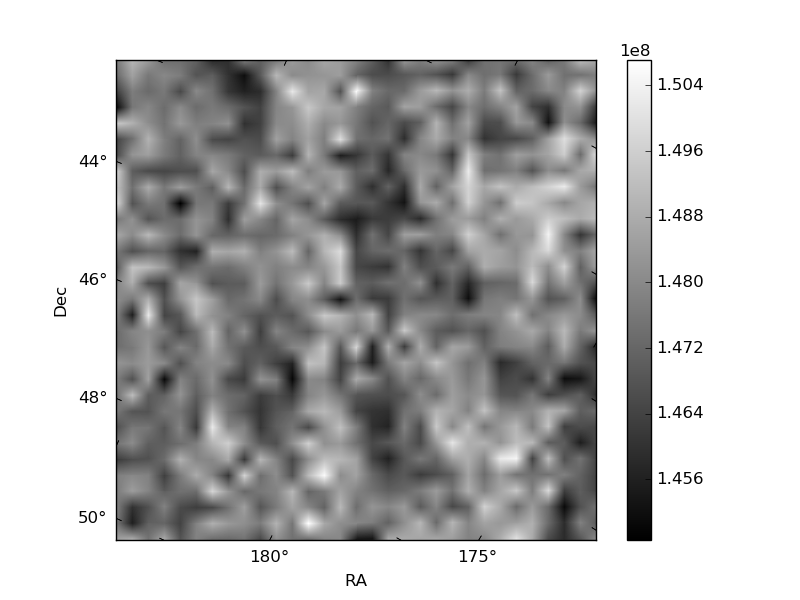
Histogram calculated using DETX and DETY for each event in the final _common_clean file
| Quadrant A | 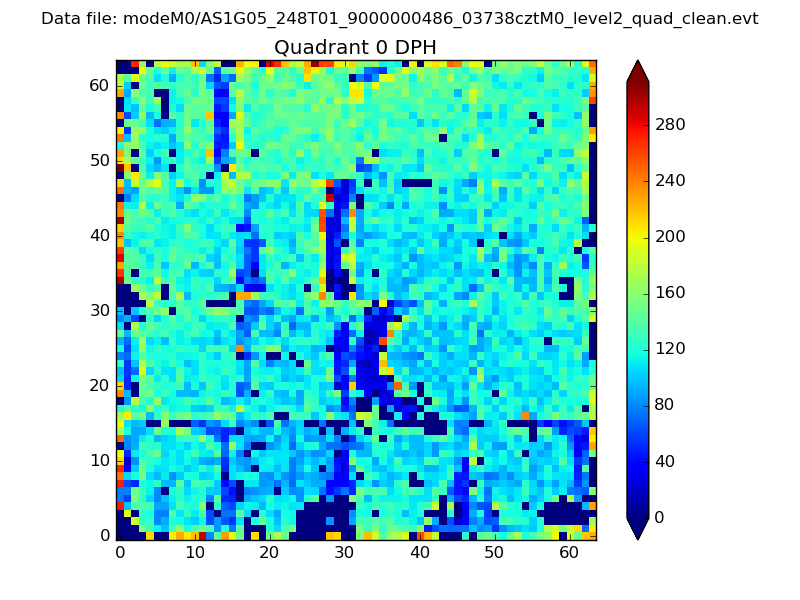 |
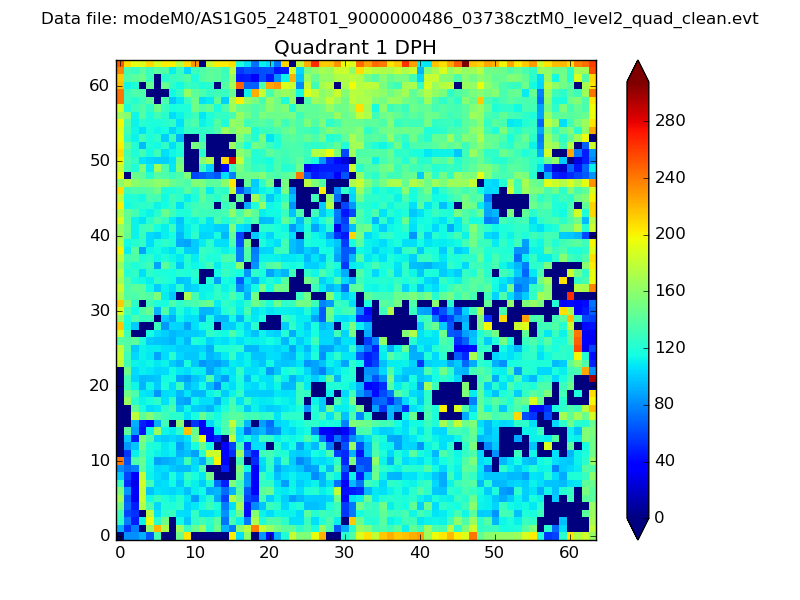 |
Quadrant B |
|---|---|---|---|
| Quadrant D |  |
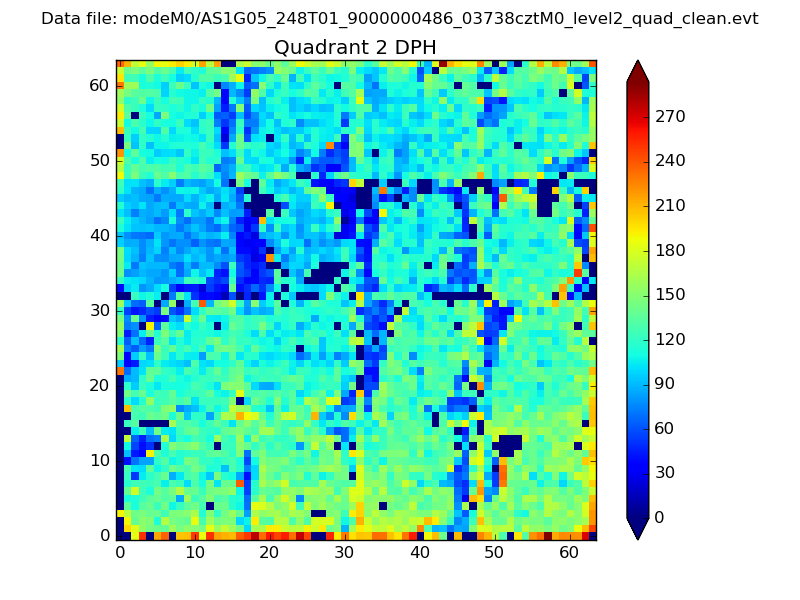 |
Quadrant C |
| Plot type | Count rate plots | Images |
|---|---|---|
| Comparison with Poisson distribution Blue bars denote a histogram of data divided into 1 sec bins. Red curve is a Poisson curve with rate = median count rate of data. |
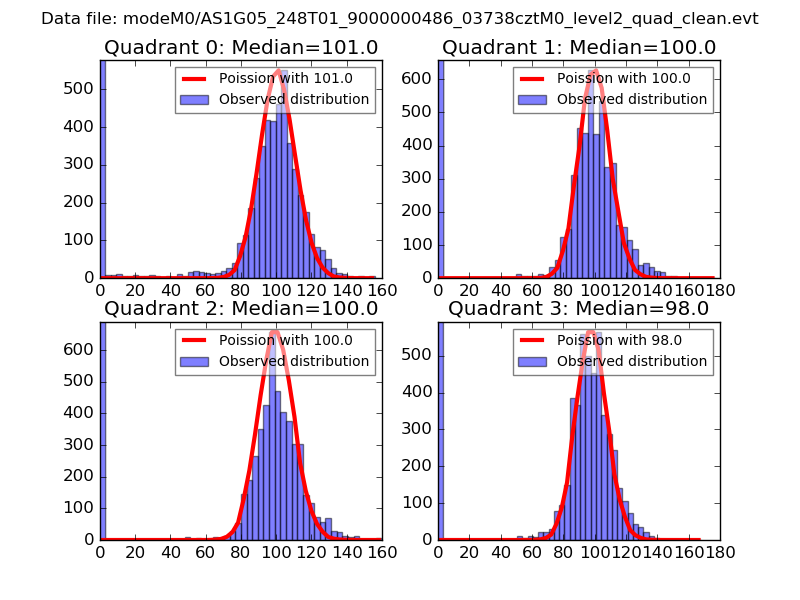 |
 |
| Quadrant-wise count rates Data is divided into 100 sec bins |
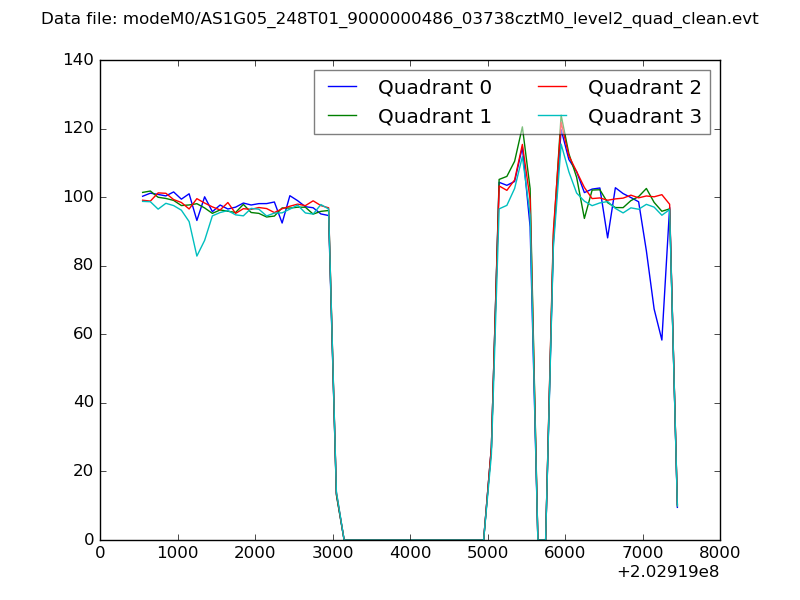 |
|
| Module-wise count rates for Quadrant A Data is divided into 100 sec bins |
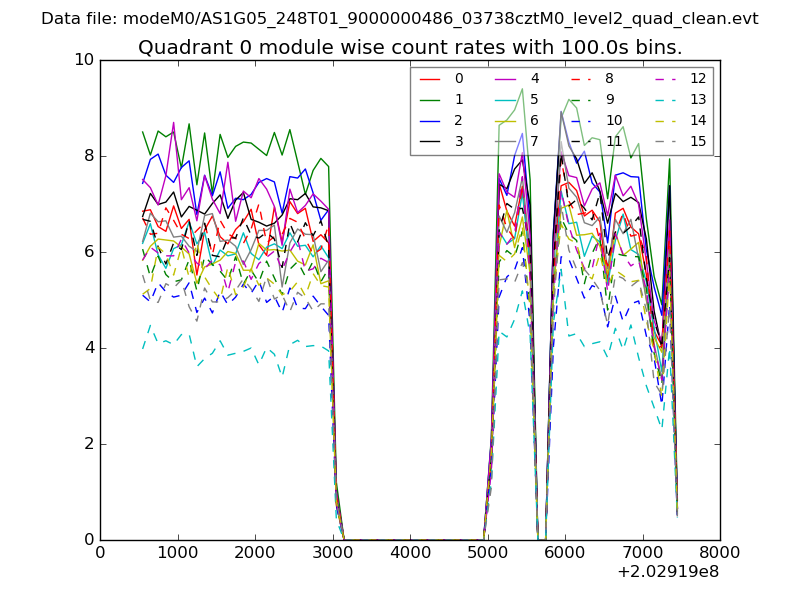 |
 |
| Module-wise count rates for Quadrant B Data is divided into 100 sec bins |
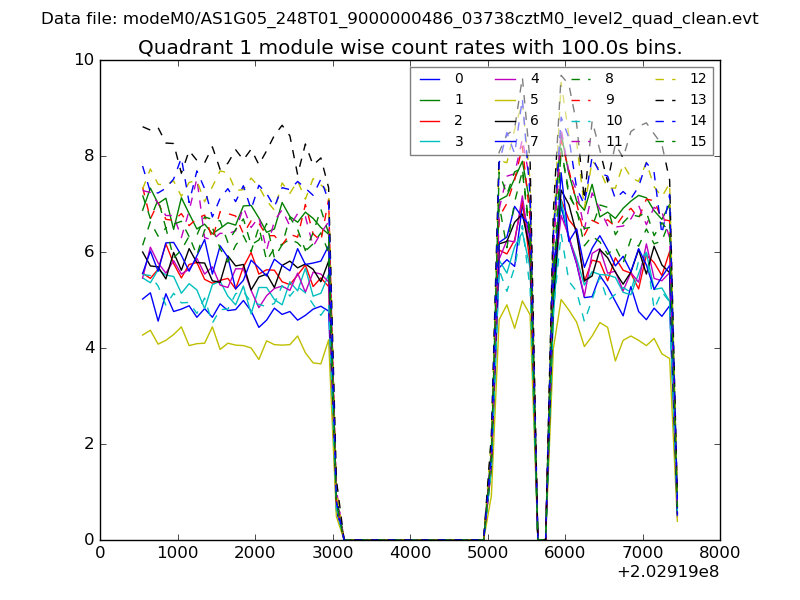 |
 |
| Module-wise count rates for Quadrant C Data is divided into 100 sec bins |
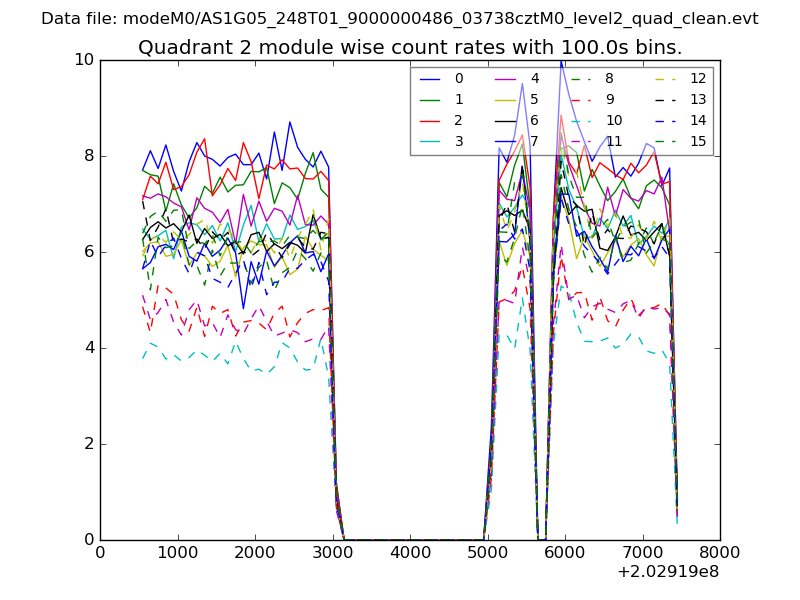 |
 |
| Module-wise count rates for Quadrant D Data is divided into 100 sec bins |
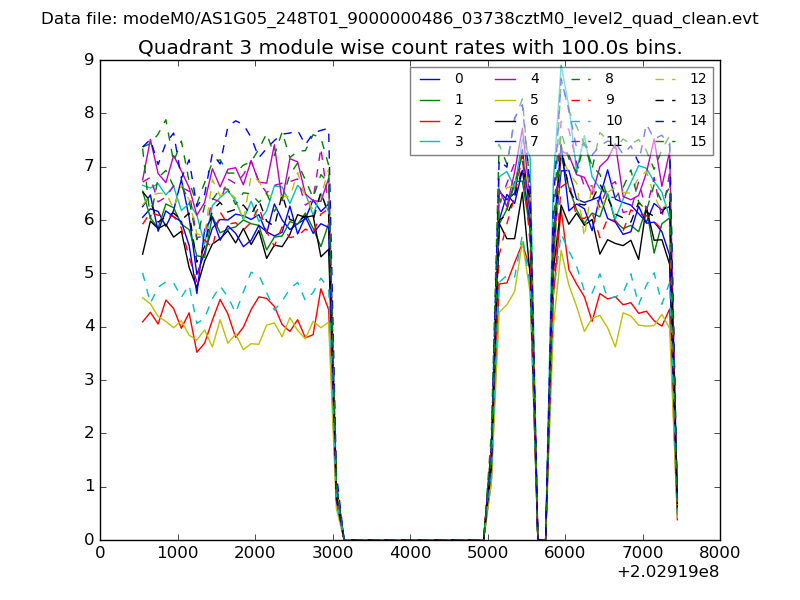 |
 |
| Parameter | Plot |
|---|---|
| CZT HV Monitor | 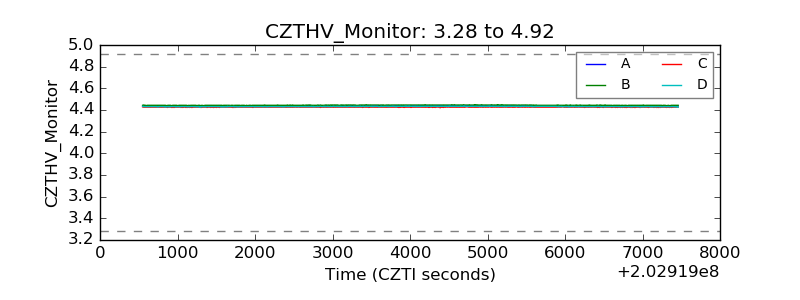 |
| D_VDD | 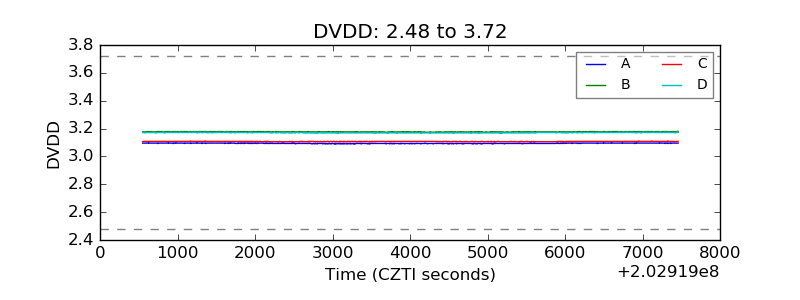 |
| Temperature 1 |  |
| Veto HV Monitor | 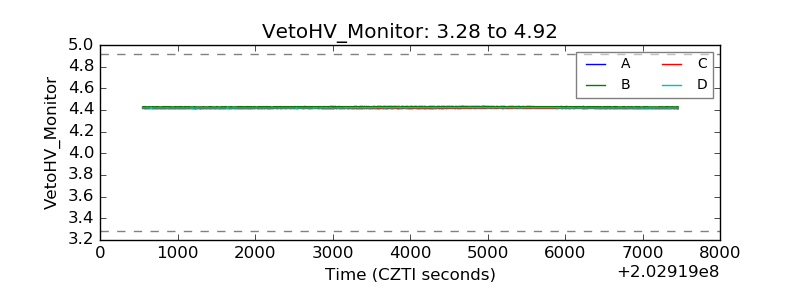 |
| Veto LLD | 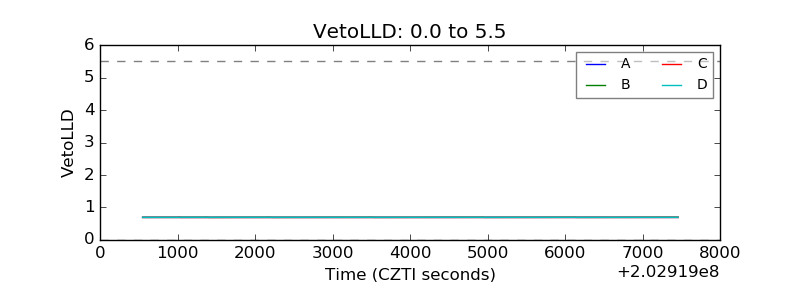 |
| Alpha Counter | 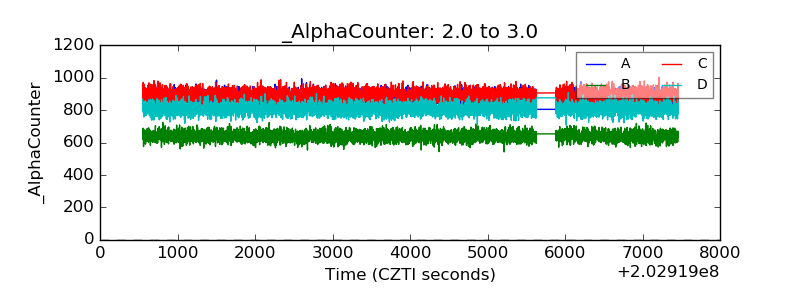 |
| _CPM_Rate | 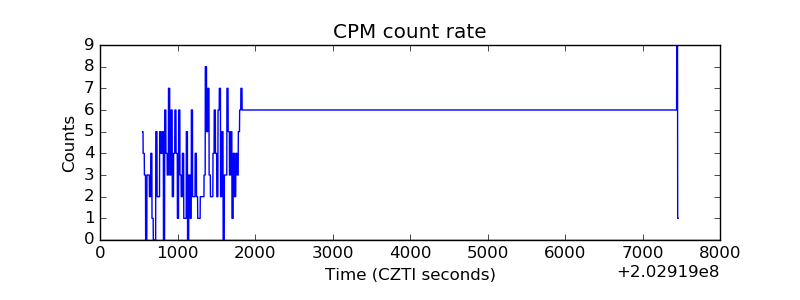 |
| CZT Counter | 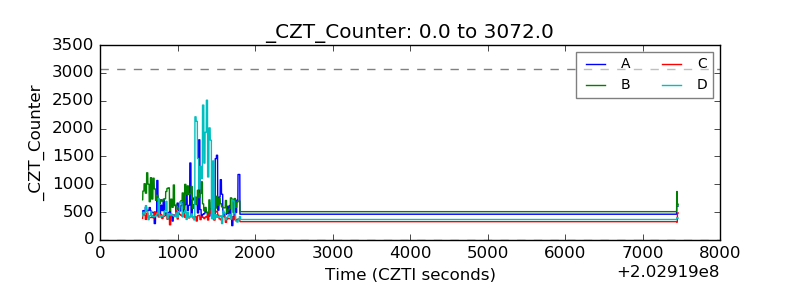 |
| +2.5 Volts monitor |  |
| +5 Volts monitor |  |
| Veto Counter | 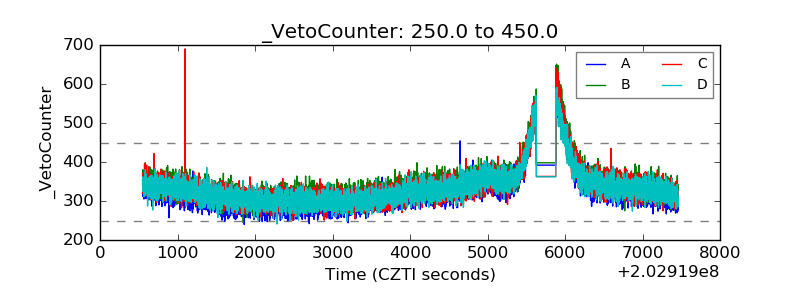 |