| Param | Original file | Final file |
|---|---|---|
| Filename | modeM0/AS1G05_248T01_9000000486_03739cztM0_level2.evt | modeM0/AS1G05_248T01_9000000486_03739cztM0_level2_quad_clean.evt |
| Size (bytes) | 567,126,720 | 87,756,480 |
| Size | 540.9 MB | 83.7 MB |
| Events in quadrant A | 4,831,770 | 533,511 |
| Events in quadrant B | 4,752,983 | 540,417 |
| Events in quadrant C | 3,312,511 | 541,836 |
| Events in quadrant D | 3,777,721 | 527,670 |
| Mode SS | |||
|---|---|---|---|
| Quadrant | BADHDUFLAG | Total packets | Discarded packets |
| A | 0 | 150 | 0 |
| B | 0 | 150 | 0 |
| C | 0 | 150 | 0 |
| D | 0 | 150 | 0 |
| Mode M9 | |||
|---|---|---|---|
| Quadrant | BADHDUFLAG | Total packets | Discarded packets |
| A | 0 | 1 | 0 |
| B | 0 | 1 | 0 |
| C | 0 | 1 | 0 |
| D | 0 | 1 | 0 |
| Mode M0 | |||
|---|---|---|---|
| Quadrant | BADHDUFLAG | Total packets | Discarded packets |
| A | 0 | 19384 | 2 |
| B | 0 | 19036 | 1 |
| C | 0 | 15230 | 1 |
| D | 0 | 16485 | 1 |
| Quadrant | Total seconds | Saturated seconds | Saturation percentage |
|---|---|---|---|
| A | 7379 | 384 | 5.203957% |
| B | 7379 | 240 | 3.252473% |
| C | 7379 | 42 | 0.569183% |
| D | 7379 | 86 | 1.165470% |
Noise dominated data is calculated using 1-second bins in cleaned event files. If a bin has >2000 counts, and if more than 50% of those come from <1% of pixels, then it is considered to be noise-dominated and hence unusable.
| Quadrant | # 1 sec bins | Bins with >0 counts | Bins with >2000 counts | High rate bins dominated by noise | Noise dominated (total time) | Noise dominated (detector-on time) | Marked lightcurve |
|---|---|---|---|---|---|---|---|
| A | 7474 | 7380 | 222 | 222 | 2.97% | 3.01% | 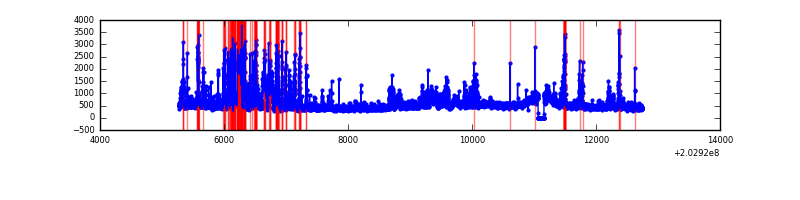 |
| B | 7474 | 7380 | 52 | 52 | 0.70% | 0.70% | 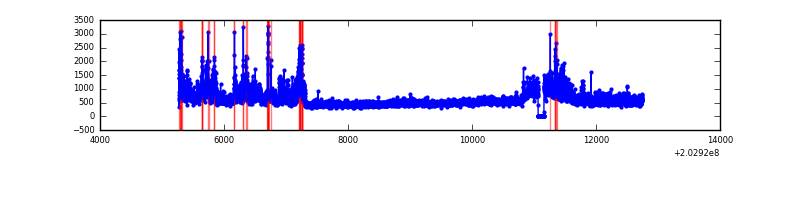 |
| C | 7474 | 7380 | 0 | 0 | 0.00% | 0.00% | 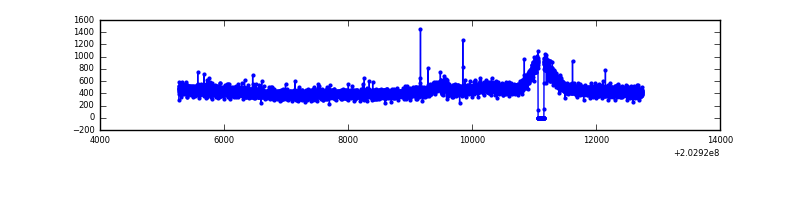 |
| D | 7474 | 7380 | 21 | 21 | 0.28% | 0.28% | 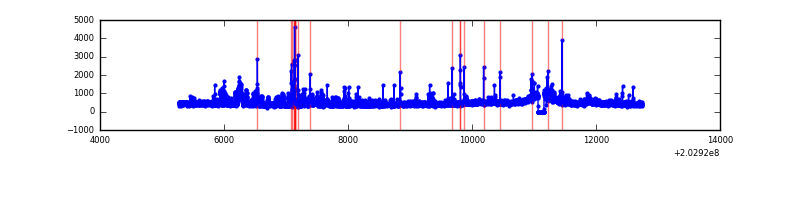 |
Top three noisy pixels from each quadrant. If the there are fewer than three noisy pixels in the level2.evt file, extra rows are filled as -1
| Pixel properties | Quadrant properties | ||||||
|---|---|---|---|---|---|---|---|
| Quadrant | DetID | PixID | Counts | Sigma | Mean | Median | Sigma |
| A | 0 | 118 | 707709 | 4023.46 | 841 | 820 | 175.7 |
| A | 13 | 251 | 530034 | 3012.17 | 841 | 820 | 175.7 |
| A | 0 | 128 | 141938 | 803.21 | 841 | 820 | 175.7 |
| B | 0 | 173 | 649135 | 3855.26 | 862 | 840 | 168.2 |
| B | 15 | 204 | 445021 | 2641.44 | 862 | 840 | 168.2 |
| B | 14 | 167 | 151285 | 894.66 | 862 | 840 | 168.2 |
| C | 2 | 53 | 25564 | 125.2 | 837 | 838 | 197.5 |
| C | 12 | 4 | 7920 | 35.86 | 837 | 838 | 197.5 |
| C | 13 | 61 | 7061 | 31.51 | 837 | 838 | 197.5 |
| D | 2 | 118 | 316266 | 1564.11 | 835 | 810 | 201.7 |
| D | 9 | 35 | 54947 | 268.42 | 835 | 810 | 201.7 |
| D | 1 | 255 | 39842 | 193.53 | 835 | 810 | 201.7 |
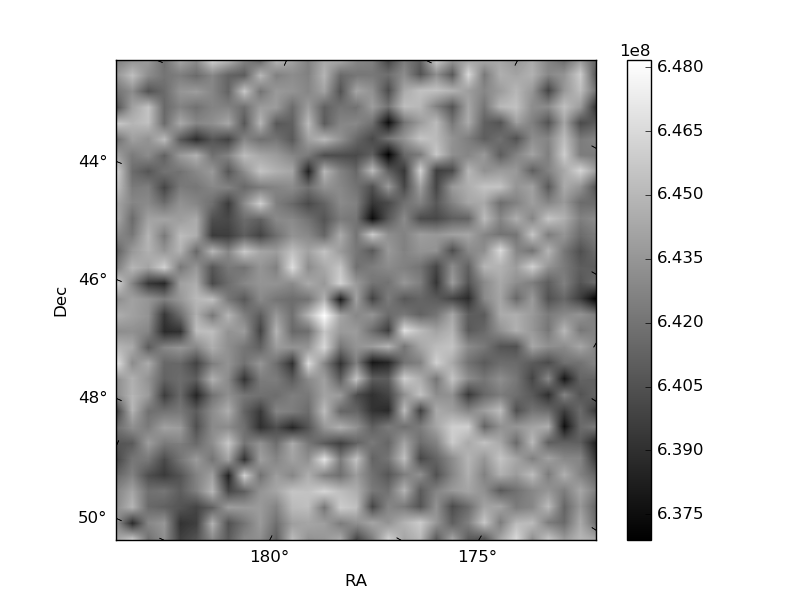
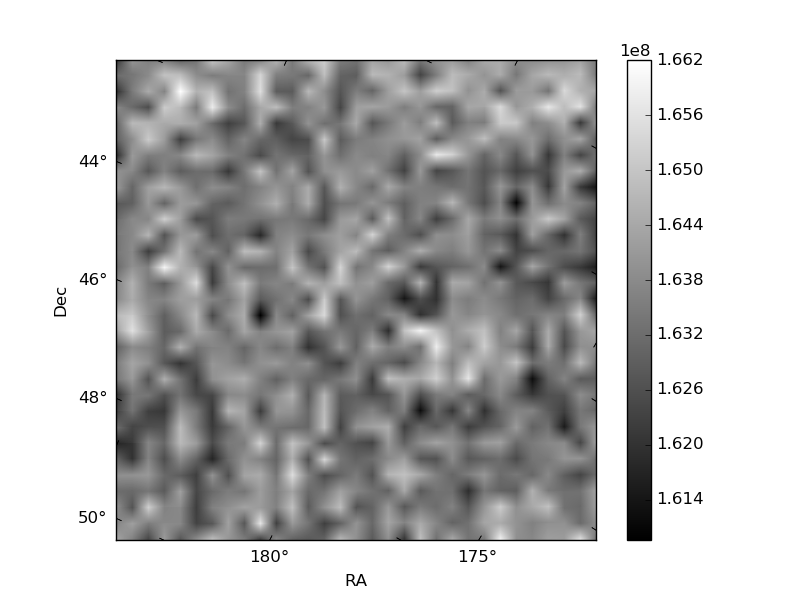
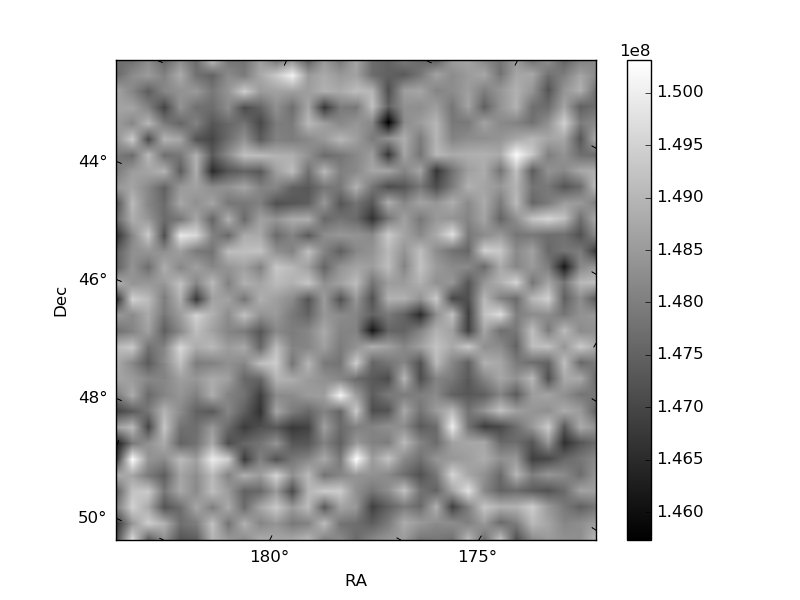
Histogram calculated using DETX and DETY for each event in the final _common_clean file
| Quadrant A | 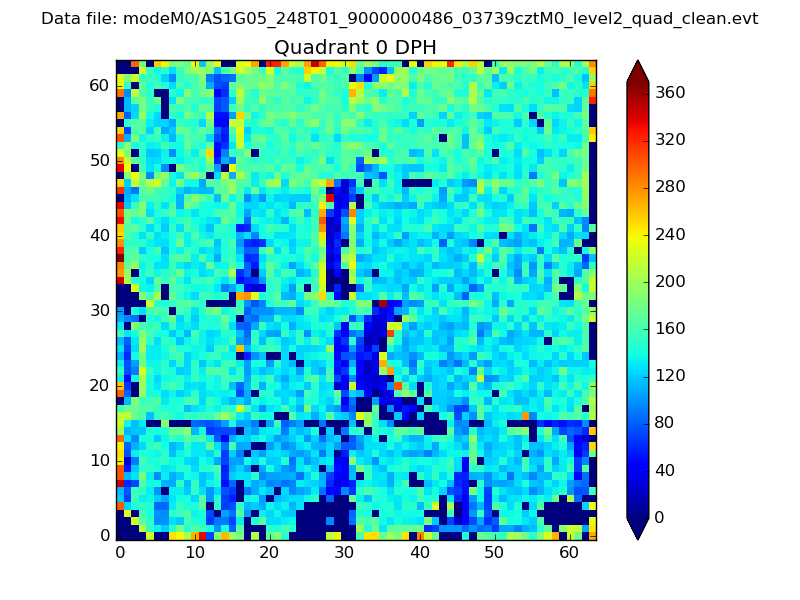 |
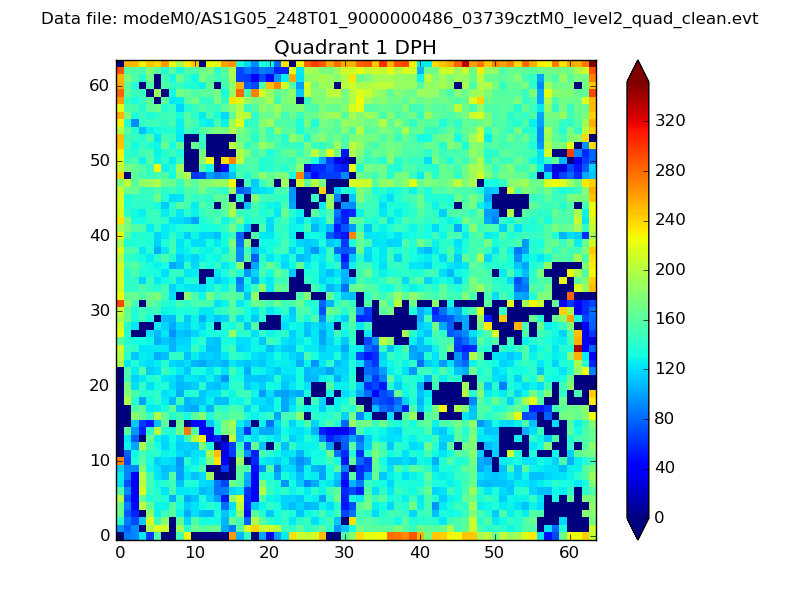 |
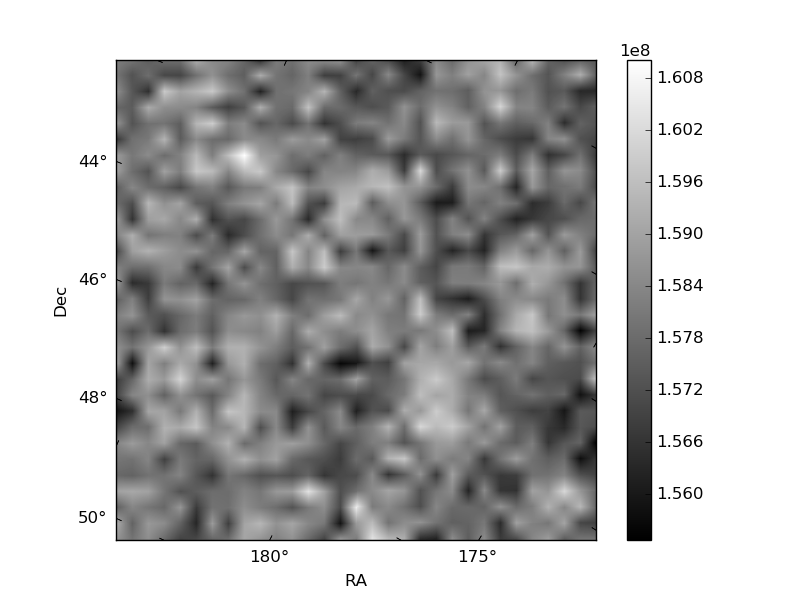
Quadrant B |
|---|---|---|---|
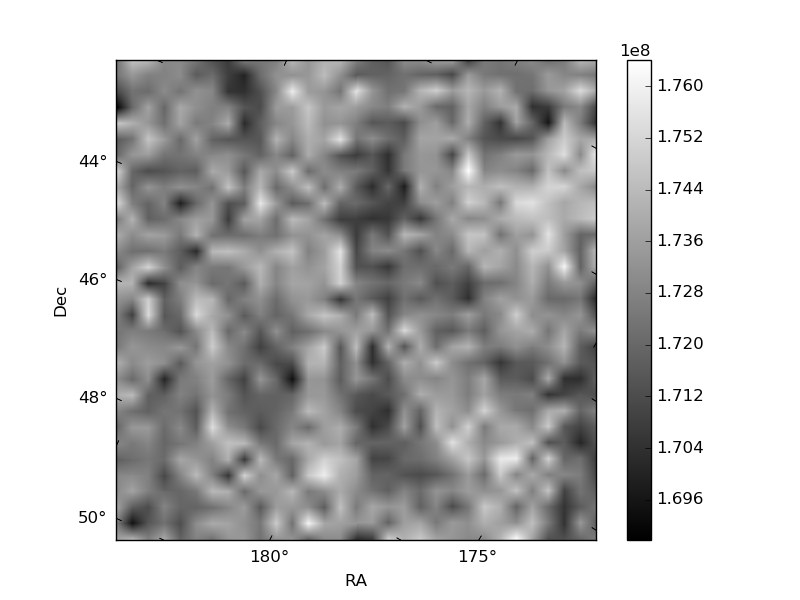
| Quadrant D | 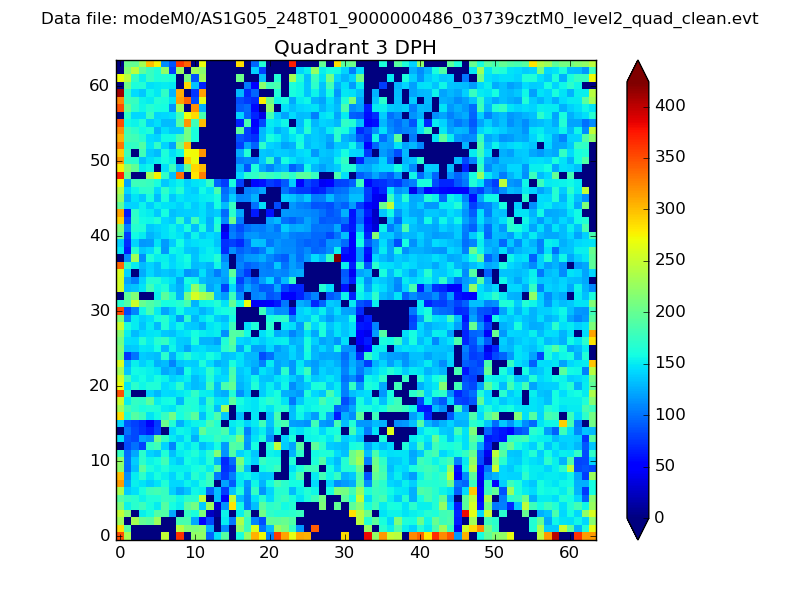 |
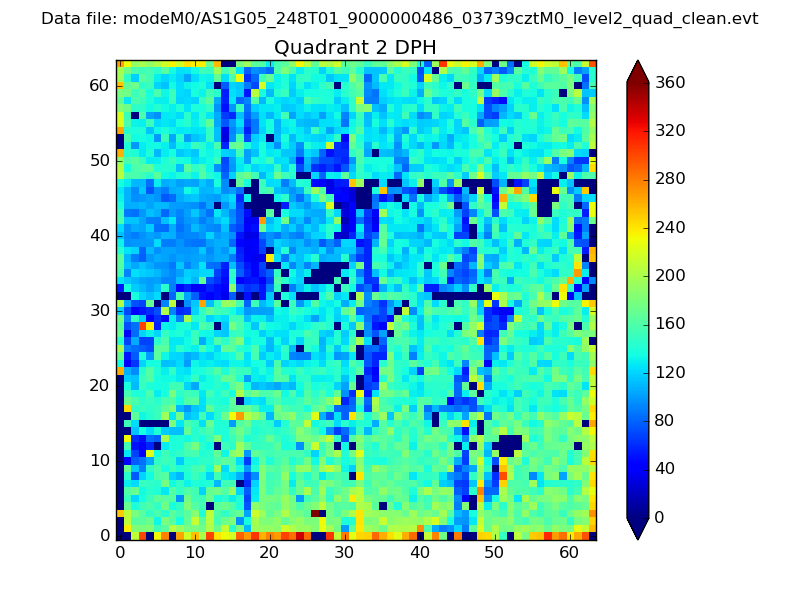 |
Quadrant C |
| Plot type | Count rate plots | Images |
|---|---|---|
| Comparison with Poisson distribution Blue bars denote a histogram of data divided into 1 sec bins. Red curve is a Poisson curve with rate = median count rate of data. |
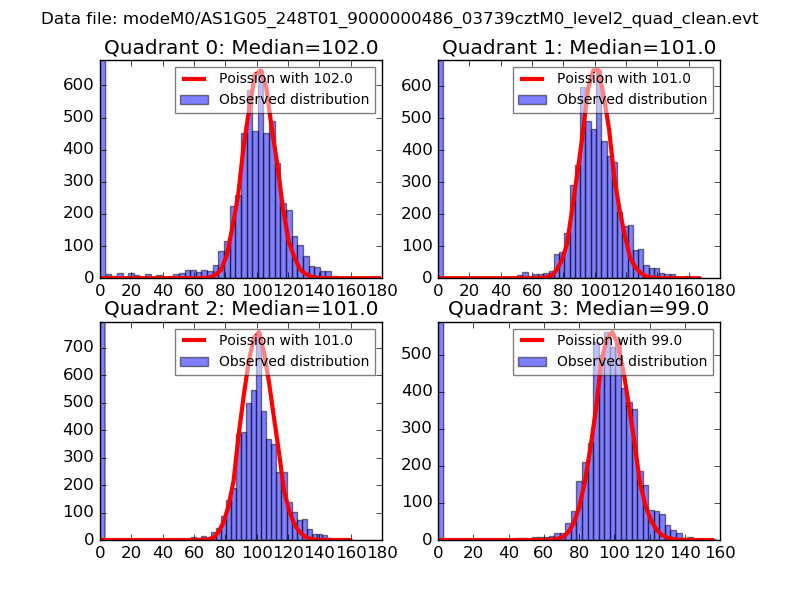 |
 |
| Quadrant-wise count rates Data is divided into 100 sec bins |
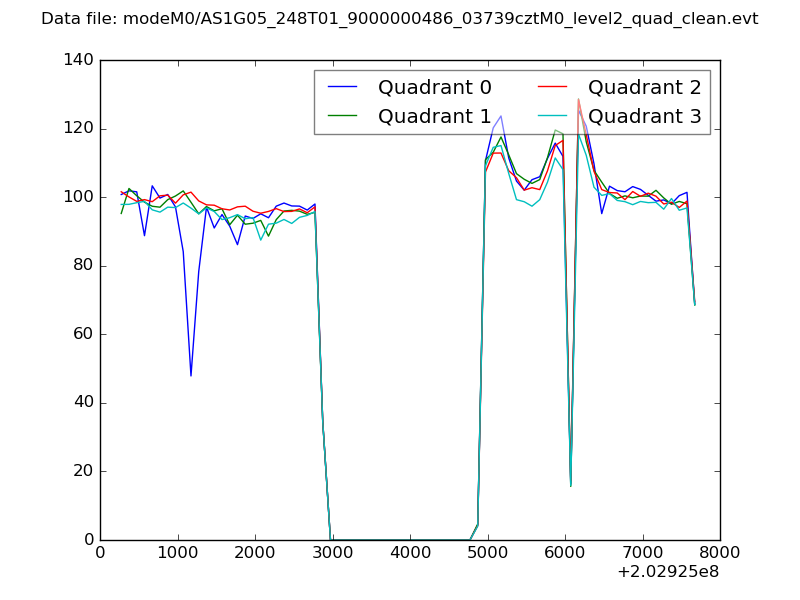 |
|
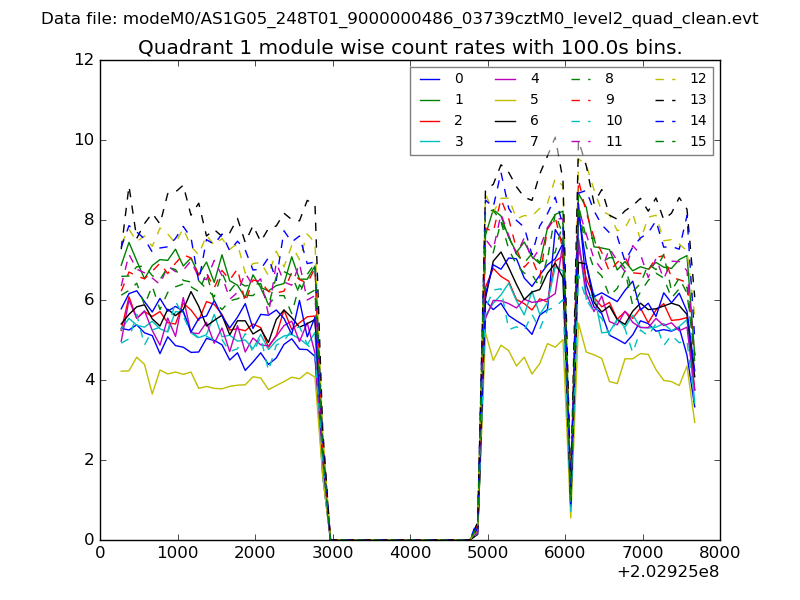
| Module-wise count rates for Quadrant A Data is divided into 100 sec bins |
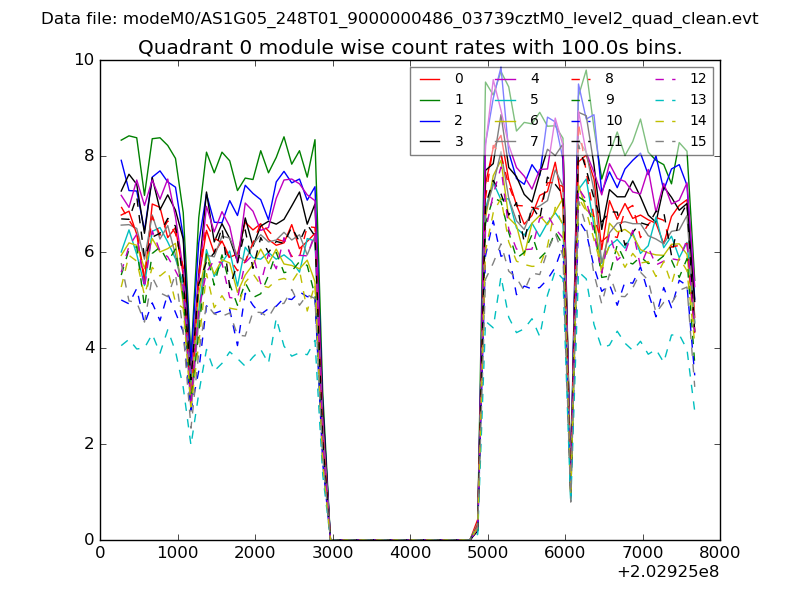 |
 |
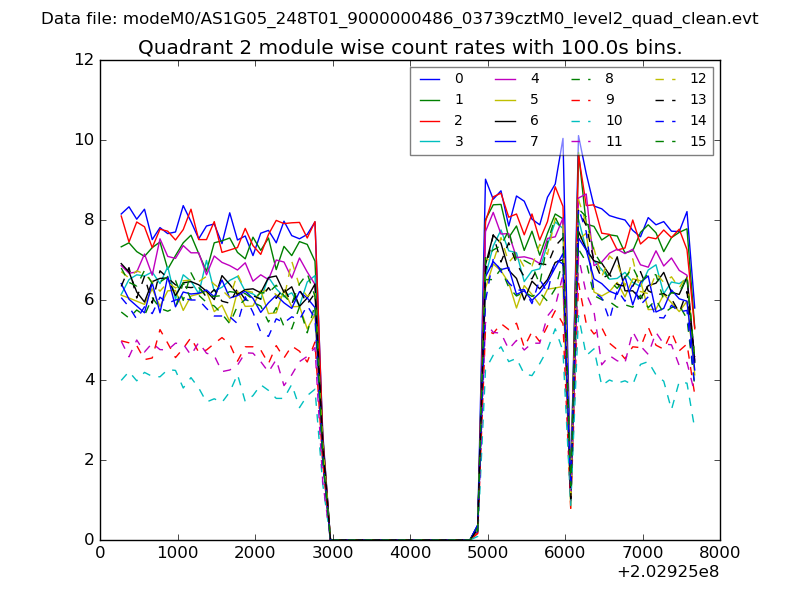
| Module-wise count rates for Quadrant B Data is divided into 100 sec bins |
 |
 |
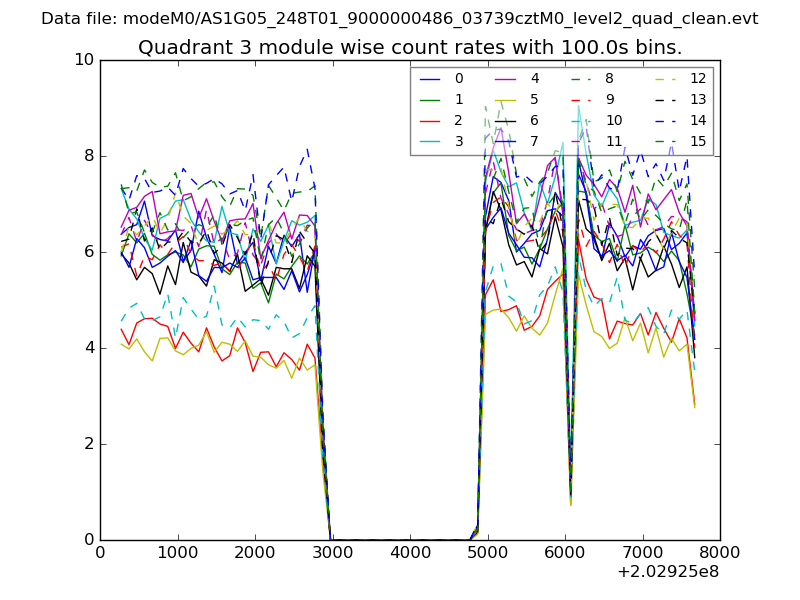
| Module-wise count rates for Quadrant C Data is divided into 100 sec bins |
 |
 |
| Module-wise count rates for Quadrant D Data is divided into 100 sec bins |
 |
 |
| Parameter | Plot |
|---|---|
| CZT HV Monitor | 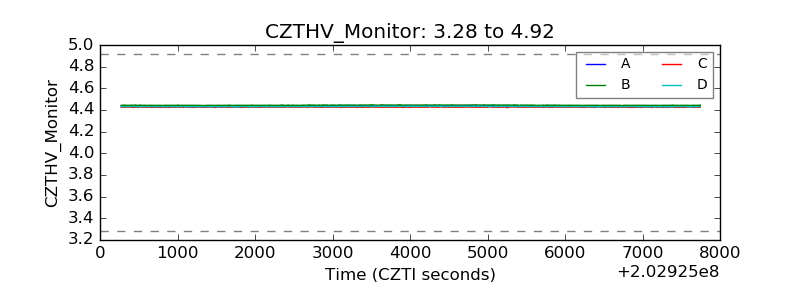 |
| D_VDD | 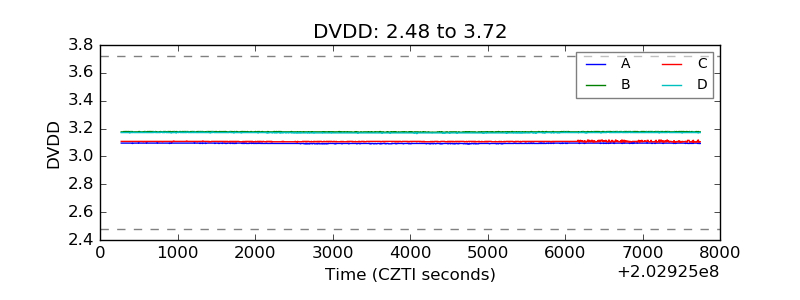 |
| Temperature 1 | 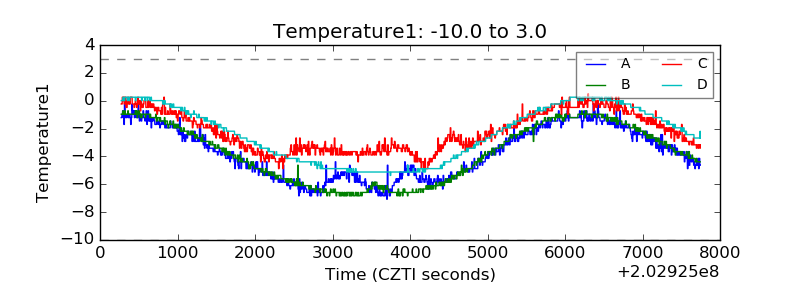 |
| Veto HV Monitor | 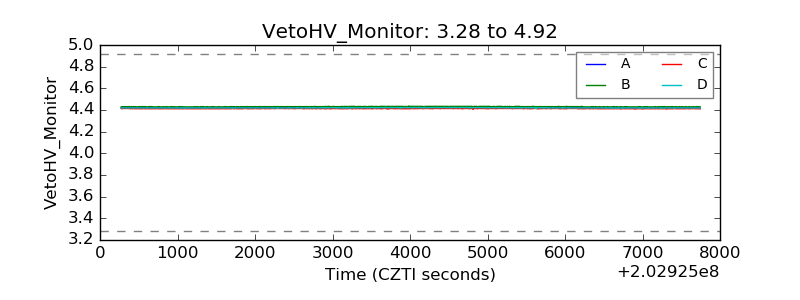 |
| Veto LLD | 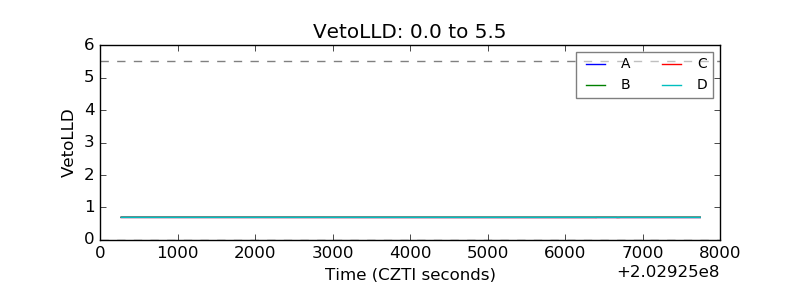 |
| Alpha Counter | 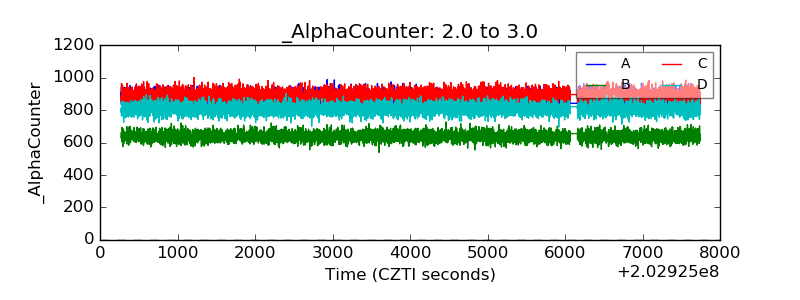 |
| _CPM_Rate | 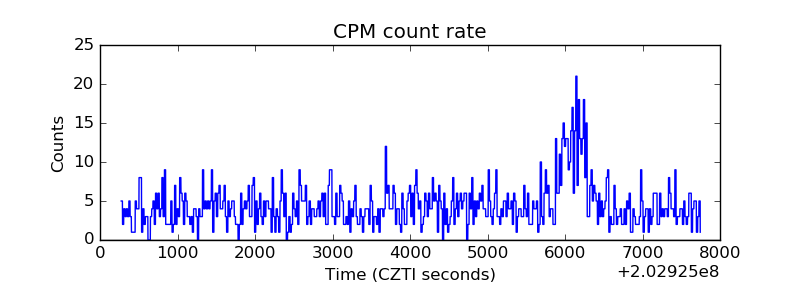 |
| CZT Counter | 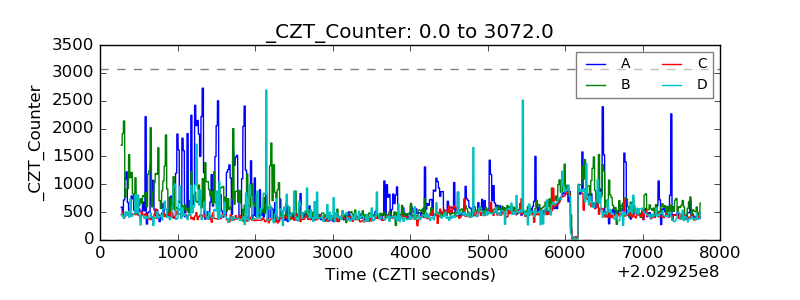 |
| +2.5 Volts monitor | 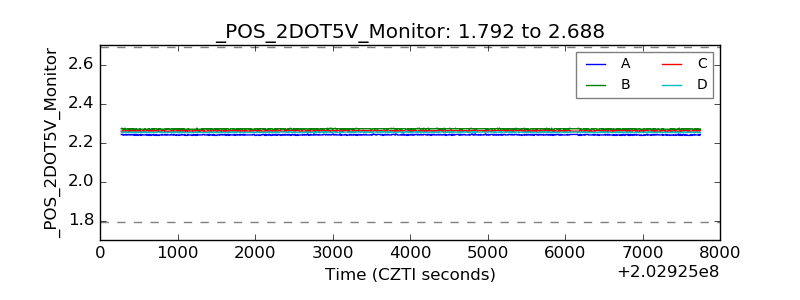 |
| +5 Volts monitor |  |
| Veto Counter | 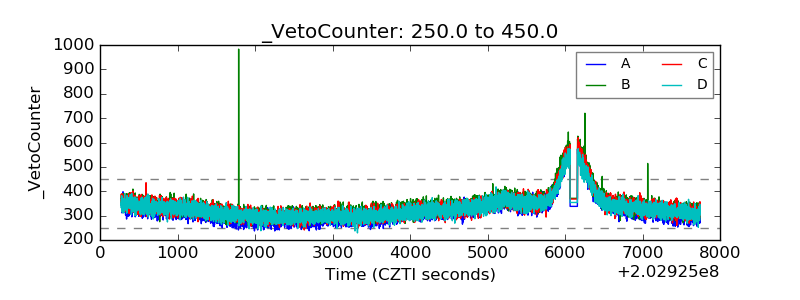 |