| Param | Original file | Final file |
|---|---|---|
| Filename | modeM0/AS1G05_248T01_9000000486_03740cztM0_level2.evt | modeM0/AS1G05_248T01_9000000486_03740cztM0_level2_quad_clean.evt |
| Size (bytes) | 576,123,840 | 95,627,520 |
| Size | 549.4 MB | 91.2 MB |
| Events in quadrant A | 4,222,989 | 593,168 |
| Events in quadrant B | 4,930,585 | 591,596 |
| Events in quadrant C | 3,562,564 | 591,072 |
| Events in quadrant D | 4,201,583 | 576,566 |
| Mode SS | |||
|---|---|---|---|
| Quadrant | BADHDUFLAG | Total packets | Discarded packets |
| A | 0 | 162 | 0 |
| B | 0 | 162 | 0 |
| C | 0 | 162 | 0 |
| D | 0 | 162 | 0 |
| Mode M9 | |||
|---|---|---|---|
| Quadrant | BADHDUFLAG | Total packets | Discarded packets |
| A | 0 | 4 | 0 |
| B | 0 | 4 | 0 |
| C | 0 | 4 | 0 |
| D | 0 | 4 | 0 |
| Mode M0 | |||
|---|---|---|---|
| Quadrant | BADHDUFLAG | Total packets | Discarded packets |
| A | 0 | 18053 | 3 |
| B | 0 | 19942 | 2 |
| C | 0 | 16289 | 2 |
| D | 0 | 18067 | 2 |
| Quadrant | Total seconds | Saturated seconds | Saturation percentage |
|---|---|---|---|
| A | 7809 | 248 | 3.175823% |
| B | 7809 | 294 | 3.764887% |
| C | 7809 | 62 | 0.793956% |
| D | 7809 | 119 | 1.523883% |
Noise dominated data is calculated using 1-second bins in cleaned event files. If a bin has >2000 counts, and if more than 50% of those come from <1% of pixels, then it is considered to be noise-dominated and hence unusable.
| Quadrant | # 1 sec bins | Bins with >0 counts | Bins with >2000 counts | High rate bins dominated by noise | Noise dominated (total time) | Noise dominated (detector-on time) | Marked lightcurve |
|---|---|---|---|---|---|---|---|
| A | 8269 | 7811 | 86 | 86 | 1.04% | 1.10% | 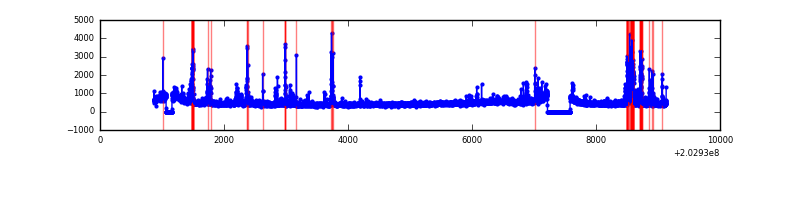 |
| B | 8269 | 7811 | 40 | 40 | 0.48% | 0.51% | 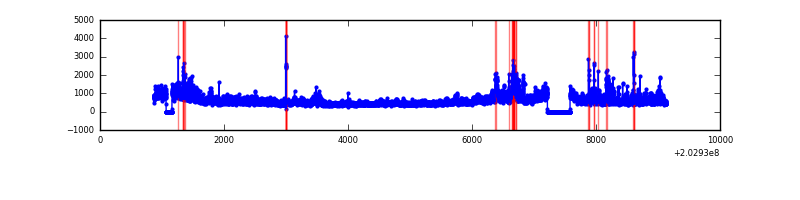 |
| C | 8269 | 7811 | 0 | 0 | 0.00% | 0.00% | 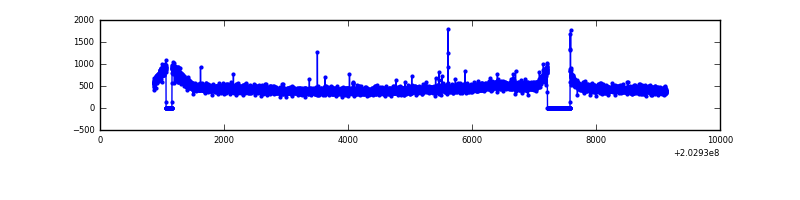 |
| D | 8269 | 7811 | 36 | 36 | 0.44% | 0.46% | 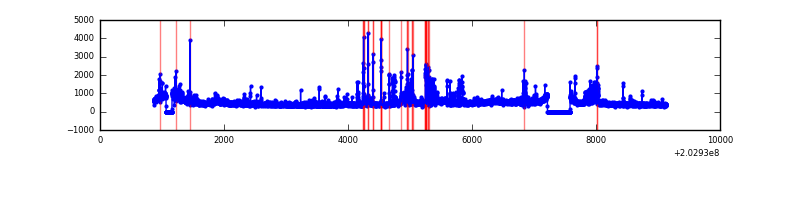 |
Top three noisy pixels from each quadrant. If the there are fewer than three noisy pixels in the level2.evt file, extra rows are filled as -1
| Pixel properties | Quadrant properties | ||||||
|---|---|---|---|---|---|---|---|
| Quadrant | DetID | PixID | Counts | Sigma | Mean | Median | Sigma |
| A | 0 | 118 | 226547 | 1181.69 | 913 | 889 | 191.0 |
| A | 13 | 251 | 192226 | 1001.96 | 913 | 889 | 191.0 |
| A | 8 | 15 | 119031 | 618.67 | 913 | 889 | 191.0 |
| B | 0 | 173 | 662976 | 3659.01 | 926 | 902 | 180.9 |
| B | 15 | 204 | 460533 | 2540.19 | 926 | 902 | 180.9 |
| B | 14 | 167 | 84669 | 462.95 | 926 | 902 | 180.9 |
| C | 8 | 128 | 15448 | 69.11 | 898 | 901 | 210.5 |
| C | 12 | 4 | 12364 | 54.46 | 898 | 901 | 210.5 |
| C | 8 | 112 | 8636 | 36.75 | 898 | 901 | 210.5 |
| D | 1 | 20 | 539609 | 2470.98 | 894 | 866 | 218.0 |
| D | 13 | 223 | 62847 | 284.28 | 894 | 866 | 218.0 |
| D | 9 | 35 | 57806 | 261.16 | 894 | 866 | 218.0 |
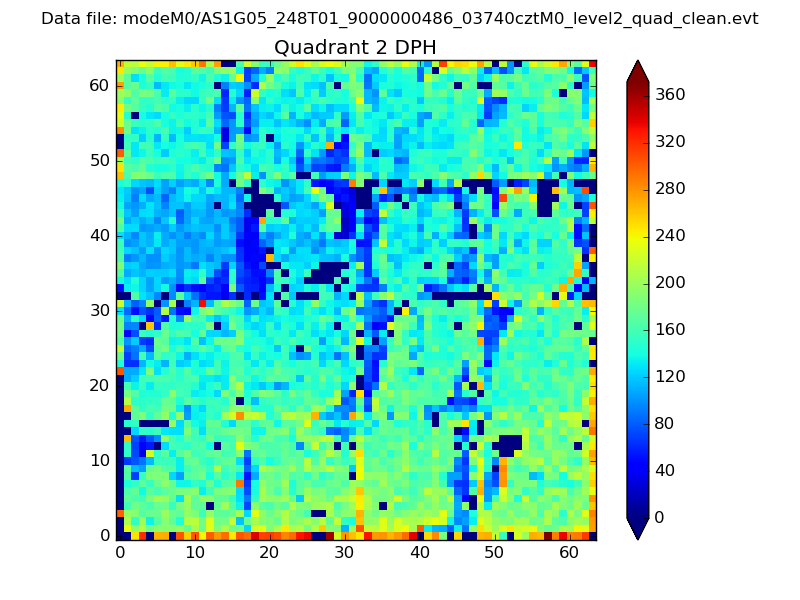
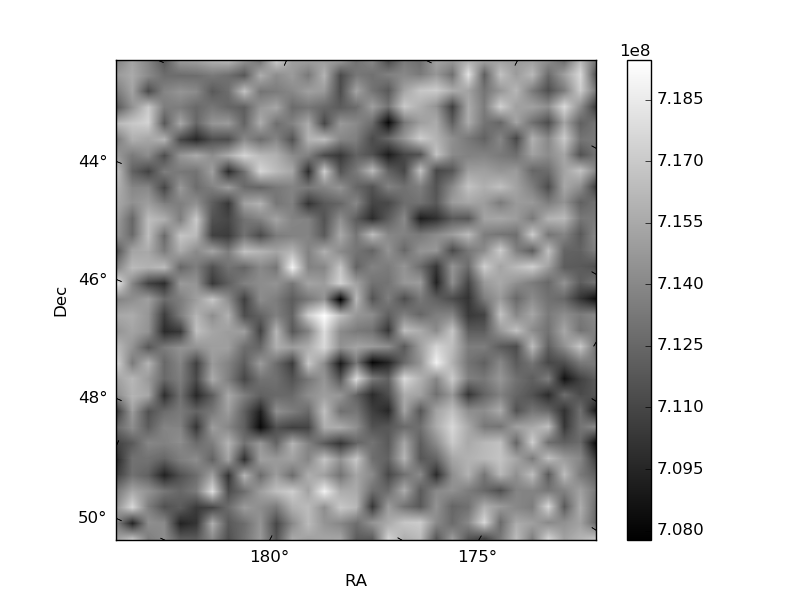
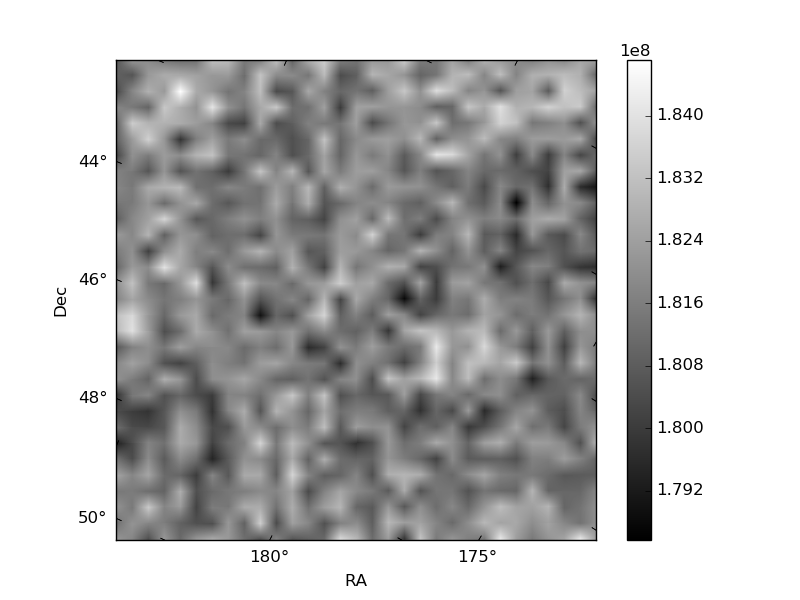
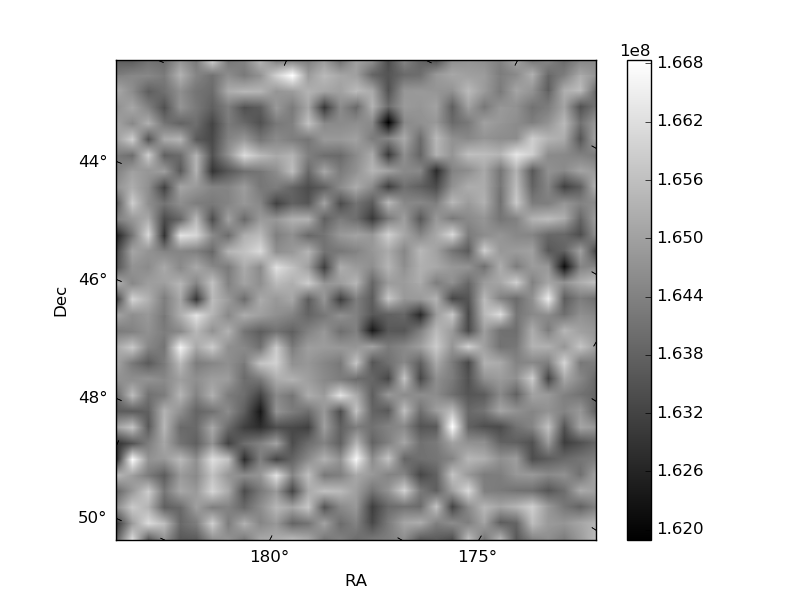
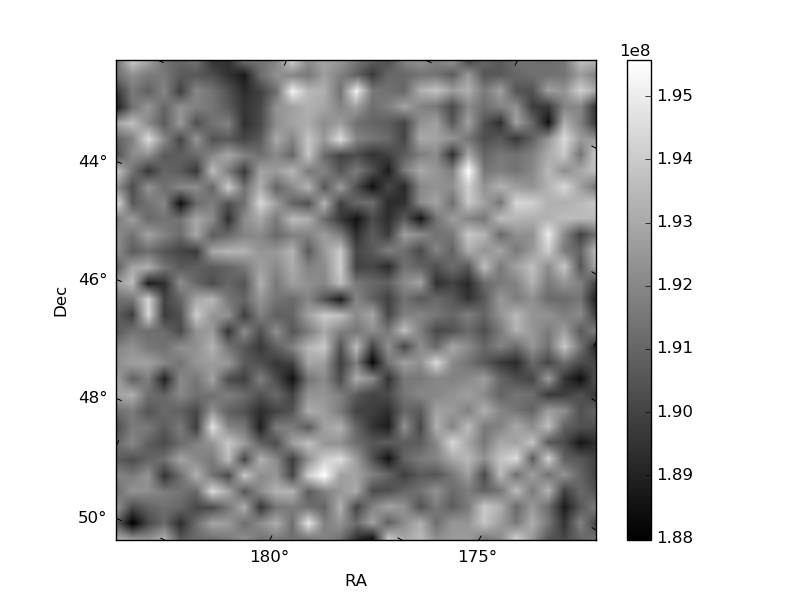
Histogram calculated using DETX and DETY for each event in the final _common_clean file
| Quadrant A | 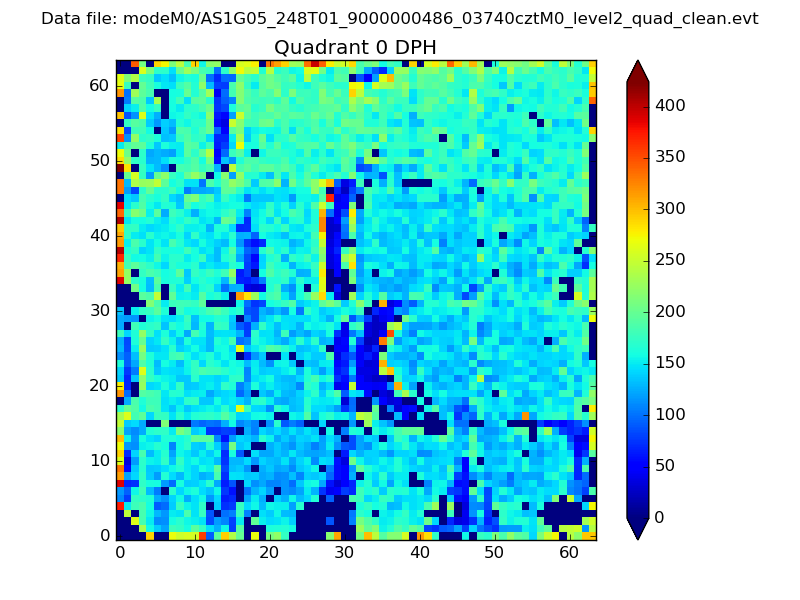 |
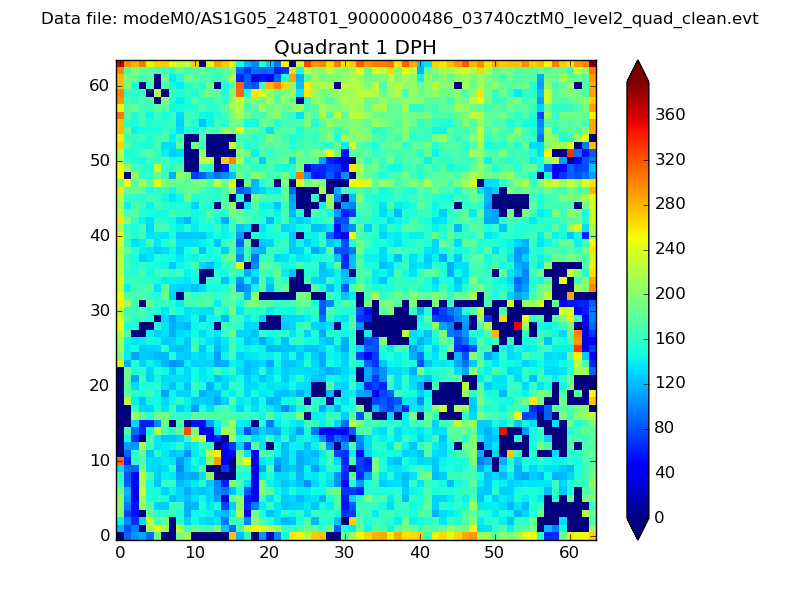 |
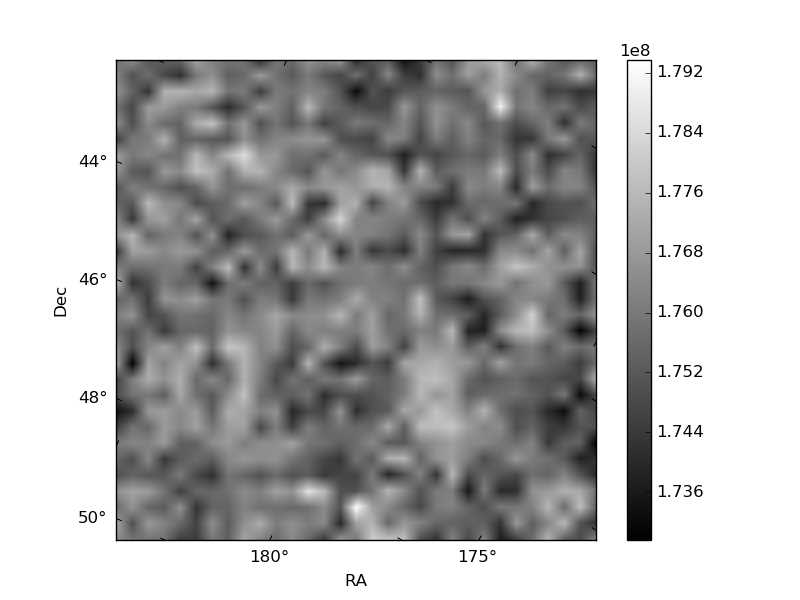
Quadrant B |
|---|---|---|---|
| Quadrant D | 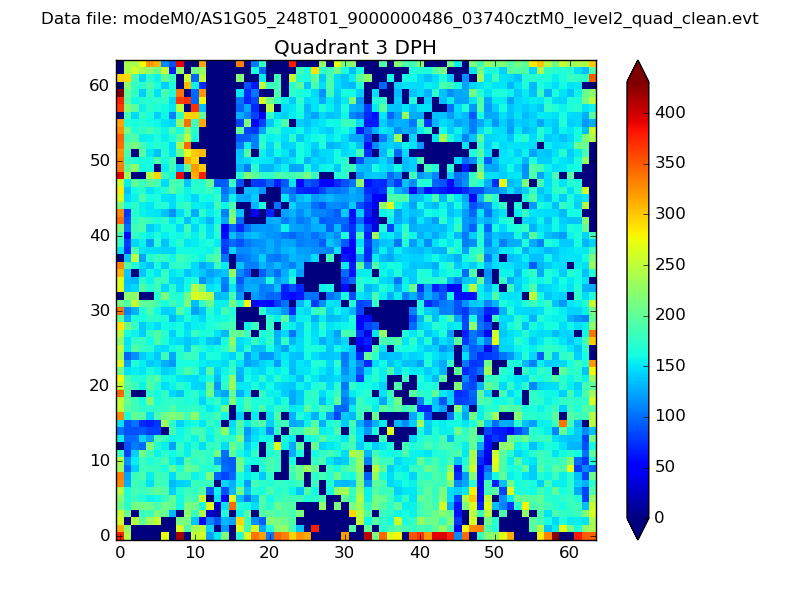 |
 |
Quadrant C |
| Plot type | Count rate plots | Images |
|---|---|---|
| Comparison with Poisson distribution Blue bars denote a histogram of data divided into 1 sec bins. Red curve is a Poisson curve with rate = median count rate of data. |
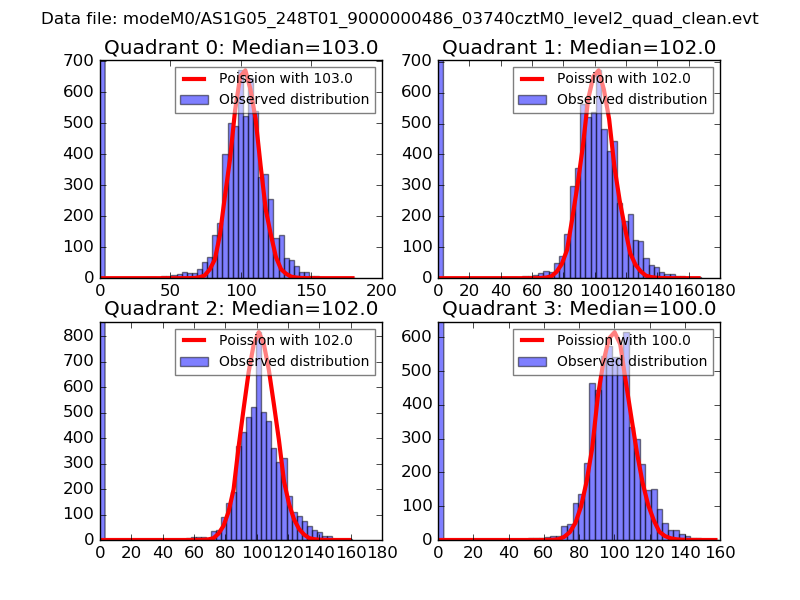 |
 |
| Quadrant-wise count rates Data is divided into 100 sec bins |
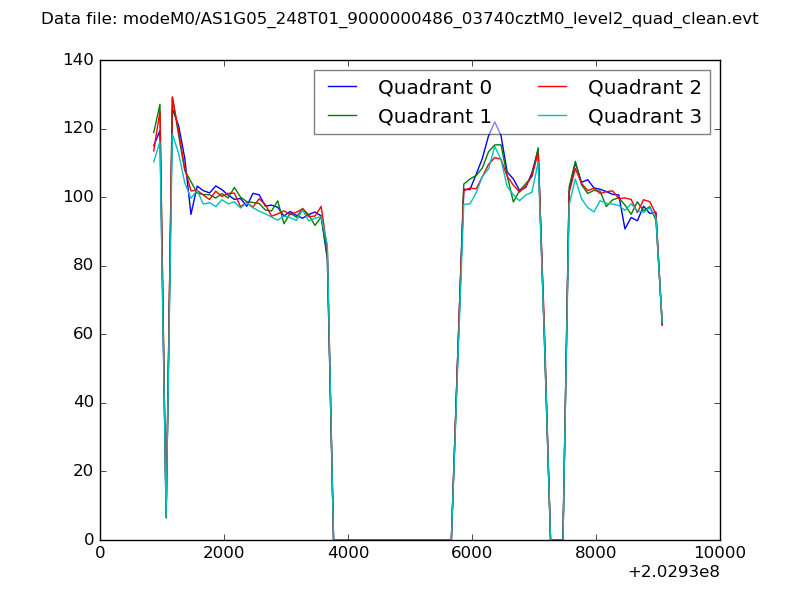 |
|
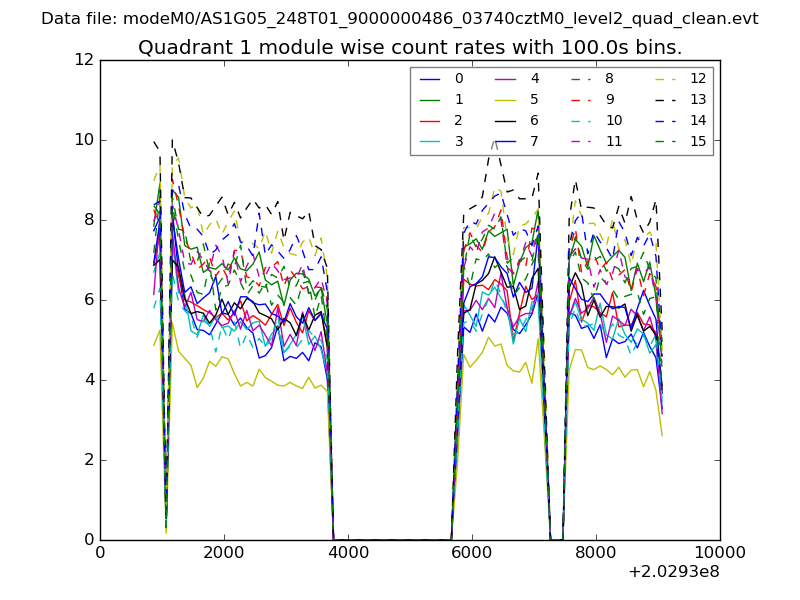
| Module-wise count rates for Quadrant A Data is divided into 100 sec bins |
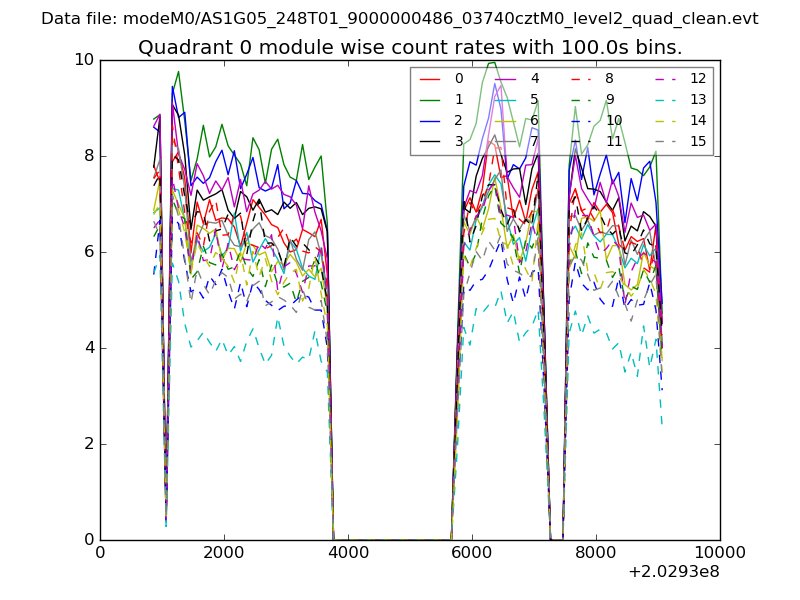 |
 |
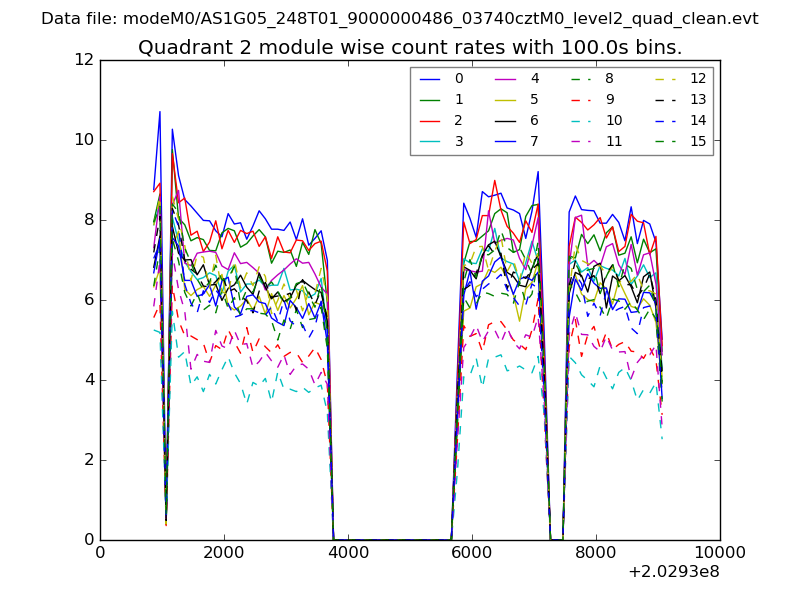
| Module-wise count rates for Quadrant B Data is divided into 100 sec bins |
 |
 |
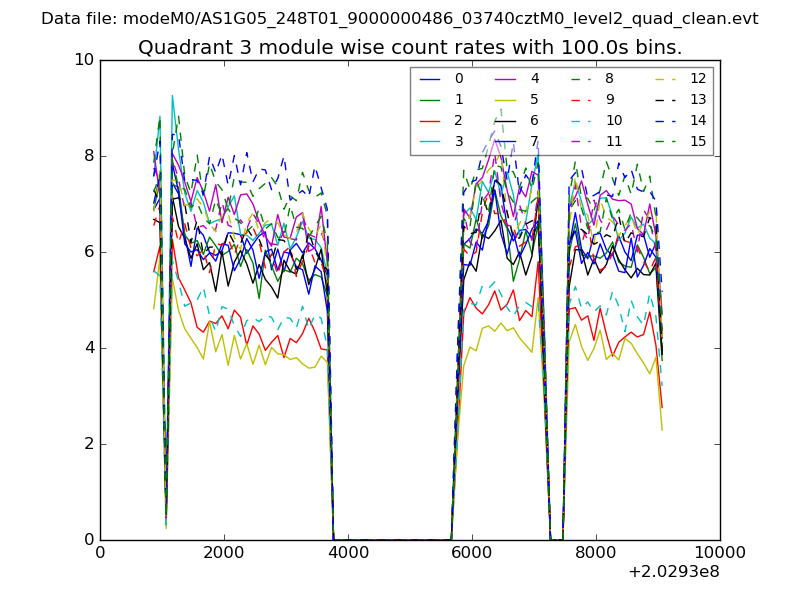
| Module-wise count rates for Quadrant C Data is divided into 100 sec bins |
 |
 |
| Module-wise count rates for Quadrant D Data is divided into 100 sec bins |
 |
 |
| Parameter | Plot |
|---|---|
| CZT HV Monitor | 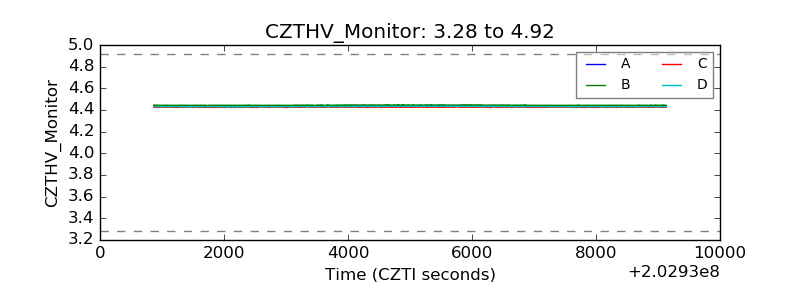 |
| D_VDD | 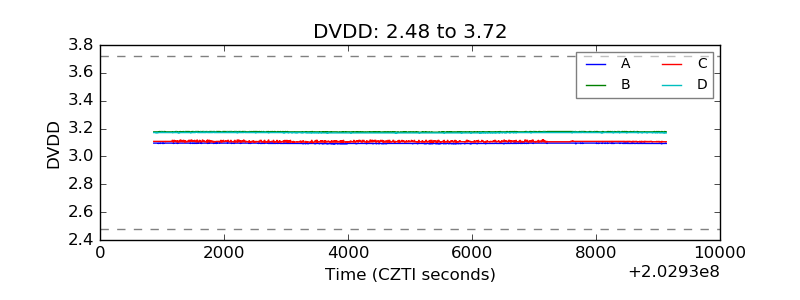 |
| Temperature 1 | 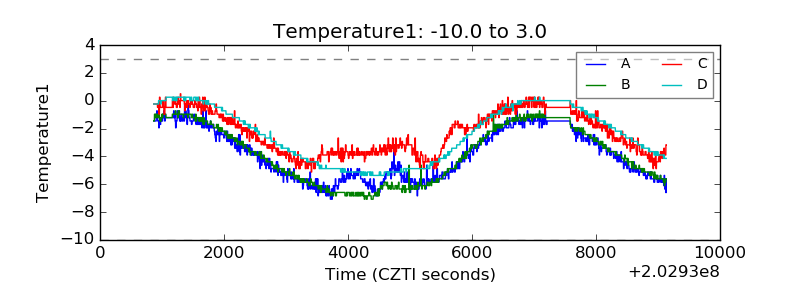 |
| Veto HV Monitor | 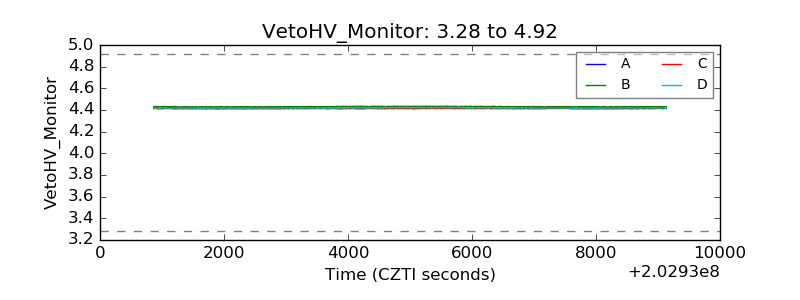 |
| Veto LLD | 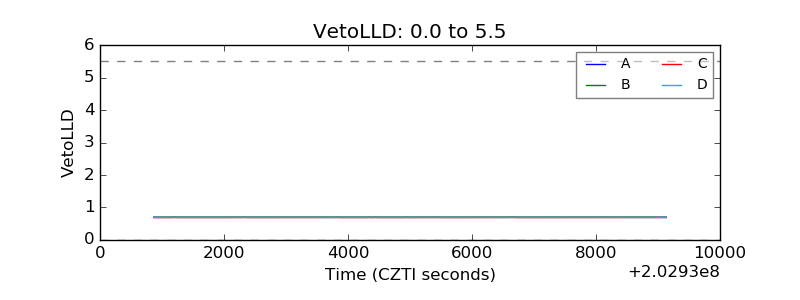 |
| Alpha Counter | 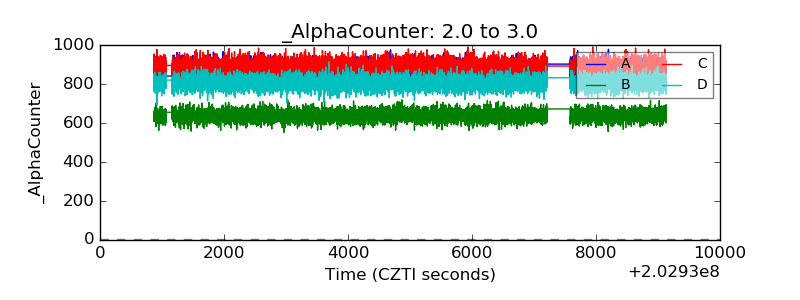 |
| _CPM_Rate |  |
| CZT Counter | 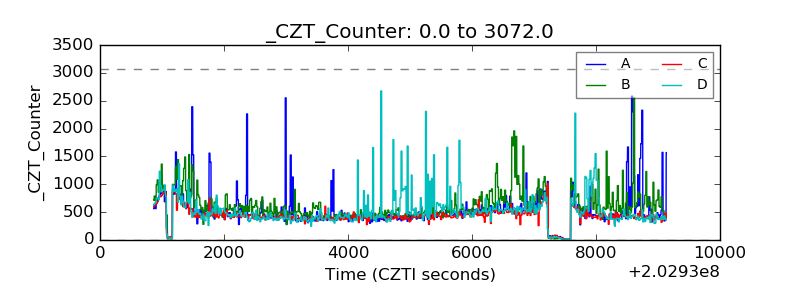 |
| +2.5 Volts monitor |  |
| +5 Volts monitor |  |
| Veto Counter | 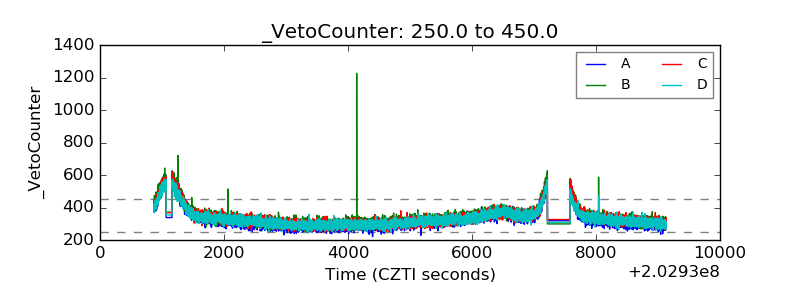 |