| Param | Original file | Final file |
|---|---|---|
| Filename | modeM0/AS1G05_248T01_9000000486_03742cztM0_level2.evt | modeM0/AS1G05_248T01_9000000486_03742cztM0_level2_quad_clean.evt |
| Size (bytes) | 599,425,920 | 89,890,560 |
| Size | 571.7 MB | 85.7 MB |
| Events in quadrant A | 4,956,837 | 531,780 |
| Events in quadrant B | 4,811,194 | 531,339 |
| Events in quadrant C | 3,717,920 | 532,023 |
| Events in quadrant D | 4,073,069 | 518,178 |
| Mode SS | |||
|---|---|---|---|
| Quadrant | BADHDUFLAG | Total packets | Discarded packets |
| A | 0 | 178 | 0 |
| B | 0 | 178 | 0 |
| C | 0 | 178 | 0 |
| D | 0 | 178 | 0 |
| Mode M9 | |||
|---|---|---|---|
| Quadrant | BADHDUFLAG | Total packets | Discarded packets |
| A | 0 | 6 | 0 |
| B | 0 | 6 | 0 |
| C | 0 | 6 | 0 |
| D | 0 | 7 | 0 |
| Mode M0 | |||
|---|---|---|---|
| Quadrant | BADHDUFLAG | Total packets | Discarded packets |
| A | 0 | 20842 | 3 |
| B | 0 | 20341 | 2 |
| C | 0 | 17762 | 2 |
| D | 0 | 18980 | 2 |
| Quadrant | Total seconds | Saturated seconds | Saturation percentage |
|---|---|---|---|
| A | 8763 | 168 | 1.917152% |
| B | 8763 | 91 | 1.038457% |
| C | 8763 | 16 | 0.182586% |
| D | 8763 | 41 | 0.467876% |
Noise dominated data is calculated using 1-second bins in cleaned event files. If a bin has >2000 counts, and if more than 50% of those come from <1% of pixels, then it is considered to be noise-dominated and hence unusable.
| Quadrant | # 1 sec bins | Bins with >0 counts | Bins with >2000 counts | High rate bins dominated by noise | Noise dominated (total time) | Noise dominated (detector-on time) | Marked lightcurve |
|---|---|---|---|---|---|---|---|
| A | 9343 | 8764 | 127 | 127 | 1.36% | 1.45% | 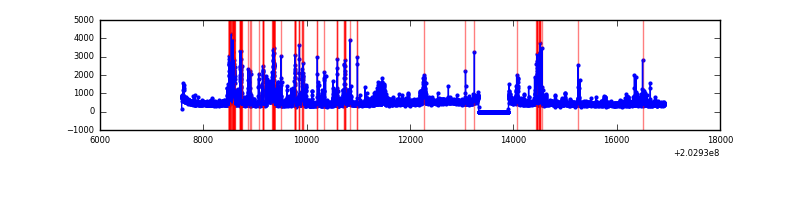 |
| B | 9343 | 8764 | 30 | 30 | 0.32% | 0.34% | 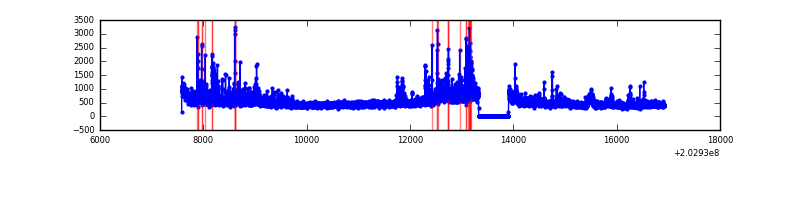 |
| C | 9343 | 8764 | 0 | 0 | 0.00% | 0.00% | 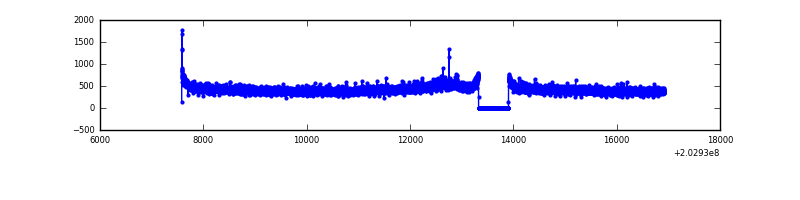 |
| D | 9343 | 8764 | 31 | 31 | 0.33% | 0.35% | 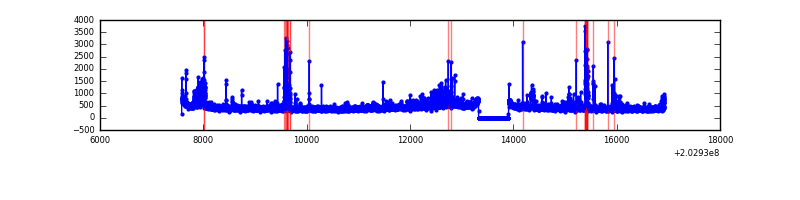 |
Top three noisy pixels from each quadrant. If the there are fewer than three noisy pixels in the level2.evt file, extra rows are filled as -1
| Pixel properties | Quadrant properties | ||||||
|---|---|---|---|---|---|---|---|
| Quadrant | DetID | PixID | Counts | Sigma | Mean | Median | Sigma |
| A | 13 | 251 | 765379 | 3858.13 | 958 | 937 | 198.1 |
| A | 0 | 118 | 230446 | 1158.33 | 958 | 937 | 198.1 |
| A | 8 | 15 | 157206 | 788.69 | 958 | 937 | 198.1 |
| B | 0 | 173 | 477341 | 2509.52 | 978 | 953 | 189.8 |
| B | 15 | 204 | 292705 | 1536.89 | 978 | 953 | 189.8 |
| B | 14 | 167 | 99753 | 520.46 | 978 | 953 | 189.8 |
| C | 2 | 53 | 19533 | 84.53 | 945 | 951 | 219.8 |
| C | 13 | 61 | 7932 | 31.75 | 945 | 951 | 219.8 |
| C | 10 | 65 | 4696 | 17.03 | 945 | 951 | 219.8 |
| D | 1 | 20 | 176915 | 775.33 | 937 | 910 | 227.0 |
| D | 13 | 223 | 96749 | 422.18 | 937 | 910 | 227.0 |
| D | 12 | 217 | 49081 | 212.2 | 937 | 910 | 227.0 |
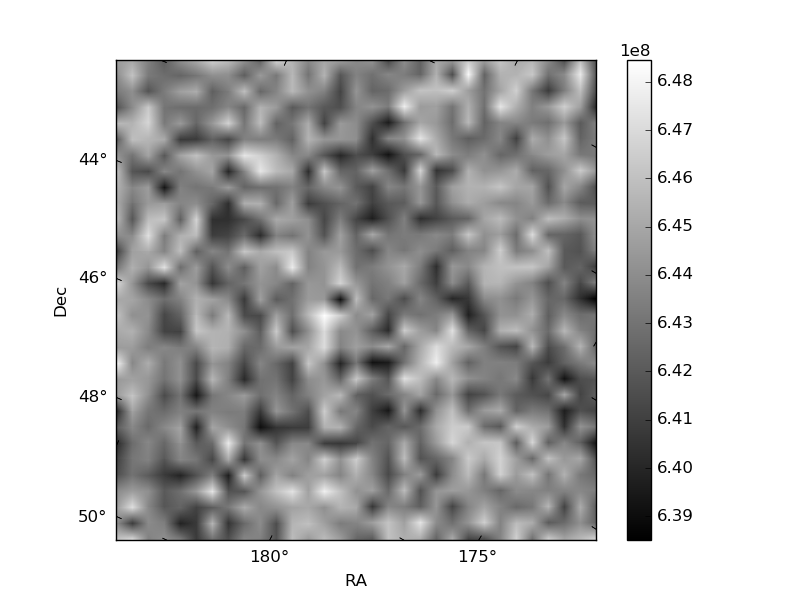
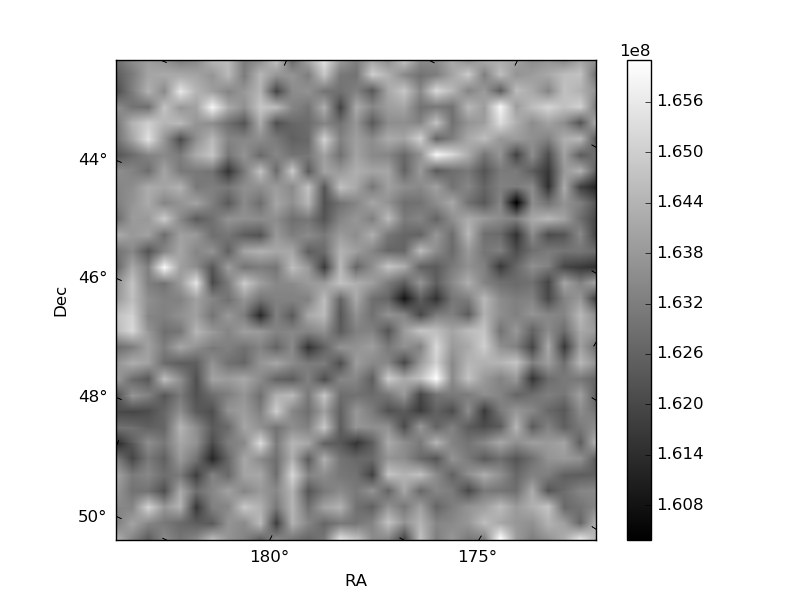
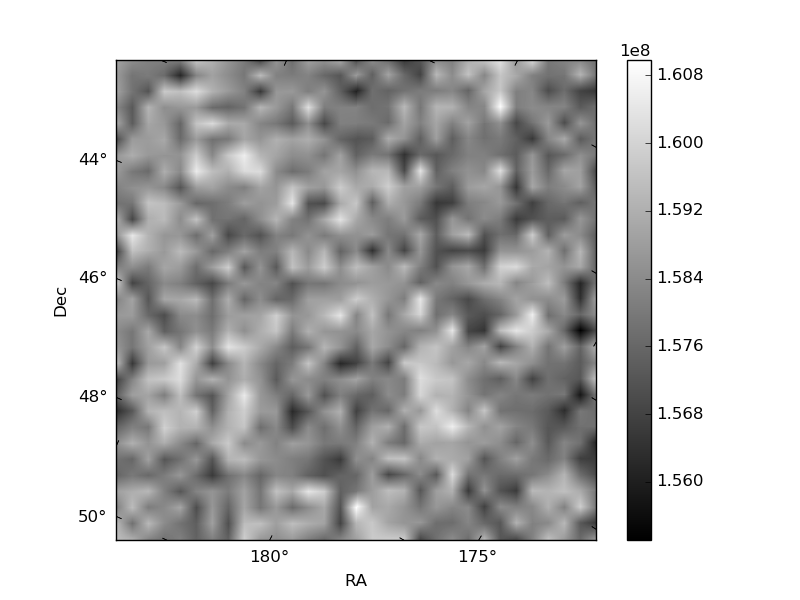
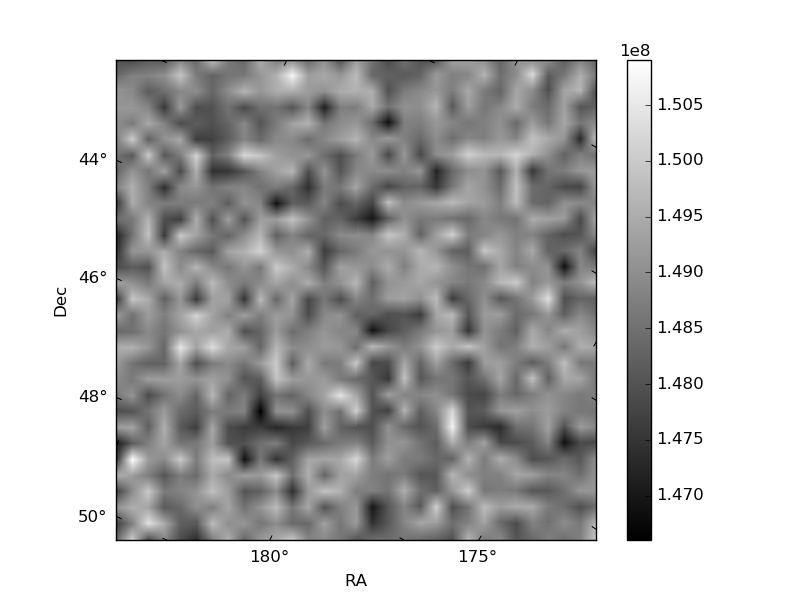
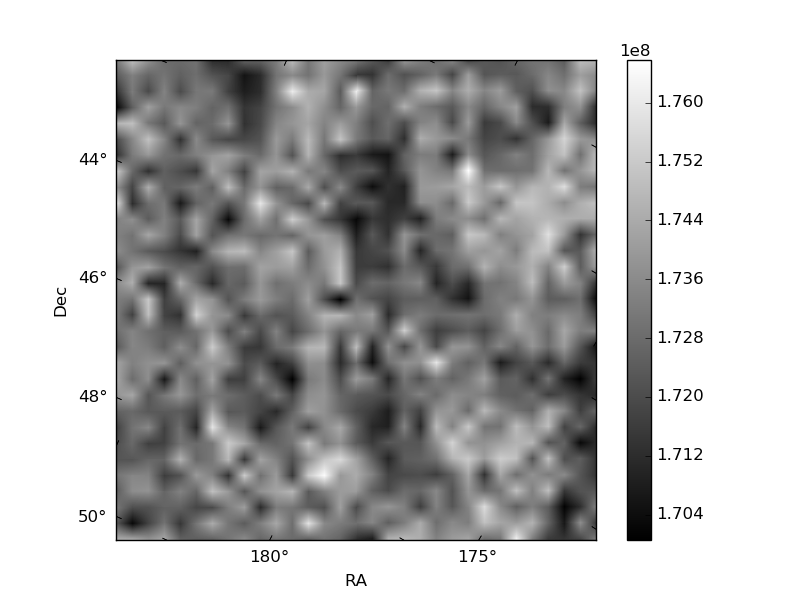
Histogram calculated using DETX and DETY for each event in the final _common_clean file
| Quadrant A | 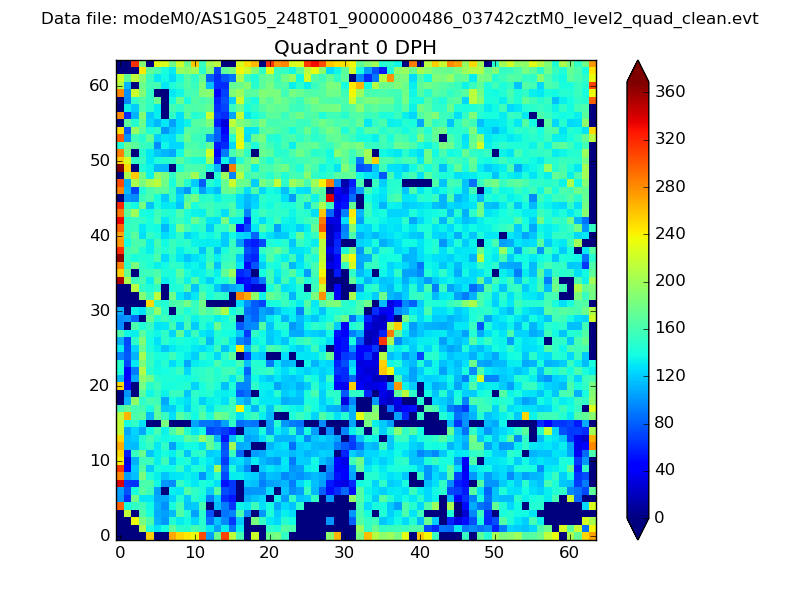 |
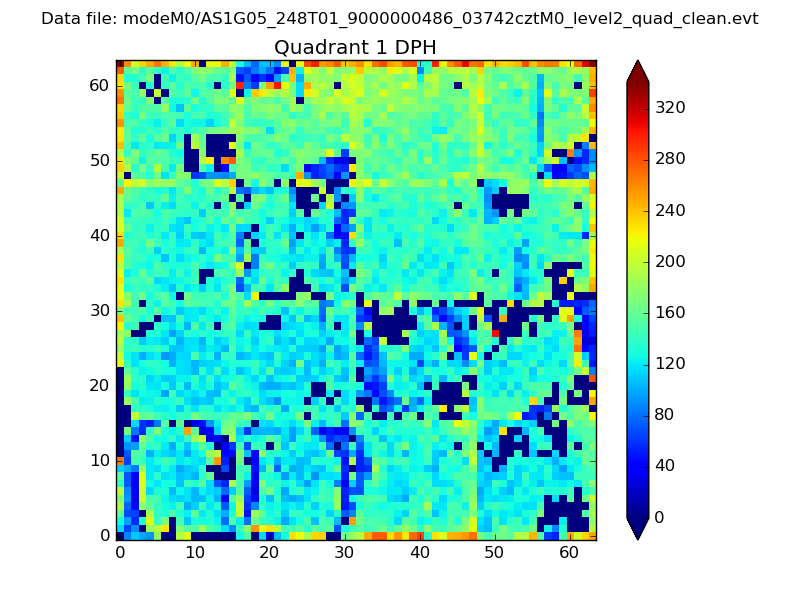 |
Quadrant B |
|---|---|---|---|
| Quadrant D | 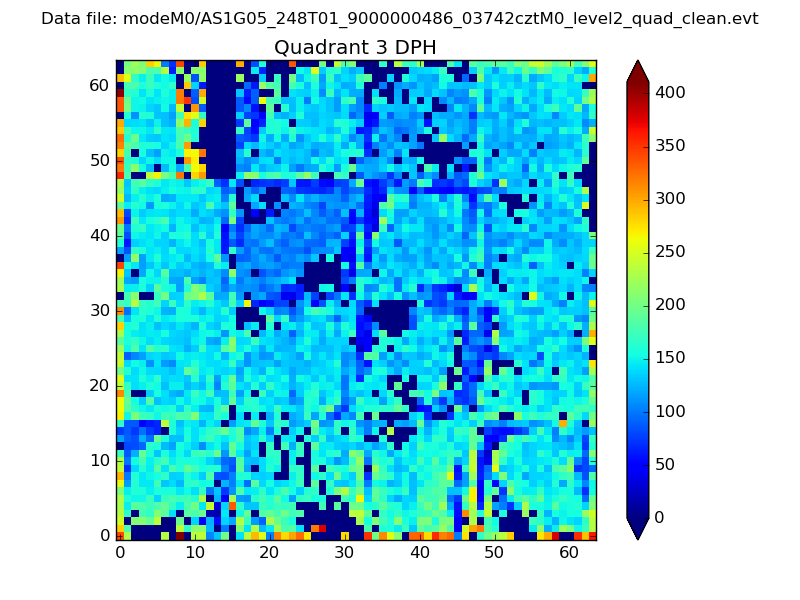 |
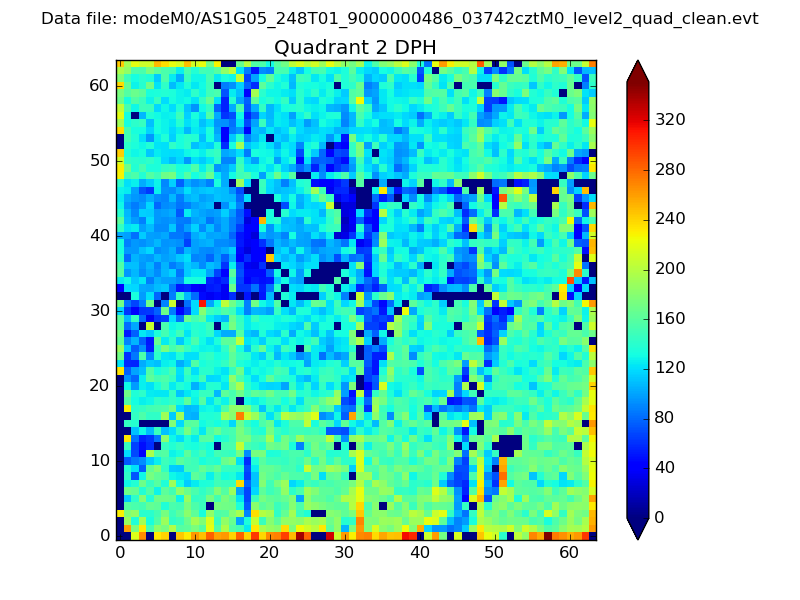 |
Quadrant C |
| Plot type | Count rate plots | Images |
|---|---|---|
| Comparison with Poisson distribution Blue bars denote a histogram of data divided into 1 sec bins. Red curve is a Poisson curve with rate = median count rate of data. |
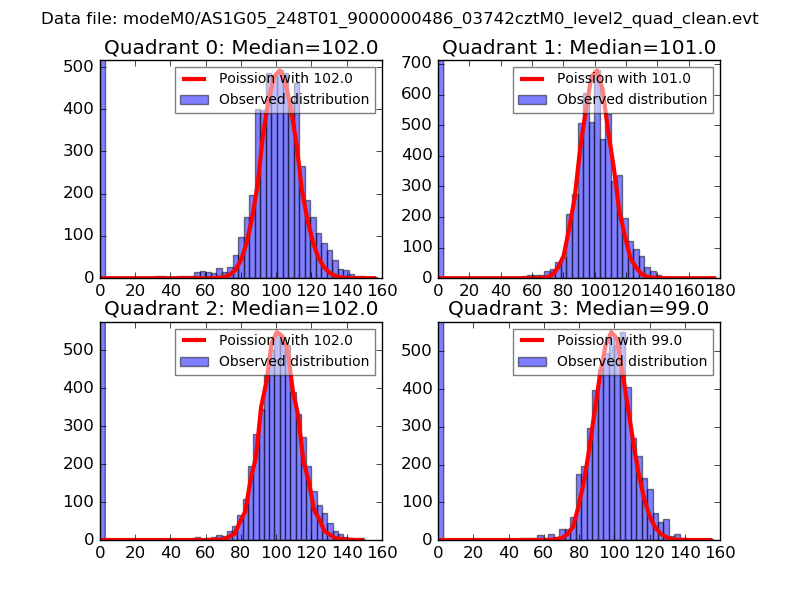 |
 |
| Quadrant-wise count rates Data is divided into 100 sec bins |
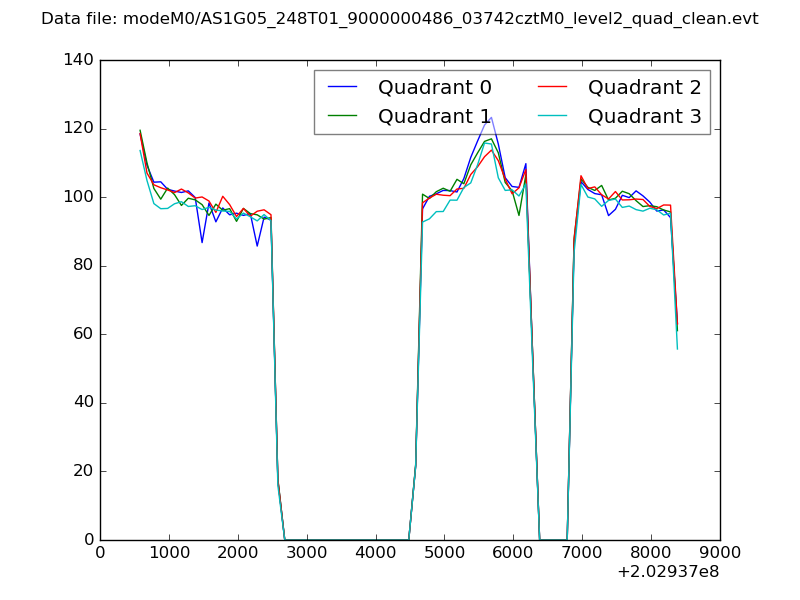 |
|
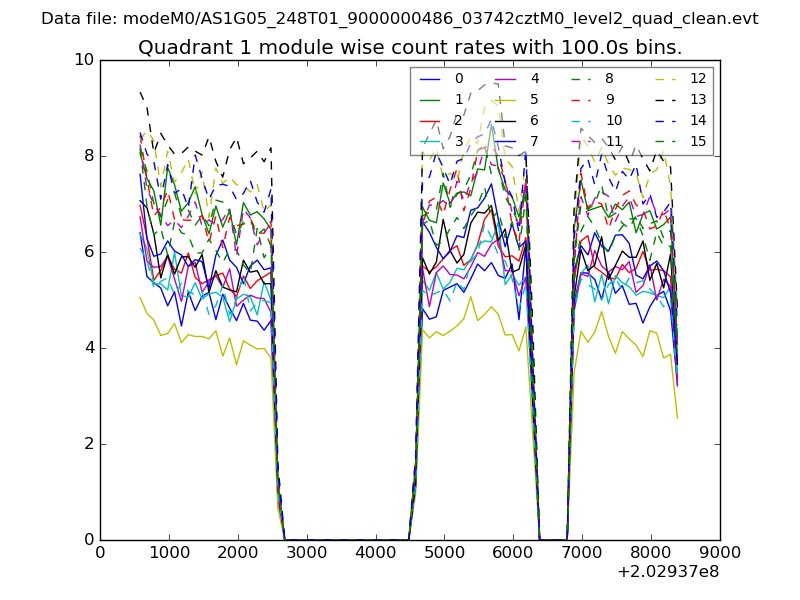
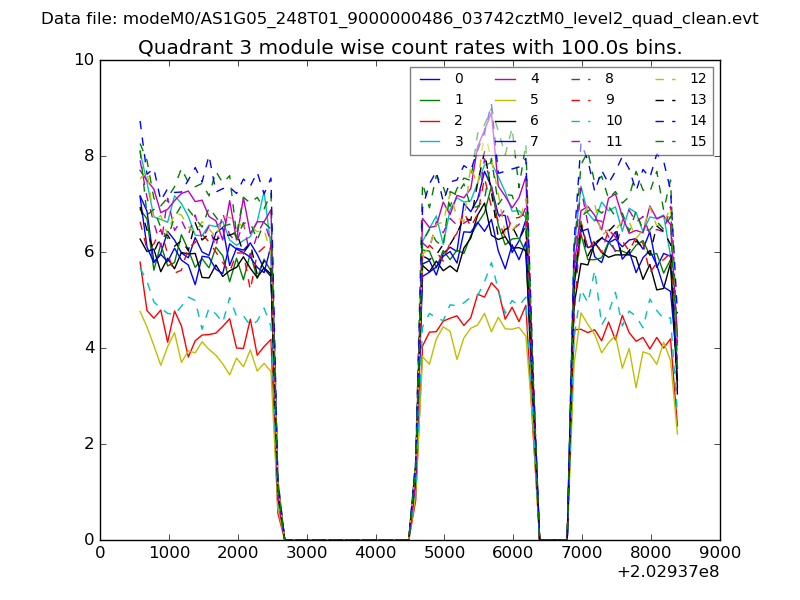
| Module-wise count rates for Quadrant A Data is divided into 100 sec bins |
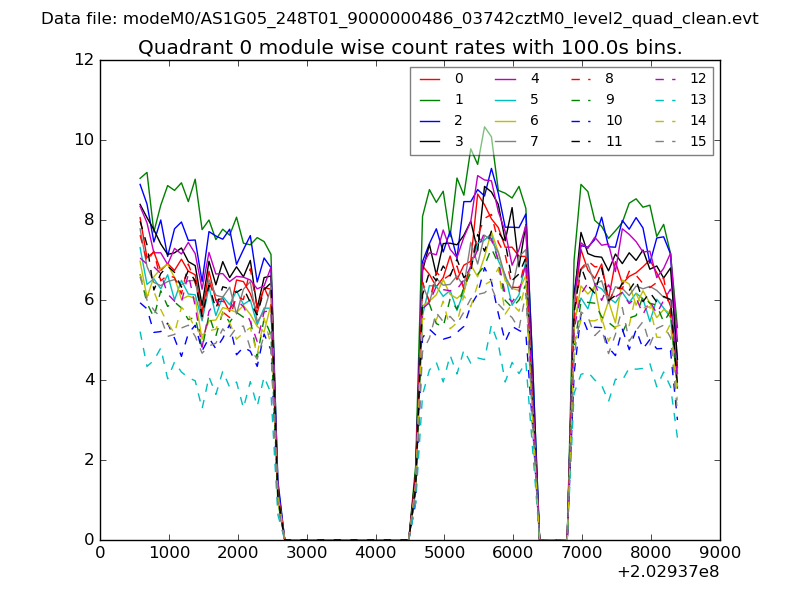 |
 |
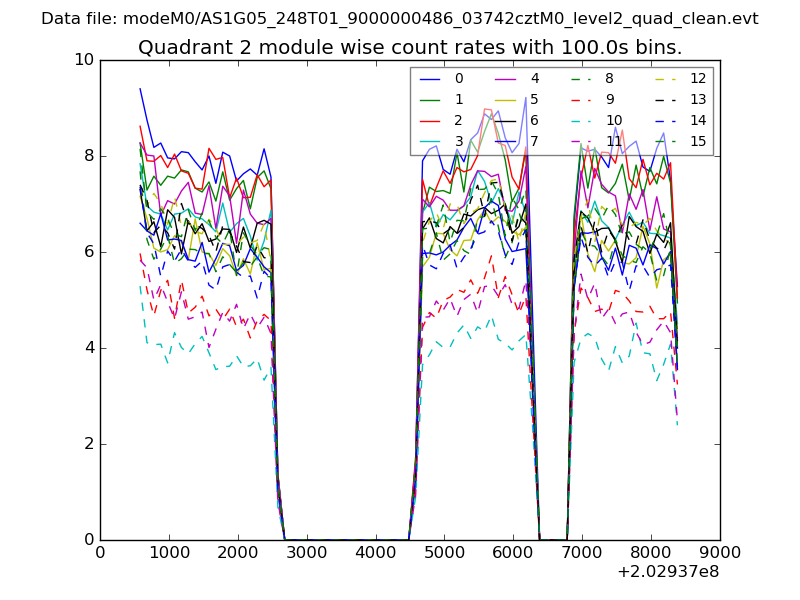
| Module-wise count rates for Quadrant B Data is divided into 100 sec bins |
 |
 |
| Module-wise count rates for Quadrant C Data is divided into 100 sec bins |
 |
 |
| Module-wise count rates for Quadrant D Data is divided into 100 sec bins |
 |
 |
| Parameter | Plot |
|---|---|
| CZT HV Monitor | 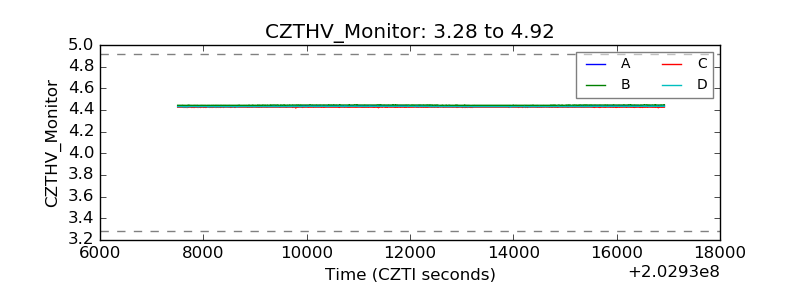 |
| D_VDD | 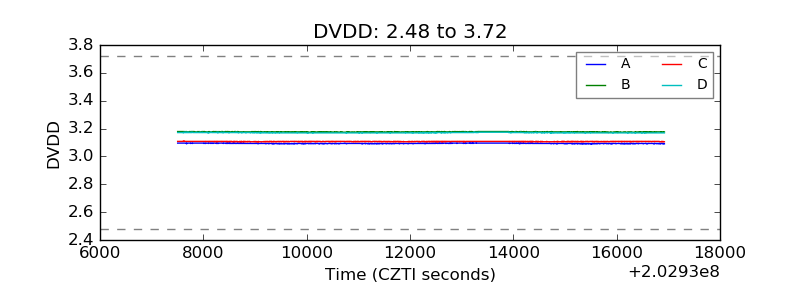 |
| Temperature 1 | 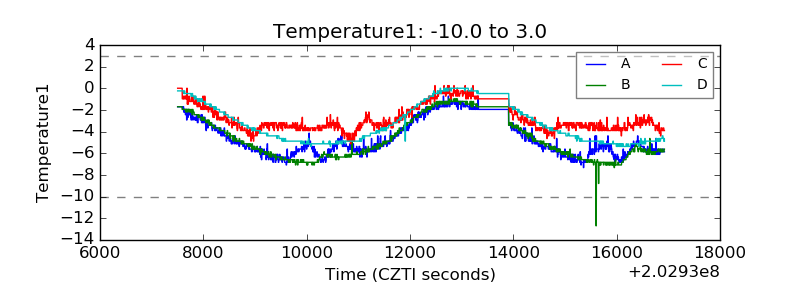 |
| Veto HV Monitor | 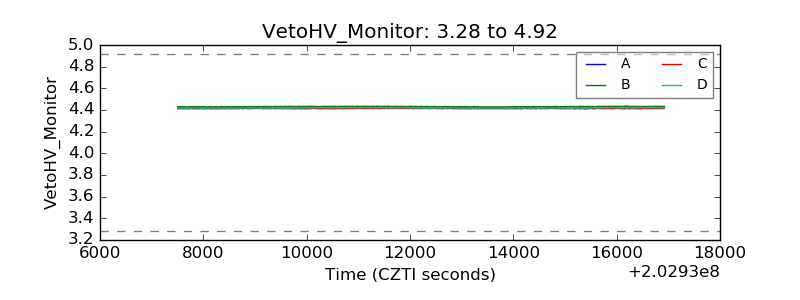 |
| Veto LLD | 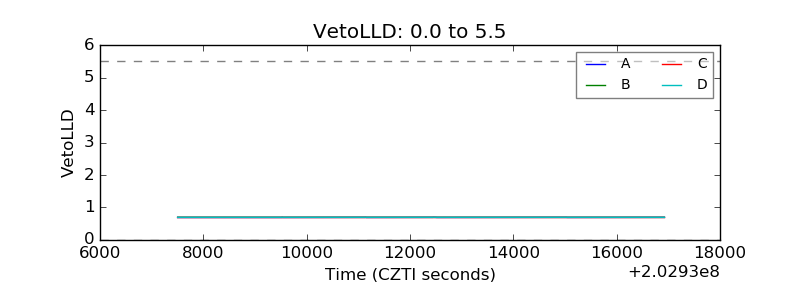 |
| Alpha Counter | 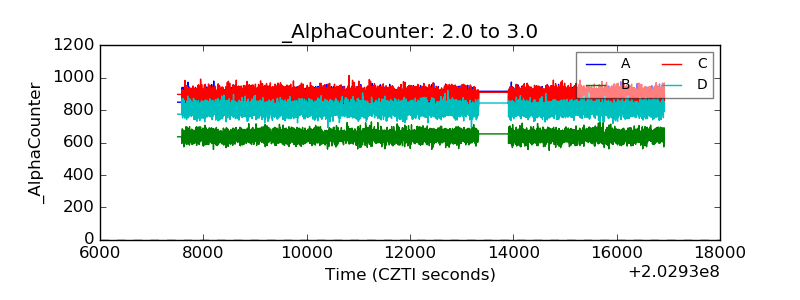 |
| _CPM_Rate | 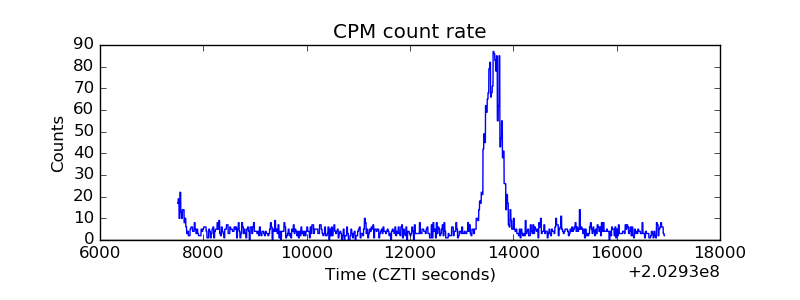 |
| CZT Counter | 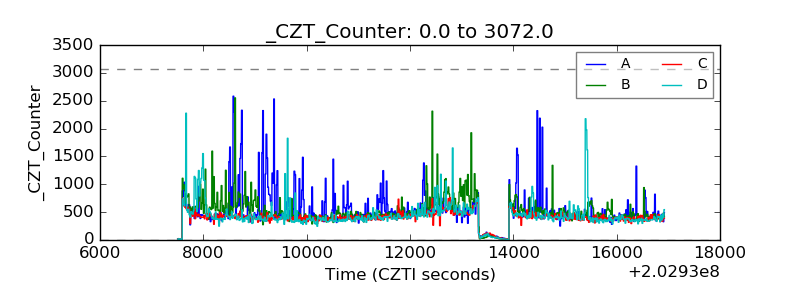 |
| +2.5 Volts monitor |  |
| +5 Volts monitor |  |
| Veto Counter | 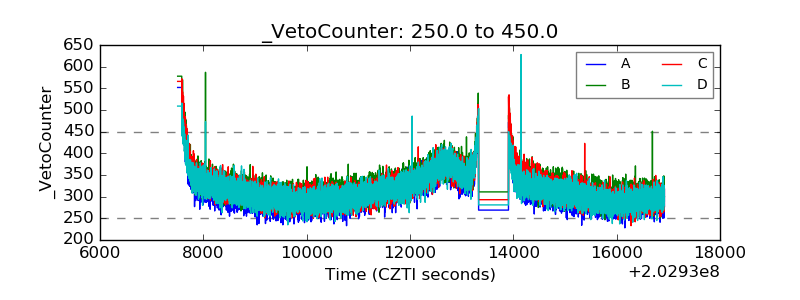 |