| Param | Original file | Final file |
|---|---|---|
| Filename | modeM0/AS1G05_248T01_9000000486_03743cztM0_level2.evt | modeM0/AS1G05_248T01_9000000486_03743cztM0_level2_quad_clean.evt |
| Size (bytes) | 749,085,120 | 104,872,320 |
| Size | 714.4 MB | 100.0 MB |
| Events in quadrant A | 6,359,286 | 611,779 |
| Events in quadrant B | 6,015,732 | 624,573 |
| Events in quadrant C | 4,526,147 | 621,304 |
| Events in quadrant D | 5,086,654 | 603,665 |
| Mode SS | |||
|---|---|---|---|
| Quadrant | BADHDUFLAG | Total packets | Discarded packets |
| A | 0 | 208 | 0 |
| B | 0 | 208 | 0 |
| C | 0 | 208 | 0 |
| D | 0 | 208 | 0 |
| Mode M9 | |||
|---|---|---|---|
| Quadrant | BADHDUFLAG | Total packets | Discarded packets |
| A | 0 | 17 | 0 |
| B | 0 | 17 | 0 |
| C | 0 | 17 | 0 |
| D | 0 | 17 | 0 |
| Mode M0 | |||
|---|---|---|---|
| Quadrant | BADHDUFLAG | Total packets | Discarded packets |
| A | 0 | 25926 | 2 |
| B | 0 | 24805 | 1 |
| C | 0 | 20934 | 1 |
| D | 0 | 22828 | 1 |
| Quadrant | Total seconds | Saturated seconds | Saturation percentage |
|---|---|---|---|
| A | 10318 | 400 | 3.876720% |
| B | 10318 | 259 | 2.510176% |
| C | 10318 | 24 | 0.232603% |
| D | 10318 | 74 | 0.717193% |
Noise dominated data is calculated using 1-second bins in cleaned event files. If a bin has >2000 counts, and if more than 50% of those come from <1% of pixels, then it is considered to be noise-dominated and hence unusable.
| Quadrant | # 1 sec bins | Bins with >0 counts | Bins with >2000 counts | High rate bins dominated by noise | Noise dominated (total time) | Noise dominated (detector-on time) | Marked lightcurve |
|---|---|---|---|---|---|---|---|
| A | 11923 | 10320 | 234 | 234 | 1.96% | 2.27% | 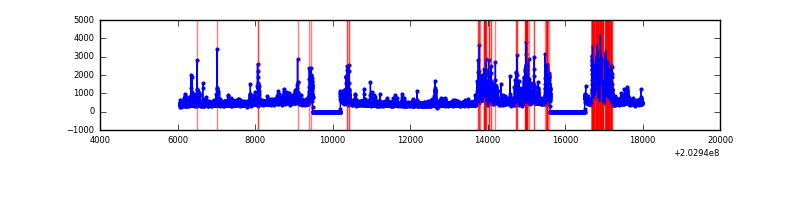 |
| B | 11923 | 10320 | 127 | 127 | 1.07% | 1.23% | 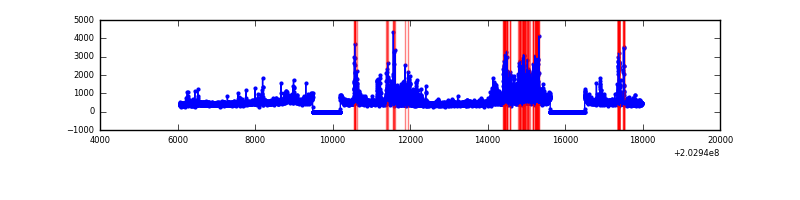 |
| C | 11923 | 10320 | 0 | 0 | 0.00% | 0.00% | 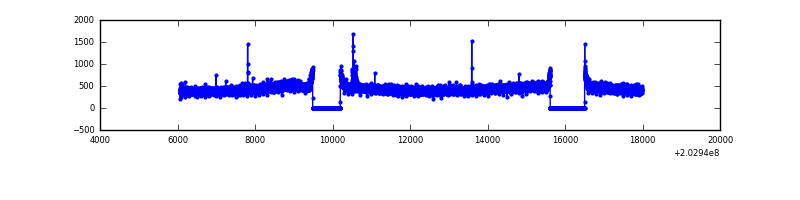 |
| D | 11923 | 10320 | 50 | 50 | 0.42% | 0.48% | 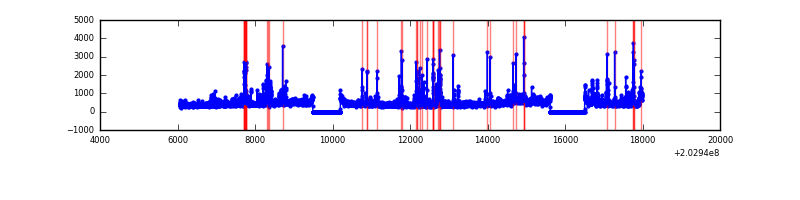 |
Top three noisy pixels from each quadrant. If the there are fewer than three noisy pixels in the level2.evt file, extra rows are filled as -1
| Pixel properties | Quadrant properties | ||||||
|---|---|---|---|---|---|---|---|
| Quadrant | DetID | PixID | Counts | Sigma | Mean | Median | Sigma |
| A | 13 | 251 | 867264 | 3626.75 | 1162 | 1136 | 238.8 |
| A | 0 | 118 | 585295 | 2446.06 | 1162 | 1136 | 238.8 |
| A | 8 | 15 | 306936 | 1280.48 | 1162 | 1136 | 238.8 |
| B | 0 | 173 | 1077856 | 4691.81 | 1187 | 1159 | 229.5 |
| B | 14 | 167 | 122941 | 530.68 | 1187 | 1159 | 229.5 |
| B | 15 | 204 | 85347 | 366.86 | 1187 | 1159 | 229.5 |
| C | 8 | 128 | 17644 | 61.6 | 1144 | 1148 | 267.8 |
| C | 7 | 222 | 16701 | 58.08 | 1144 | 1148 | 267.8 |
| C | 13 | 61 | 9623 | 31.65 | 1144 | 1148 | 267.8 |
| D | 10 | 246 | 168263 | 608.82 | 1138 | 1105 | 274.6 |
| D | 2 | 232 | 151779 | 548.78 | 1138 | 1105 | 274.6 |
| D | 13 | 25 | 129288 | 466.86 | 1138 | 1105 | 274.6 |
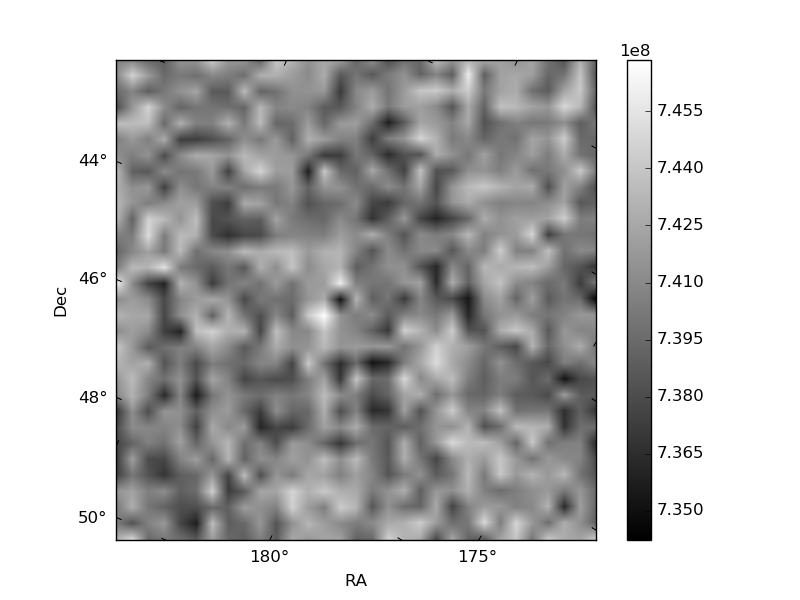
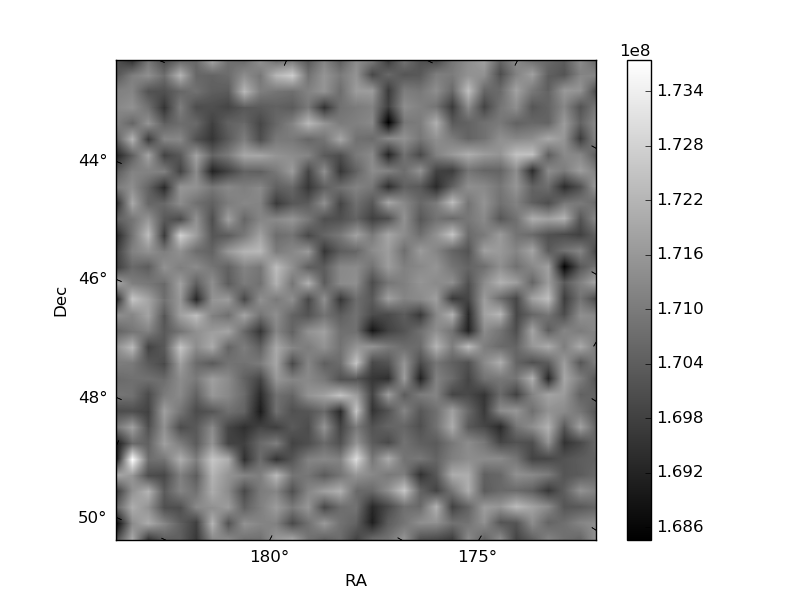
Histogram calculated using DETX and DETY for each event in the final _common_clean file
| Quadrant A | 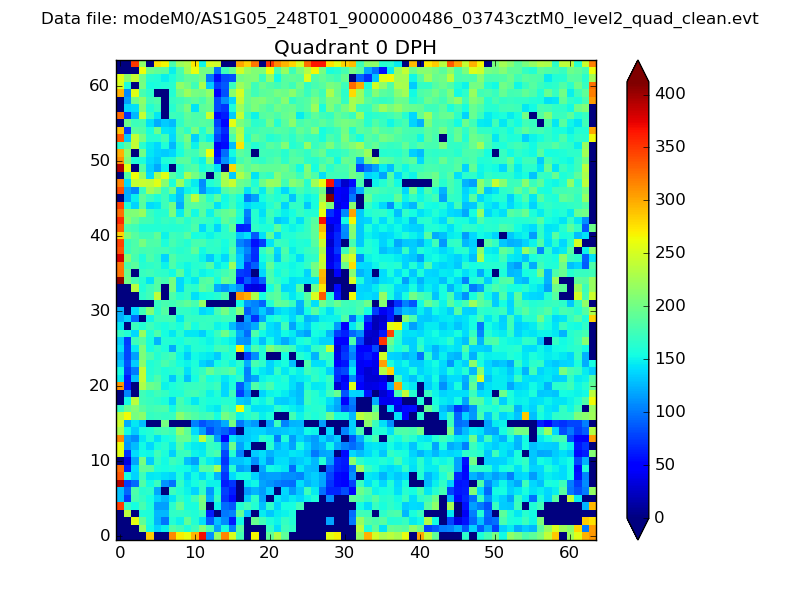 |
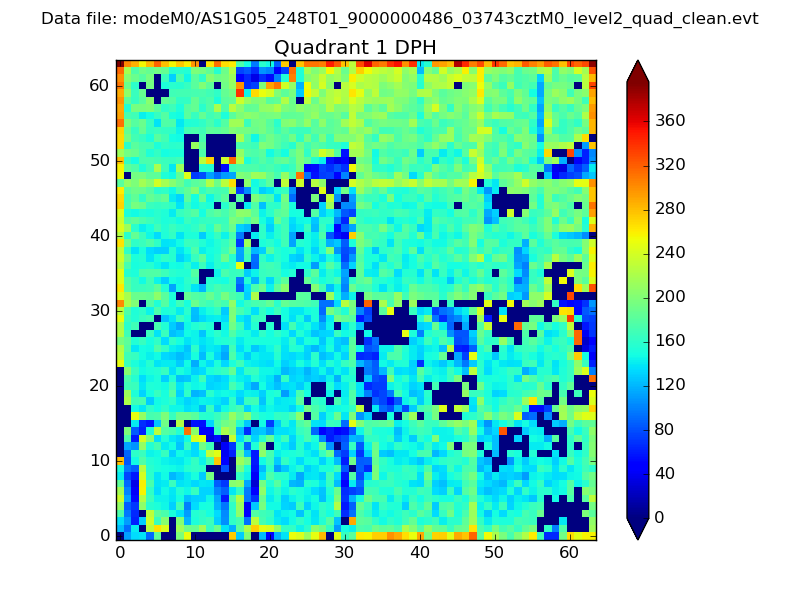 |
Quadrant B |
|---|---|---|---|
| Quadrant D | 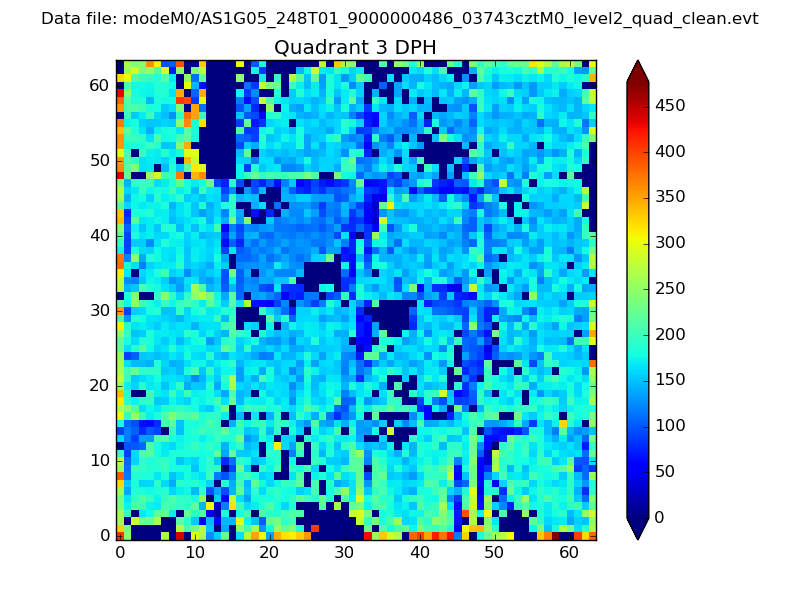 |
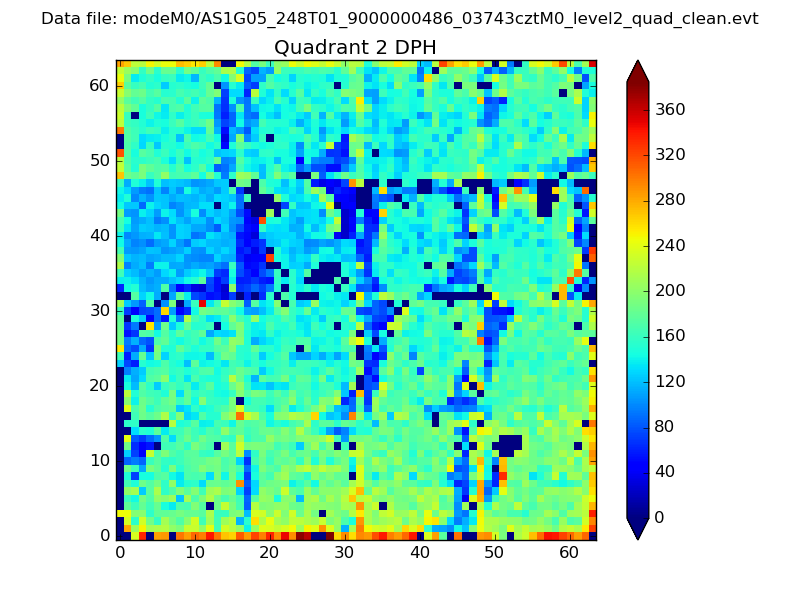 |
Quadrant C |
| Plot type | Count rate plots | Images |
|---|---|---|
| Comparison with Poisson distribution Blue bars denote a histogram of data divided into 1 sec bins. Red curve is a Poisson curve with rate = median count rate of data. |
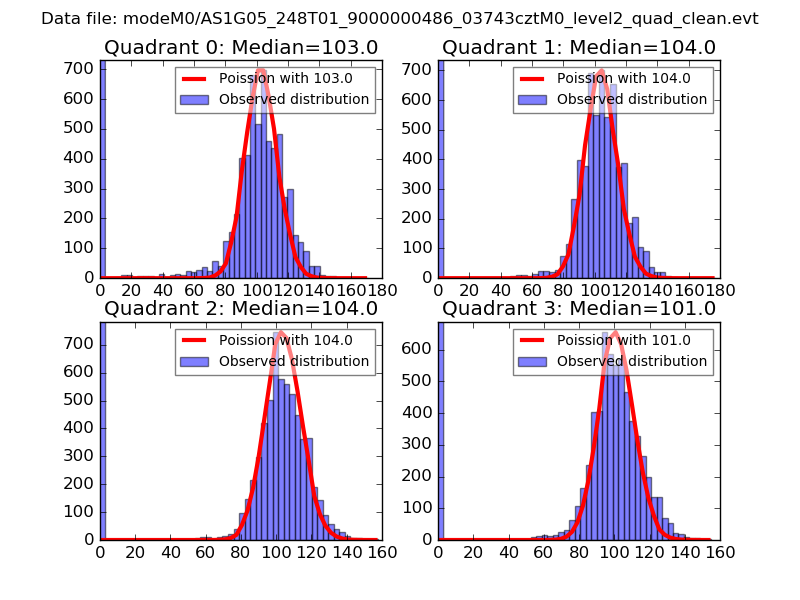 |
 |
| Quadrant-wise count rates Data is divided into 100 sec bins |
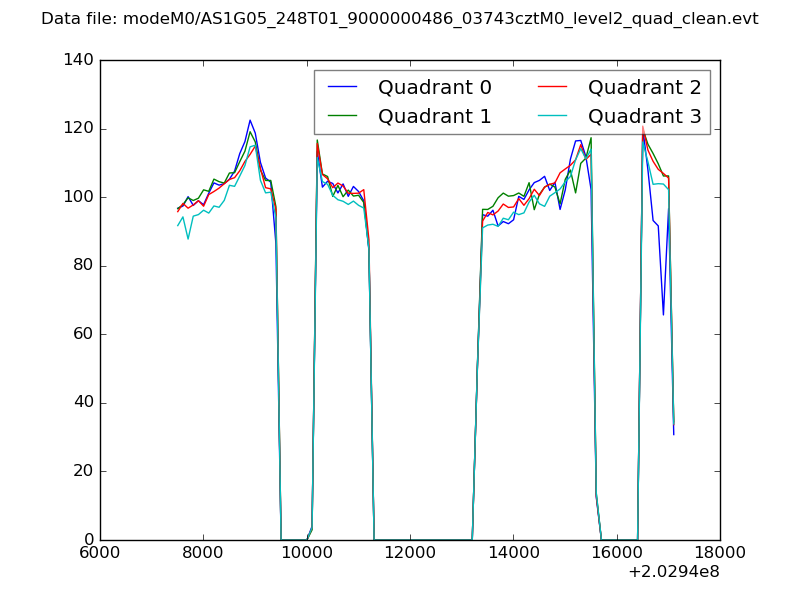 |
|
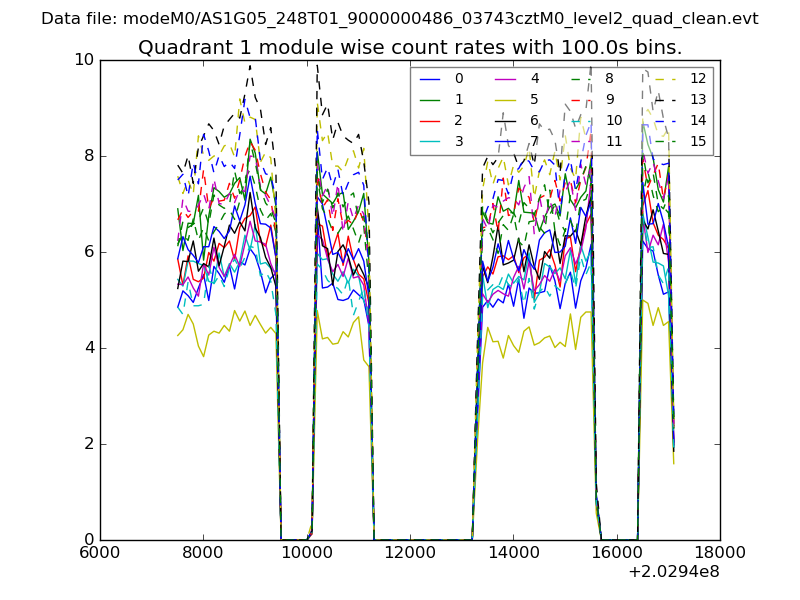
| Module-wise count rates for Quadrant A Data is divided into 100 sec bins |
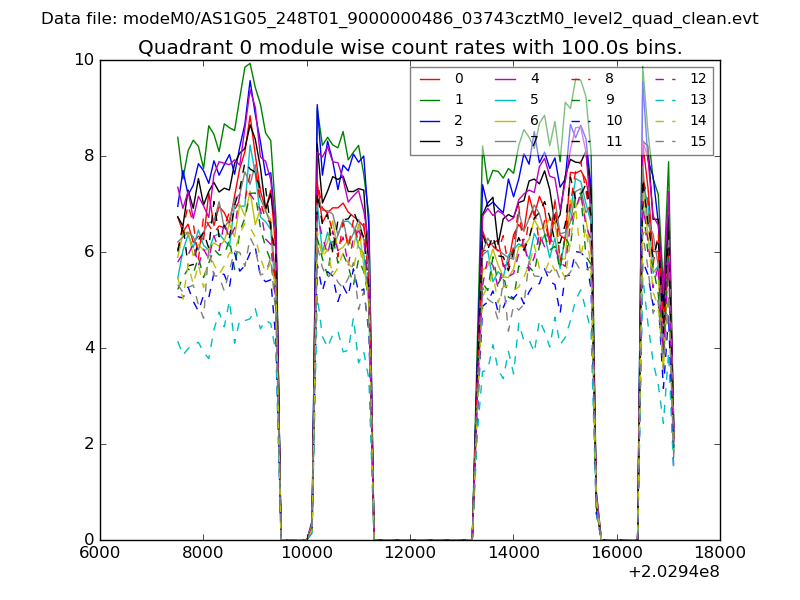 |
 |
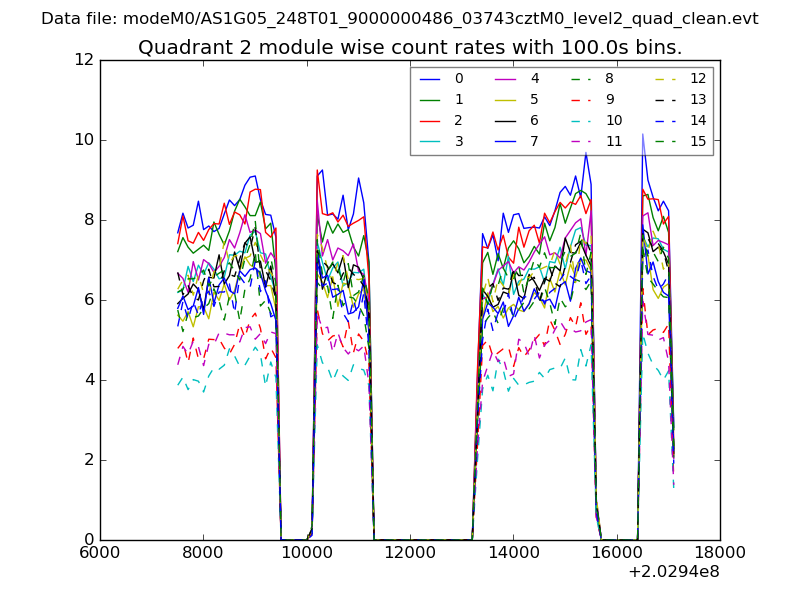
| Module-wise count rates for Quadrant B Data is divided into 100 sec bins |
 |
 |
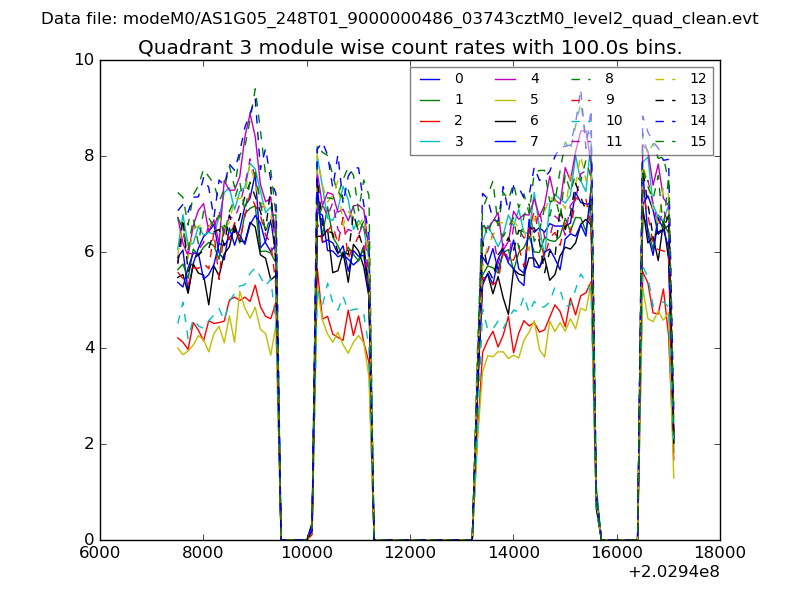
| Module-wise count rates for Quadrant C Data is divided into 100 sec bins |
 |
 |
| Module-wise count rates for Quadrant D Data is divided into 100 sec bins |
 |
 |
| Parameter | Plot |
|---|---|
| CZT HV Monitor | 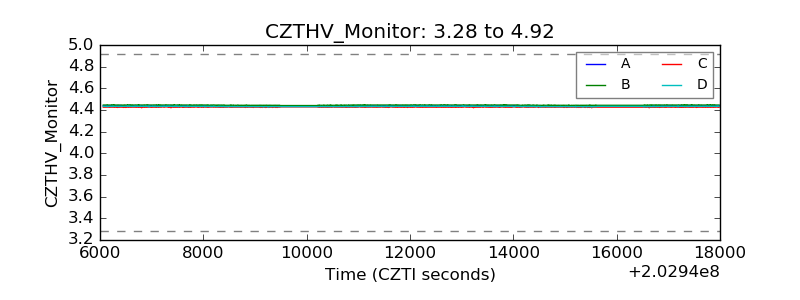 |
| D_VDD |  |
| Temperature 1 | 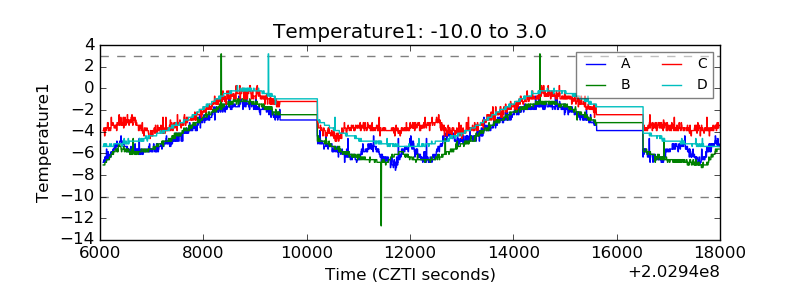 |
| Veto HV Monitor | 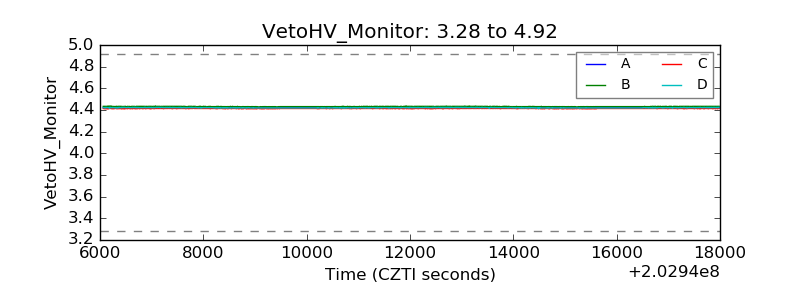 |
| Veto LLD | 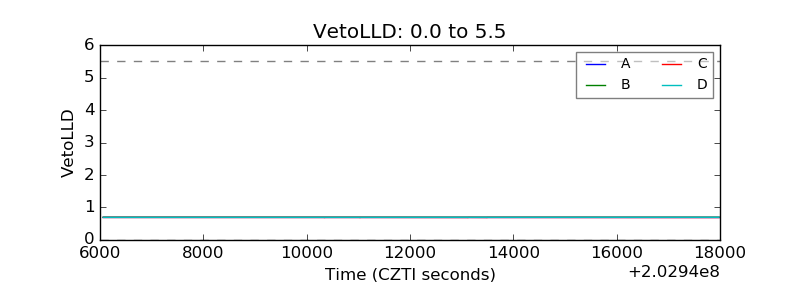 |
| Alpha Counter | 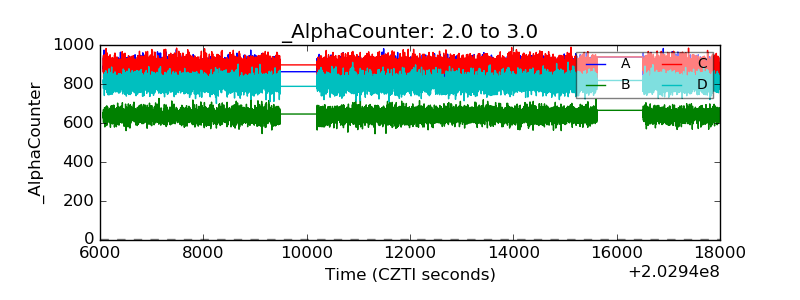 |
| _CPM_Rate | 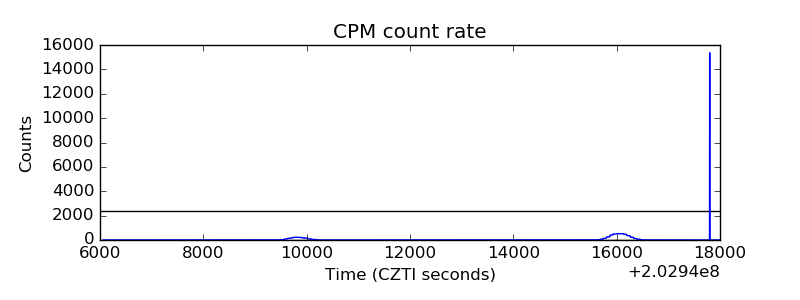 |
| CZT Counter | 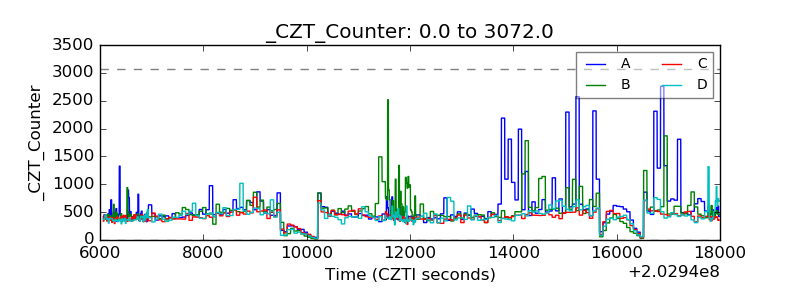 |
| +2.5 Volts monitor |  |
| +5 Volts monitor |  |
| Veto Counter | 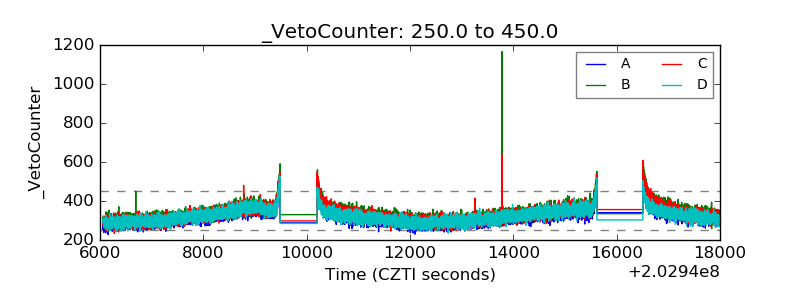 |