| Param | Original file | Final file |
|---|---|---|
| Filename | modeM0/AS1G05_248T01_9000000486_03746cztM0_level2.evt | modeM0/AS1G05_248T01_9000000486_03746cztM0_level2_quad_clean.evt |
| Size (bytes) | 445,556,160 | 57,363,840 |
| Size | 424.9 MB | 54.7 MB |
| Events in quadrant A | 3,286,524 | 326,728 |
| Events in quadrant B | 3,687,165 | 324,854 |
| Events in quadrant C | 3,003,495 | 319,760 |
| Events in quadrant D | 3,075,955 | 313,170 |
| Mode SS | |||
|---|---|---|---|
| Quadrant | BADHDUFLAG | Total packets | Discarded packets |
| A | 0 | 132 | 0 |
| B | 0 | 132 | 0 |
| C | 0 | 132 | 0 |
| D | 0 | 132 | 0 |
| Mode M9 | |||
|---|---|---|---|
| Quadrant | BADHDUFLAG | Total packets | Discarded packets |
| A | 0 | 20 | 0 |
| B | 0 | 20 | 0 |
| C | 0 | 20 | 0 |
| D | 0 | 21 | 0 |
| Mode M0 | |||
|---|---|---|---|
| Quadrant | BADHDUFLAG | Total packets | Discarded packets |
| A | 0 | 13960 | 2 |
| B | 0 | 15136 | 1 |
| C | 0 | 13458 | 1 |
| D | 0 | 13803 | 1 |
| Quadrant | Total seconds | Saturated seconds | Saturation percentage |
|---|---|---|---|
| A | 6479 | 77 | 1.188455% |
| B | 6479 | 67 | 1.034110% |
| C | 6479 | 58 | 0.895200% |
| D | 6479 | 77 | 1.188455% |
Noise dominated data is calculated using 1-second bins in cleaned event files. If a bin has >2000 counts, and if more than 50% of those come from <1% of pixels, then it is considered to be noise-dominated and hence unusable.
| Quadrant | # 1 sec bins | Bins with >0 counts | Bins with >2000 counts | High rate bins dominated by noise | Noise dominated (total time) | Noise dominated (detector-on time) | Marked lightcurve |
|---|---|---|---|---|---|---|---|
| A | 7614 | 6479 | 15 | 15 | 0.20% | 0.23% | 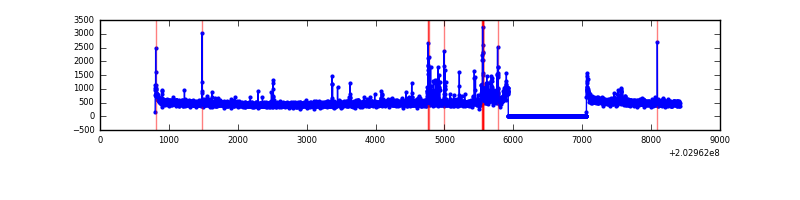 |
| B | 7614 | 6479 | 8 | 8 | 0.11% | 0.12% | 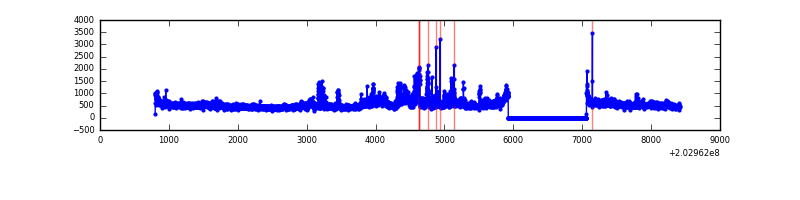 |
| C | 7614 | 6480 | 22 | 22 | 0.29% | 0.34% | 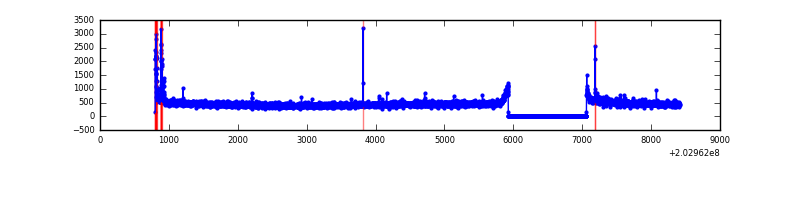 |
| D | 7614 | 6480 | 32 | 32 | 0.42% | 0.49% | 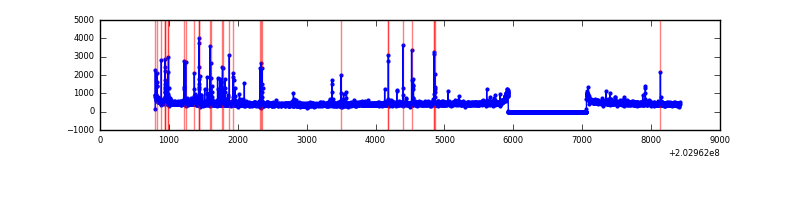 |
Top three noisy pixels from each quadrant. If the there are fewer than three noisy pixels in the level2.evt file, extra rows are filled as -1
| Pixel properties | Quadrant properties | ||||||
|---|---|---|---|---|---|---|---|
| Quadrant | DetID | PixID | Counts | Sigma | Mean | Median | Sigma |
| A | 0 | 118 | 118003 | 739.54 | 773 | 756 | 158.5 |
| A | 8 | 15 | 76481 | 477.64 | 773 | 756 | 158.5 |
| A | 13 | 251 | 32597 | 200.84 | 773 | 756 | 158.5 |
| B | 15 | 204 | 430435 | 2806.6 | 787 | 767 | 153.1 |
| B | 0 | 173 | 92135 | 596.82 | 787 | 767 | 153.1 |
| B | 14 | 167 | 70293 | 454.15 | 787 | 767 | 153.1 |
| C | 9 | 247 | 66244 | 375.13 | 745 | 749 | 174.6 |
| C | 12 | 4 | 12943 | 69.84 | 745 | 749 | 174.6 |
| C | 0 | 239 | 8624 | 45.1 | 745 | 749 | 174.6 |
| D | 6 | 112 | 95243 | 525.04 | 744 | 721 | 180.0 |
| D | 13 | 239 | 50913 | 278.8 | 744 | 721 | 180.0 |
| D | 13 | 223 | 45484 | 248.65 | 744 | 721 | 180.0 |
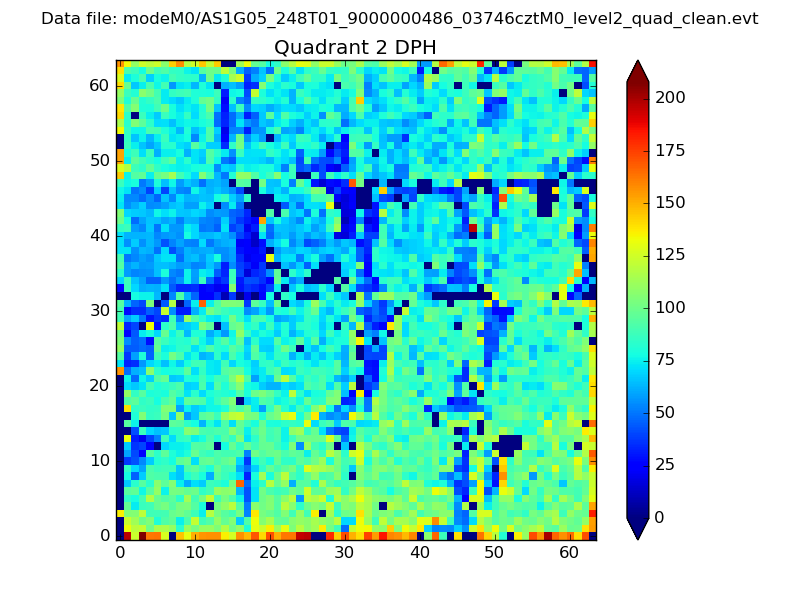
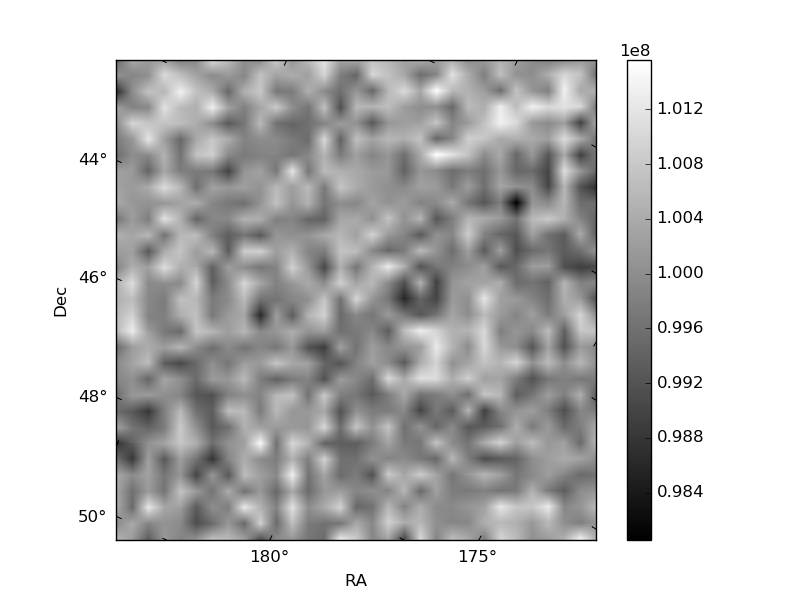
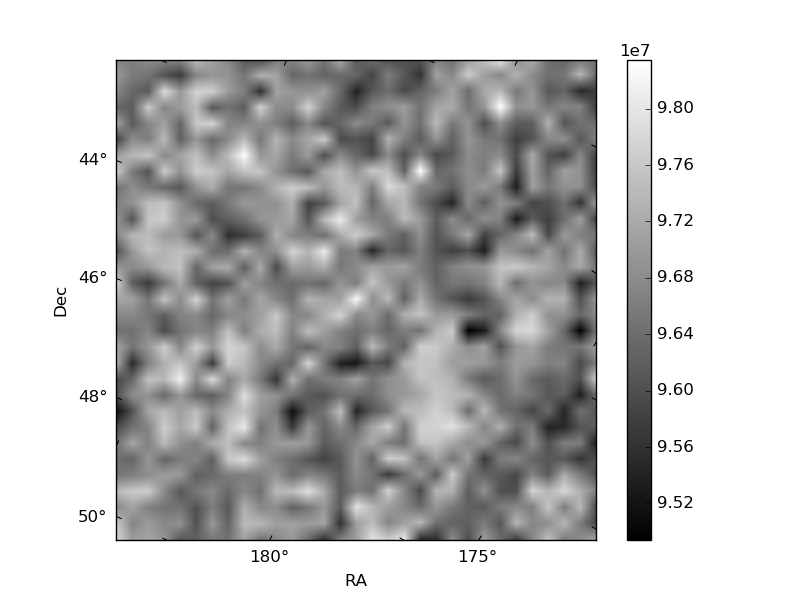
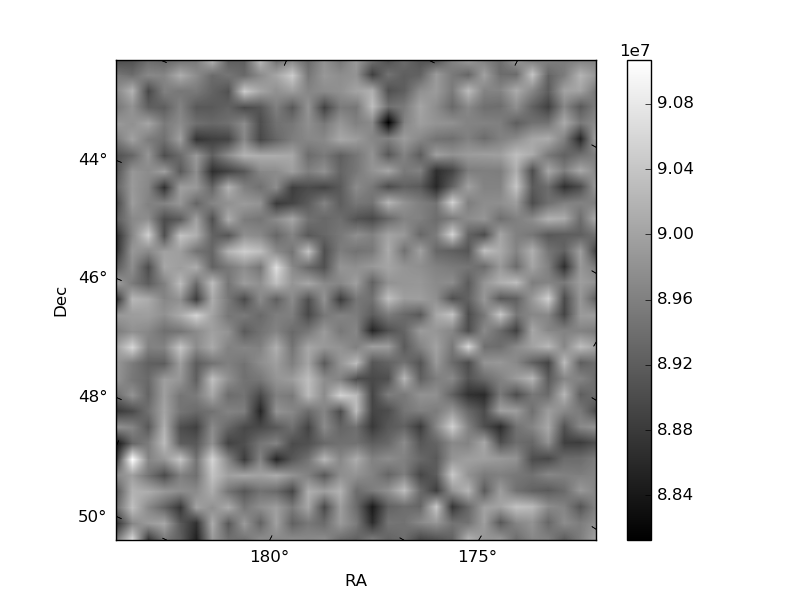
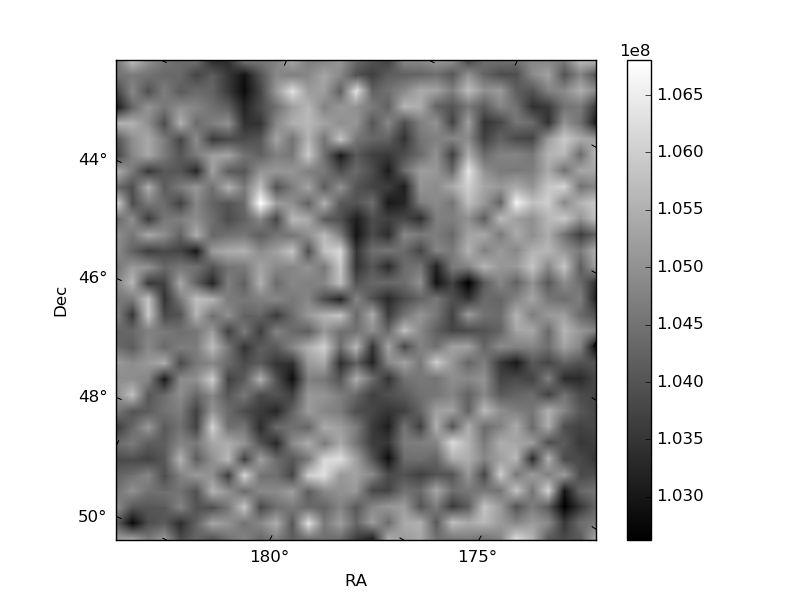
Histogram calculated using DETX and DETY for each event in the final _common_clean file
| Quadrant A | 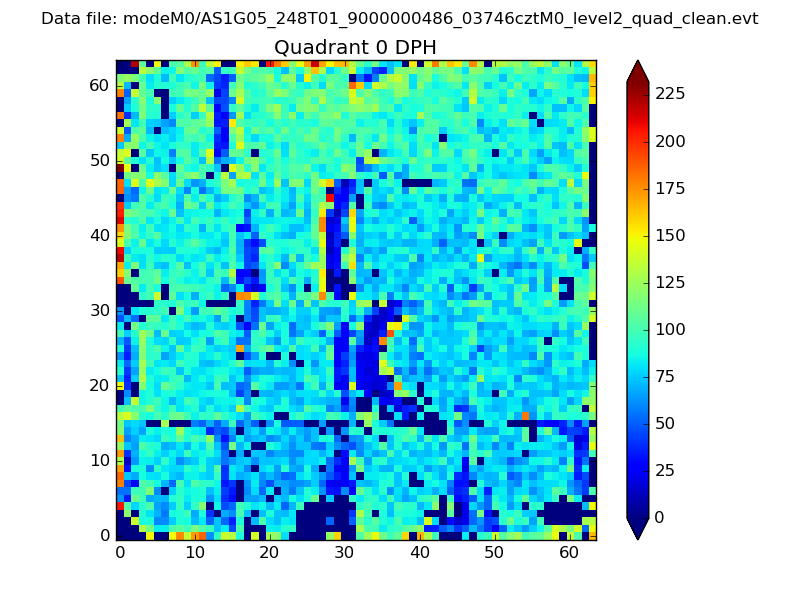 |
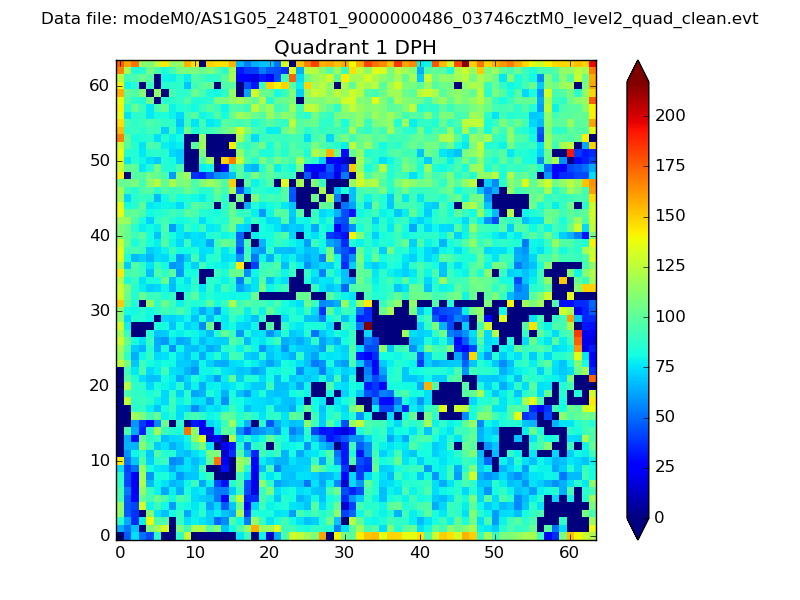 |
Quadrant B |
|---|---|---|---|
| Quadrant D | 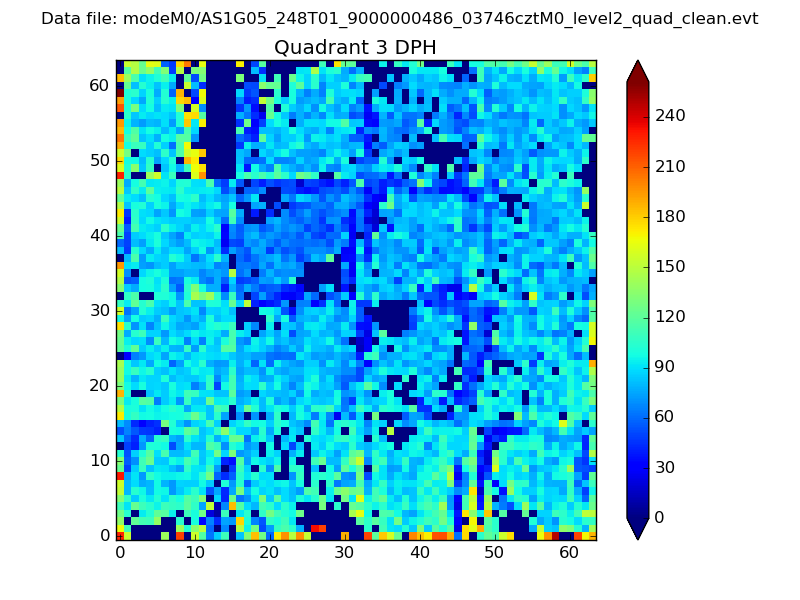 |
 |
Quadrant C |
| Plot type | Count rate plots | Images |
|---|---|---|
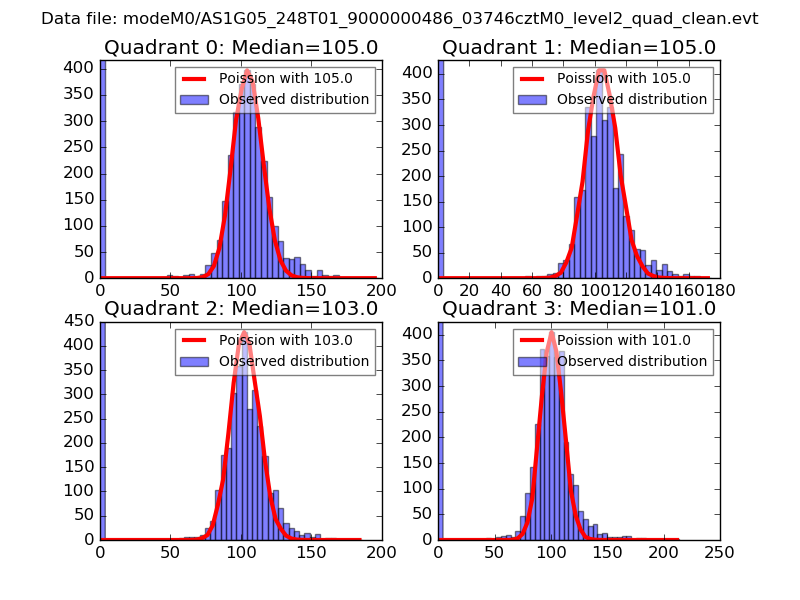
| Comparison with Poisson distribution Blue bars denote a histogram of data divided into 1 sec bins. Red curve is a Poisson curve with rate = median count rate of data. |
 |
 |
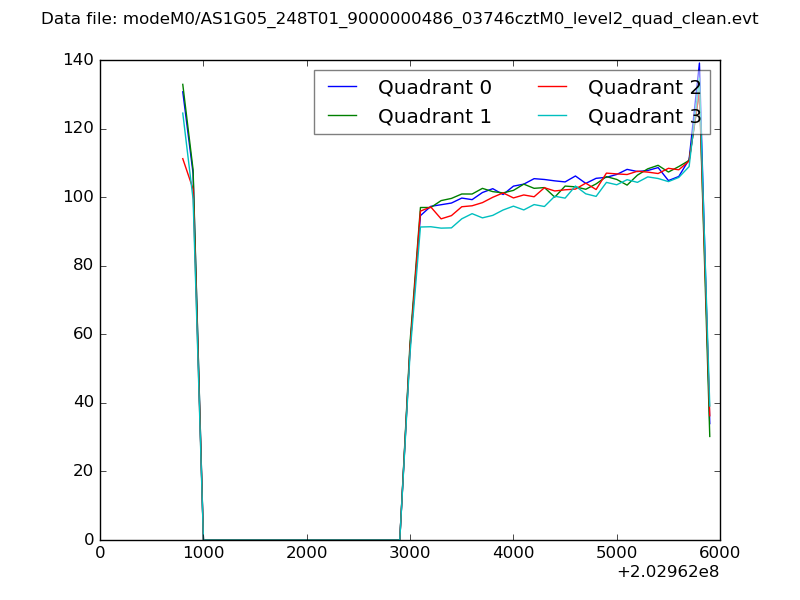
| Quadrant-wise count rates Data is divided into 100 sec bins |
 |
|
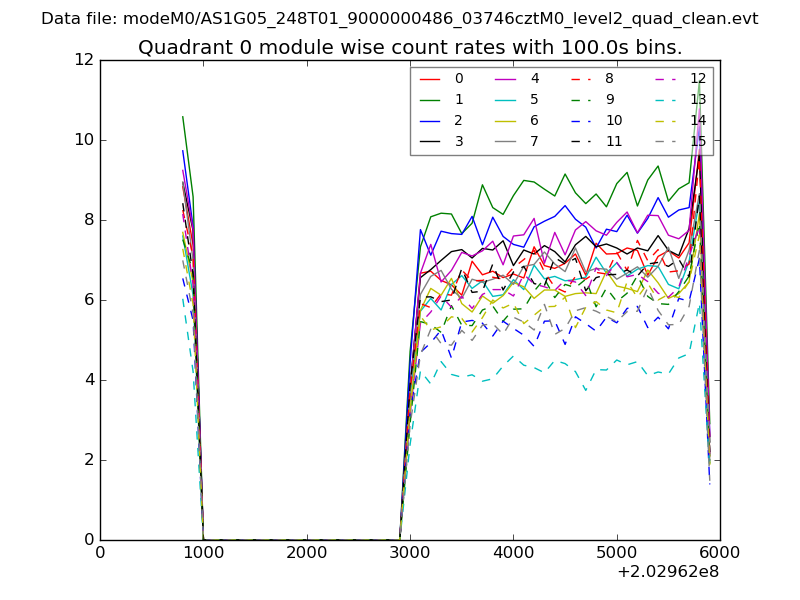
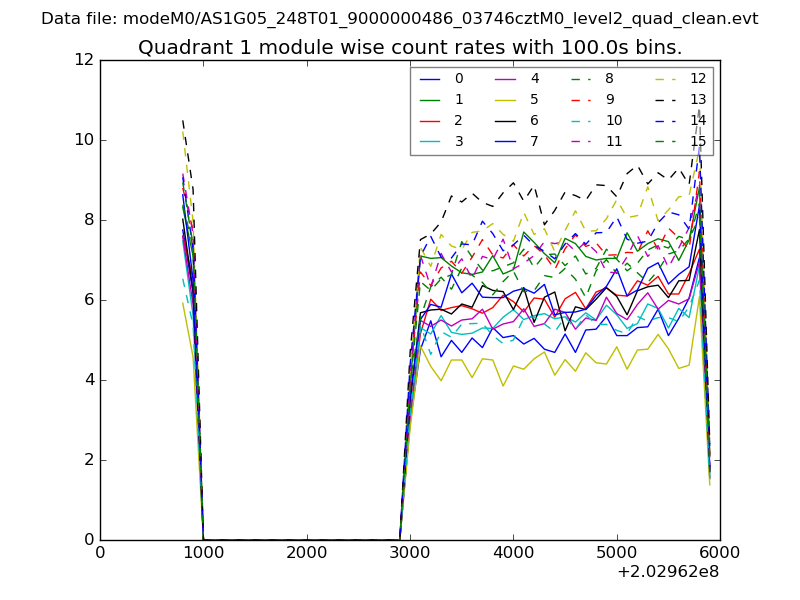
| Module-wise count rates for Quadrant A Data is divided into 100 sec bins |
 |
 |
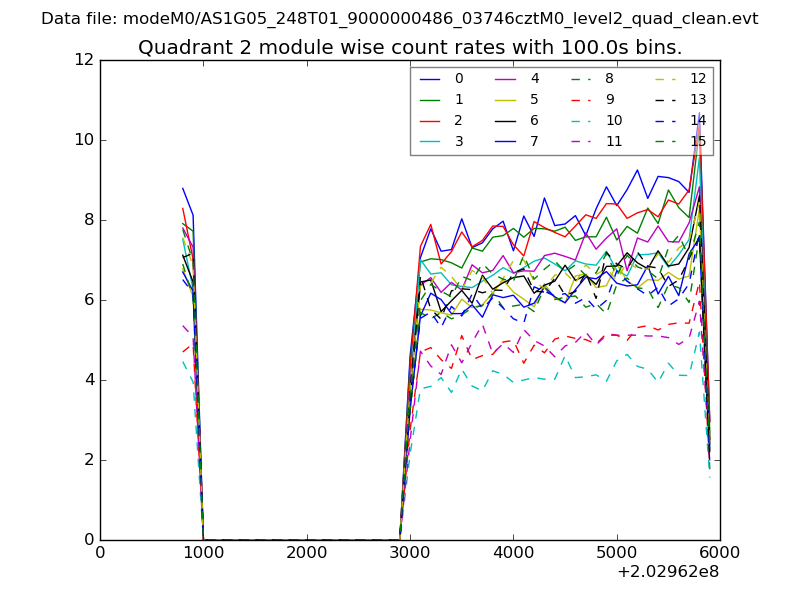
| Module-wise count rates for Quadrant B Data is divided into 100 sec bins |
 |
 |
| Module-wise count rates for Quadrant C Data is divided into 100 sec bins |
 |
 |
| Module-wise count rates for Quadrant D Data is divided into 100 sec bins |
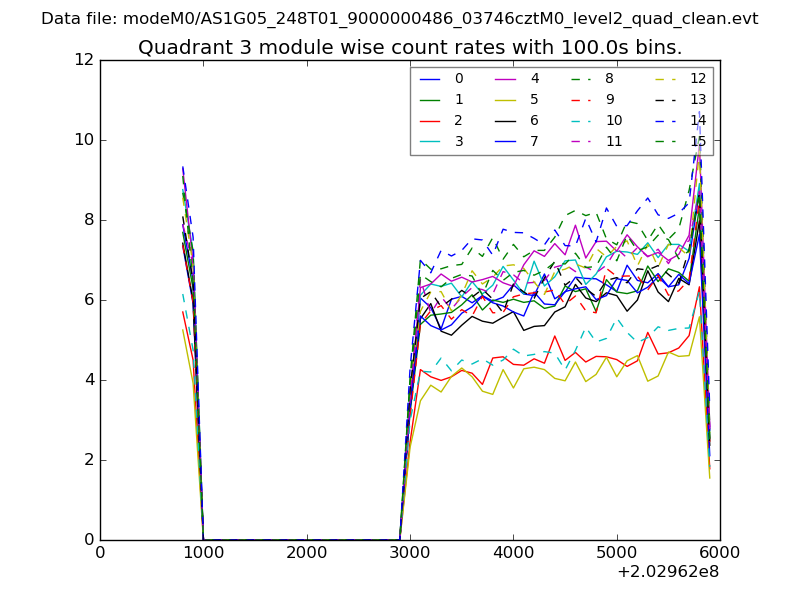 |
 |
| Parameter | Plot |
|---|---|
| CZT HV Monitor | 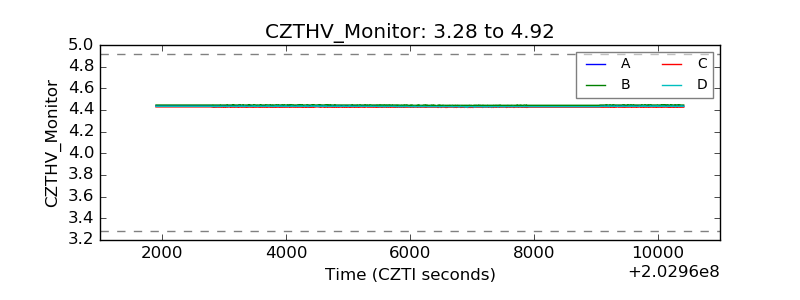 |
| D_VDD |  |
| Temperature 1 | 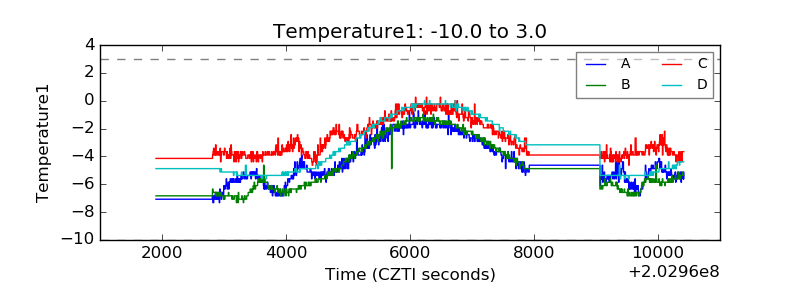 |
| Veto HV Monitor | 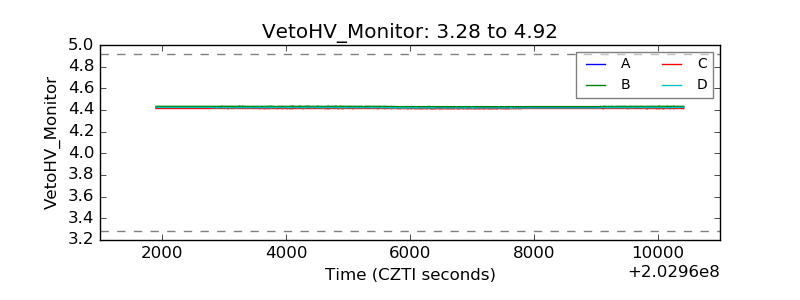 |
| Veto LLD | 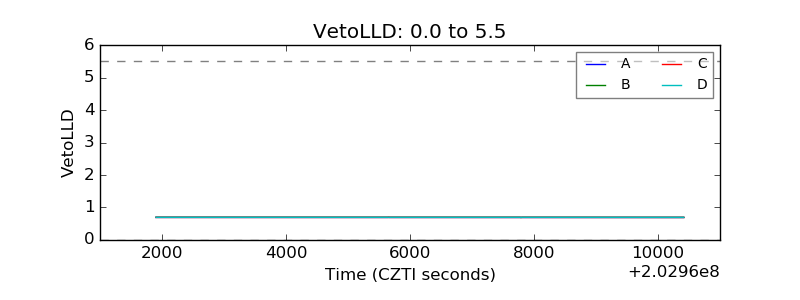 |
| Alpha Counter | 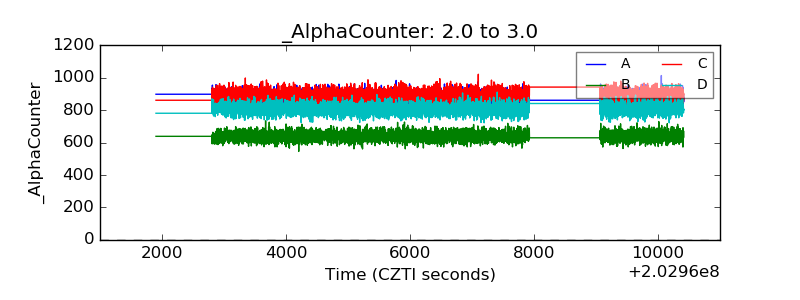 |
| _CPM_Rate | 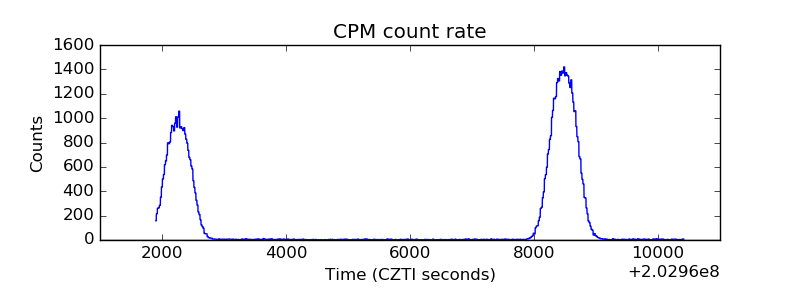 |
| CZT Counter | 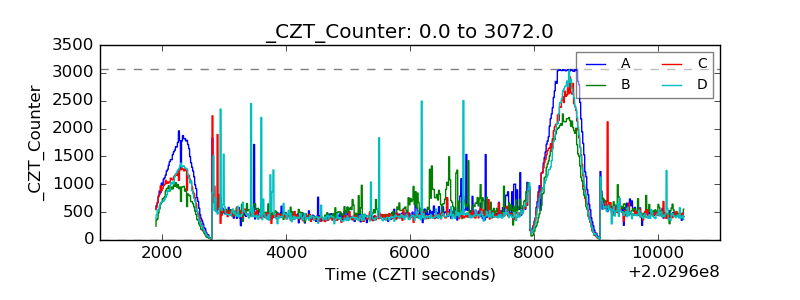 |
| +2.5 Volts monitor |  |
| +5 Volts monitor |  |
| Veto Counter | 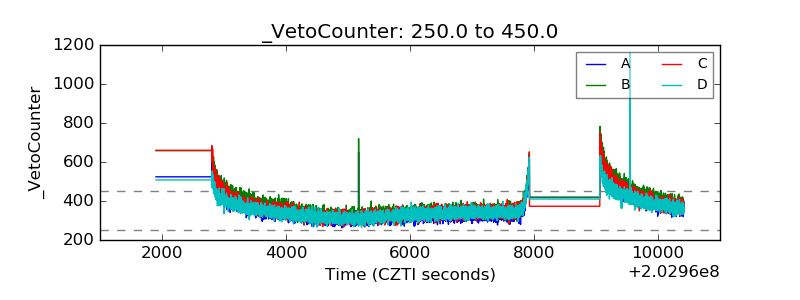 |