| Param | Original file | Final file |
|---|---|---|
| Filename | modeM0/AS1G05_248T01_9000000486_03747cztM0_level2.evt | modeM0/AS1G05_248T01_9000000486_03747cztM0_level2_quad_clean.evt |
| Size (bytes) | 462,372,480 | 59,362,560 |
| Size | 441.0 MB | 56.6 MB |
| Events in quadrant A | 3,425,173 | 344,571 |
| Events in quadrant B | 3,763,580 | 343,263 |
| Events in quadrant C | 2,949,584 | 339,881 |
| Events in quadrant D | 3,435,214 | 328,099 |
| Mode SS | |||
|---|---|---|---|
| Quadrant | BADHDUFLAG | Total packets | Discarded packets |
| A | 0 | 128 | 0 |
| B | 0 | 128 | 0 |
| C | 0 | 128 | 0 |
| D | 0 | 128 | 0 |
| Mode M9 | |||
|---|---|---|---|
| Quadrant | BADHDUFLAG | Total packets | Discarded packets |
| A | 0 | 12 | 0 |
| B | 0 | 12 | 0 |
| C | 0 | 12 | 0 |
| D | 0 | 12 | 0 |
| Mode M0 | |||
|---|---|---|---|
| Quadrant | BADHDUFLAG | Total packets | Discarded packets |
| A | 0 | 14010 | 2 |
| B | 0 | 15170 | 1 |
| C | 0 | 13002 | 1 |
| D | 0 | 14685 | 1 |
| Quadrant | Total seconds | Saturated seconds | Saturation percentage |
|---|---|---|---|
| A | 6324 | 120 | 1.897533% |
| B | 6324 | 108 | 1.707780% |
| C | 6324 | 65 | 1.027830% |
| D | 6324 | 85 | 1.344086% |
Noise dominated data is calculated using 1-second bins in cleaned event files. If a bin has >2000 counts, and if more than 50% of those come from <1% of pixels, then it is considered to be noise-dominated and hence unusable.
| Quadrant | # 1 sec bins | Bins with >0 counts | Bins with >2000 counts | High rate bins dominated by noise | Noise dominated (total time) | Noise dominated (detector-on time) | Marked lightcurve |
|---|---|---|---|---|---|---|---|
| A | 7519 | 6324 | 23 | 23 | 0.31% | 0.36% | 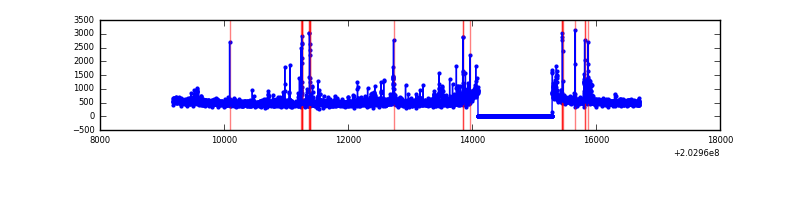 |
| B | 7519 | 6324 | 20 | 20 | 0.27% | 0.32% | 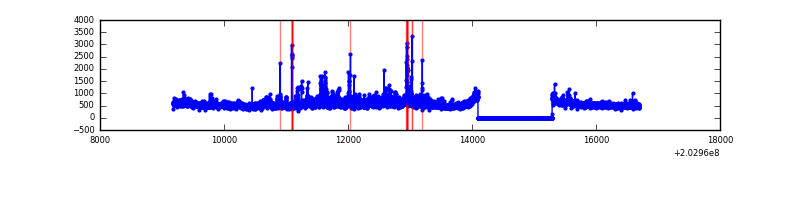 |
| C | 7519 | 6324 | 2 | 2 | 0.03% | 0.03% | 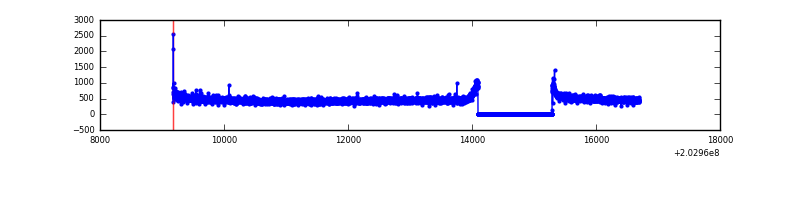 |
| D | 7519 | 6325 | 32 | 32 | 0.43% | 0.51% | 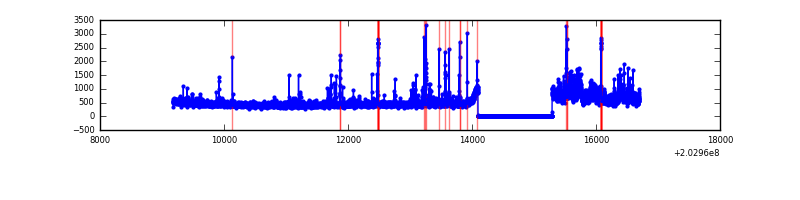 |
Top three noisy pixels from each quadrant. If the there are fewer than three noisy pixels in the level2.evt file, extra rows are filled as -1
| Pixel properties | Quadrant properties | ||||||
|---|---|---|---|---|---|---|---|
| Quadrant | DetID | PixID | Counts | Sigma | Mean | Median | Sigma |
| A | 13 | 251 | 143977 | 909.75 | 778 | 762 | 157.4 |
| A | 0 | 118 | 124162 | 783.88 | 778 | 762 | 157.4 |
| A | 8 | 15 | 114291 | 721.17 | 778 | 762 | 157.4 |
| B | 15 | 204 | 344412 | 2304.28 | 789 | 771 | 149.1 |
| B | 0 | 173 | 85265 | 566.57 | 789 | 771 | 149.1 |
| B | 3 | 0 | 76998 | 511.14 | 789 | 771 | 149.1 |
| C | 12 | 4 | 12919 | 69.61 | 749 | 753 | 174.8 |
| C | 13 | 61 | 6217 | 31.26 | 749 | 753 | 174.8 |
| C | 2 | 53 | 6165 | 30.97 | 749 | 753 | 174.8 |
| D | 1 | 20 | 403208 | 2232.89 | 746 | 727 | 180.3 |
| D | 2 | 37 | 58544 | 320.76 | 746 | 727 | 180.3 |
| D | 8 | 112 | 53952 | 295.28 | 746 | 727 | 180.3 |
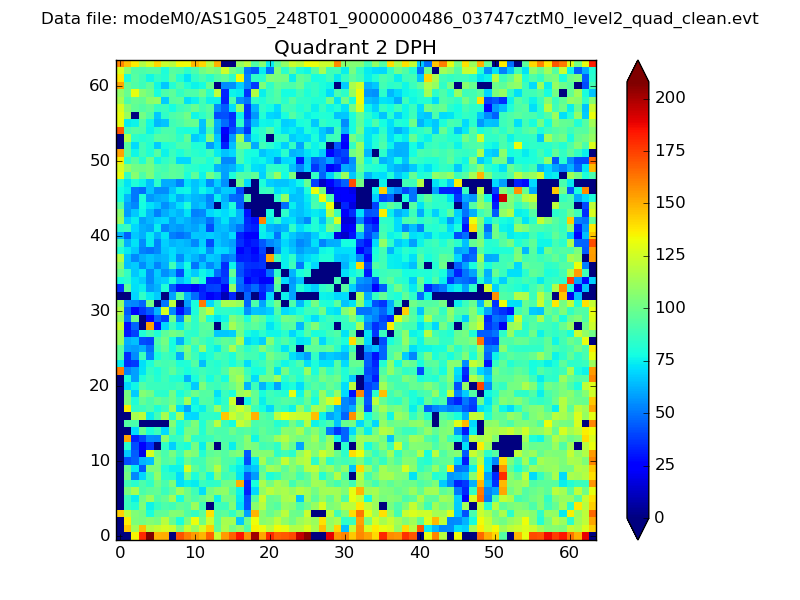
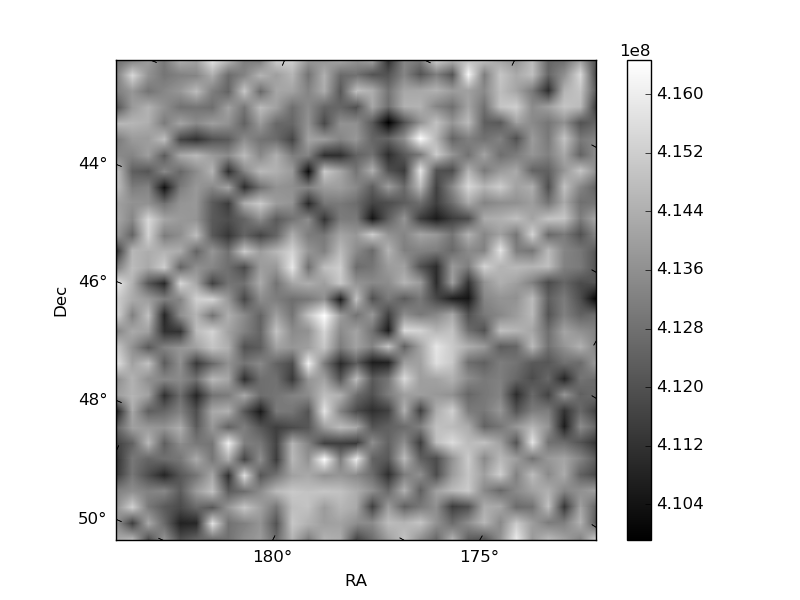
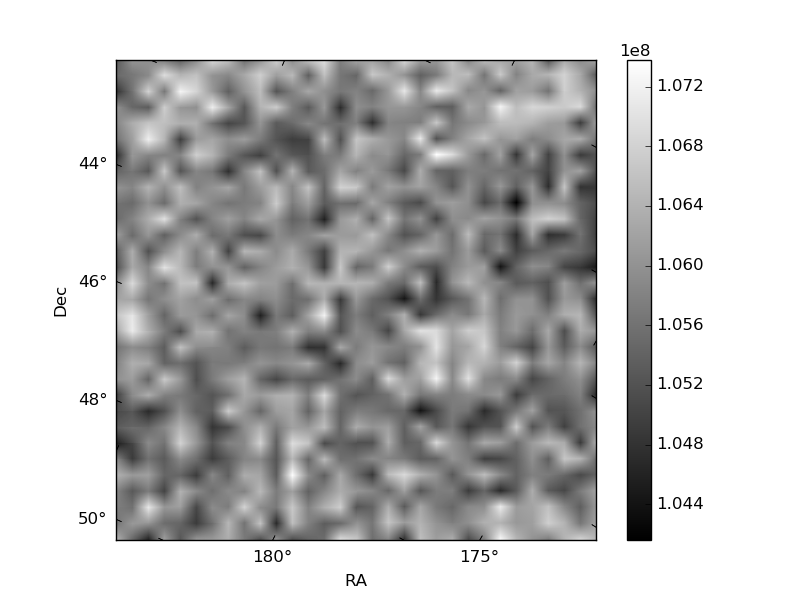
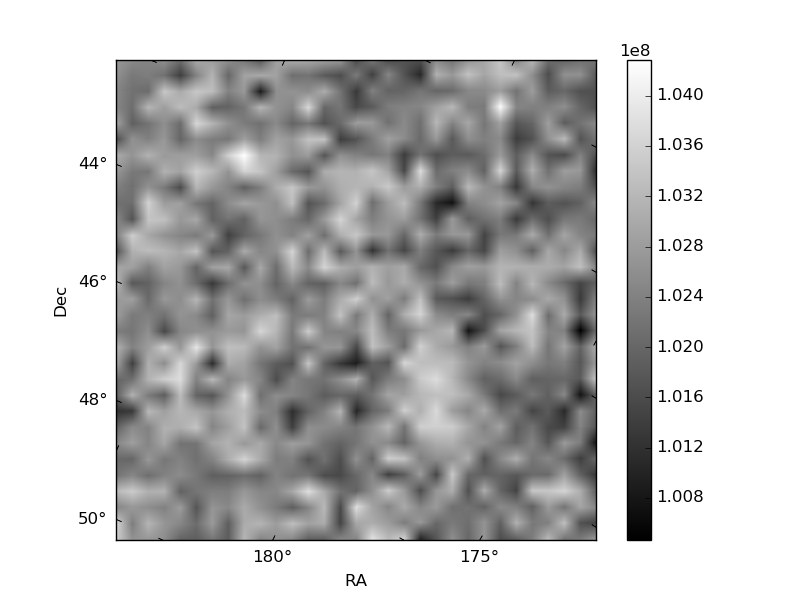
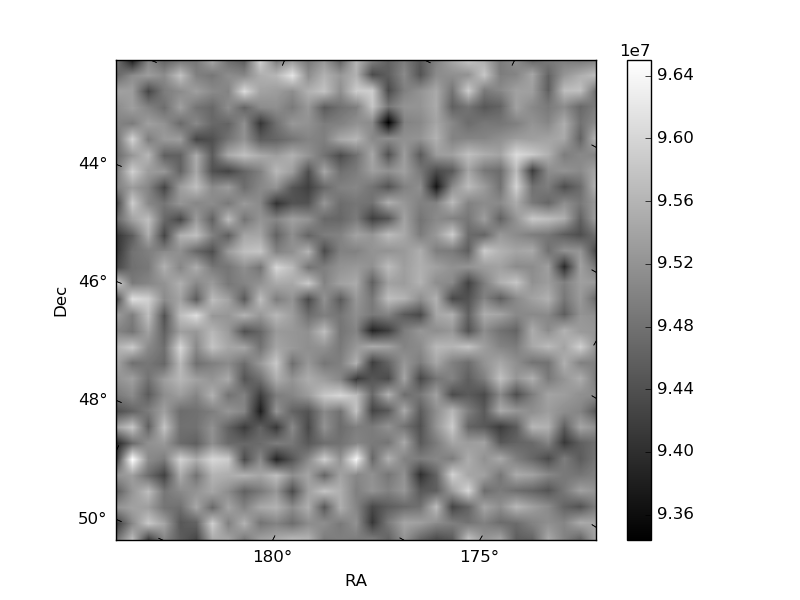
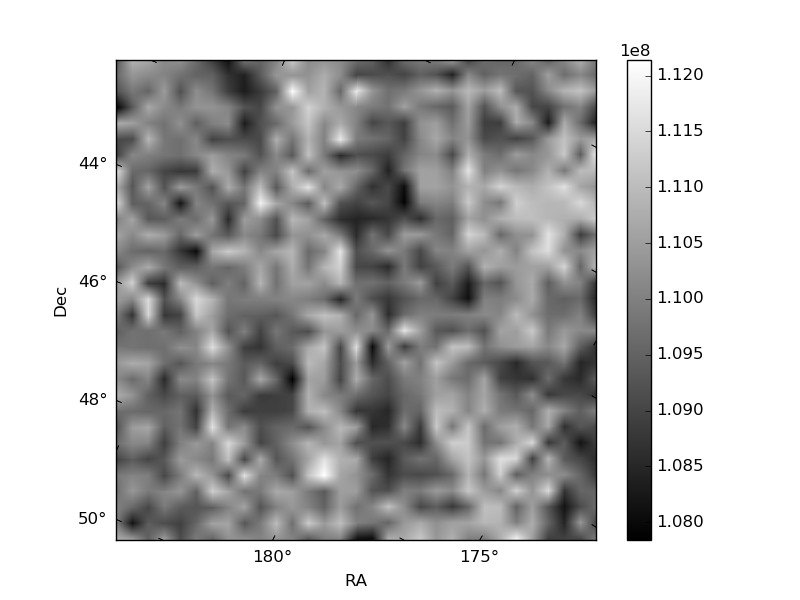
Histogram calculated using DETX and DETY for each event in the final _common_clean file
| Quadrant A | 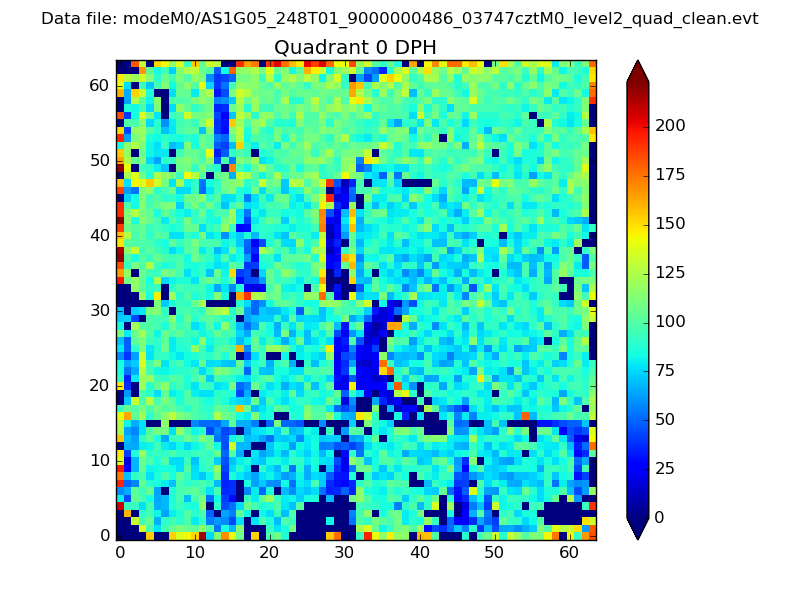 |
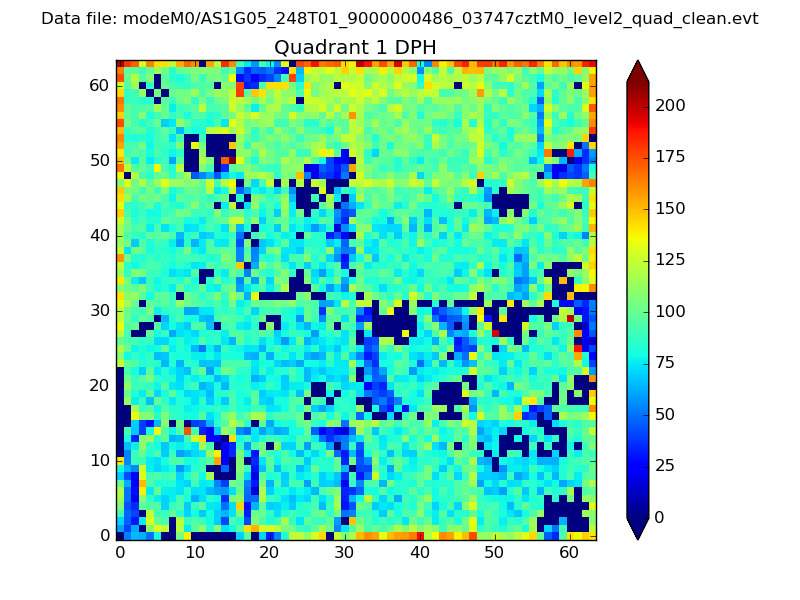 |
Quadrant B |
|---|---|---|---|
| Quadrant D | 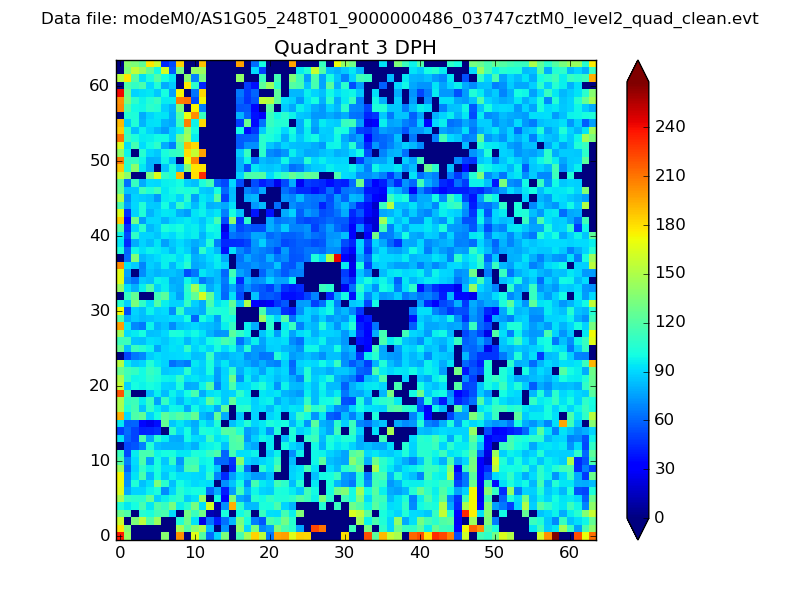 |
 |
Quadrant C |
| Plot type | Count rate plots | Images |
|---|---|---|
| Comparison with Poisson distribution Blue bars denote a histogram of data divided into 1 sec bins. Red curve is a Poisson curve with rate = median count rate of data. |
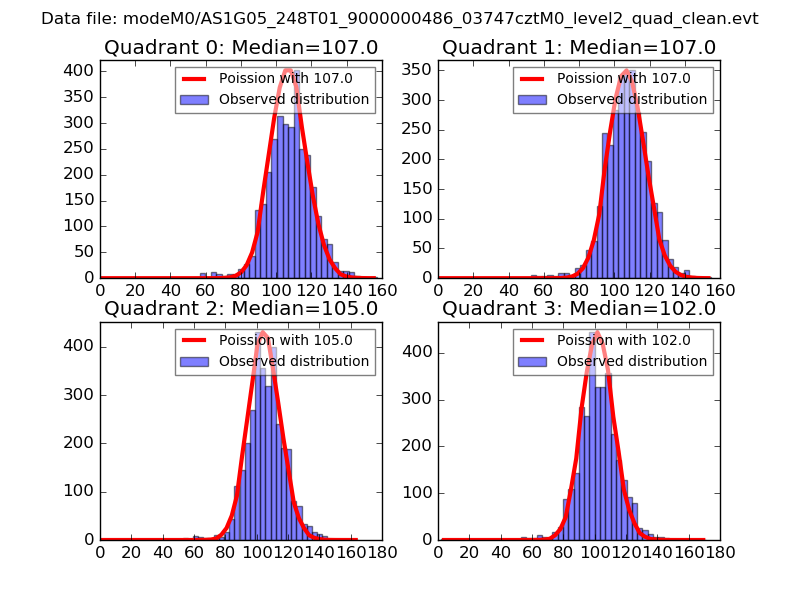 |
 |
| Quadrant-wise count rates Data is divided into 100 sec bins |
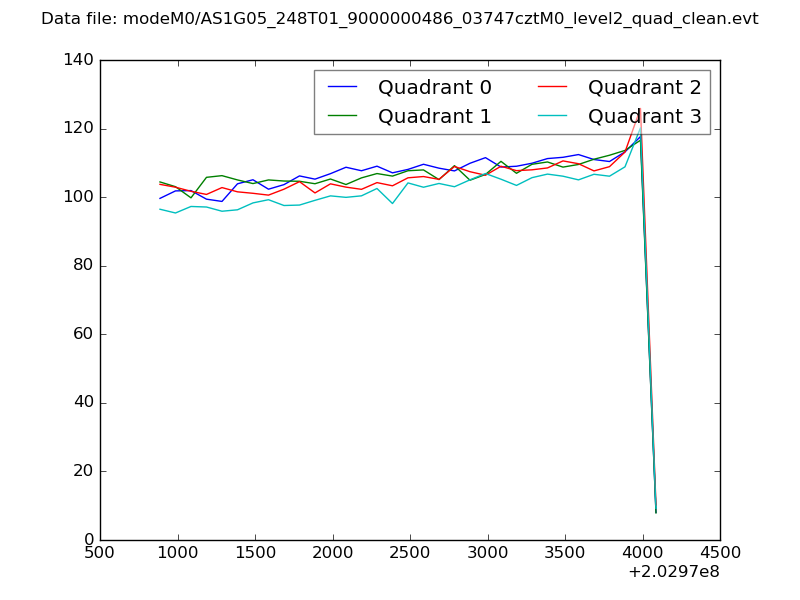 |
|
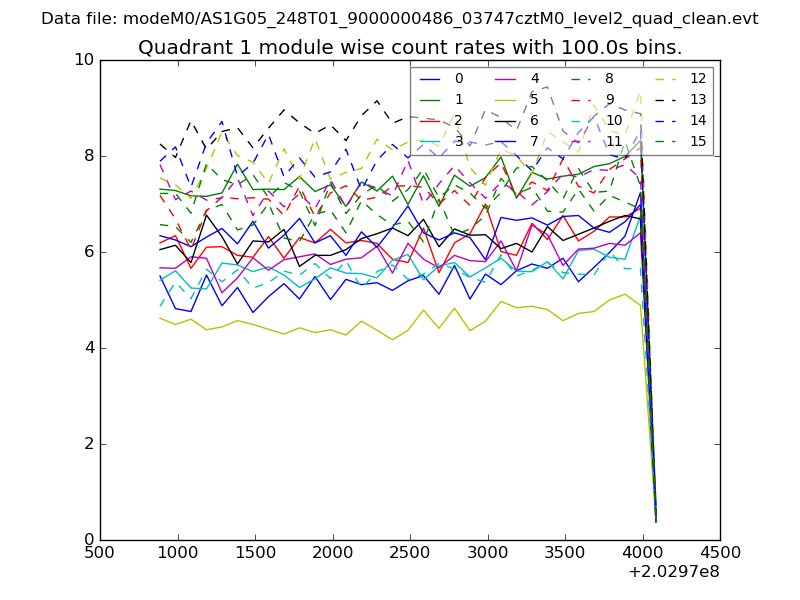
| Module-wise count rates for Quadrant A Data is divided into 100 sec bins |
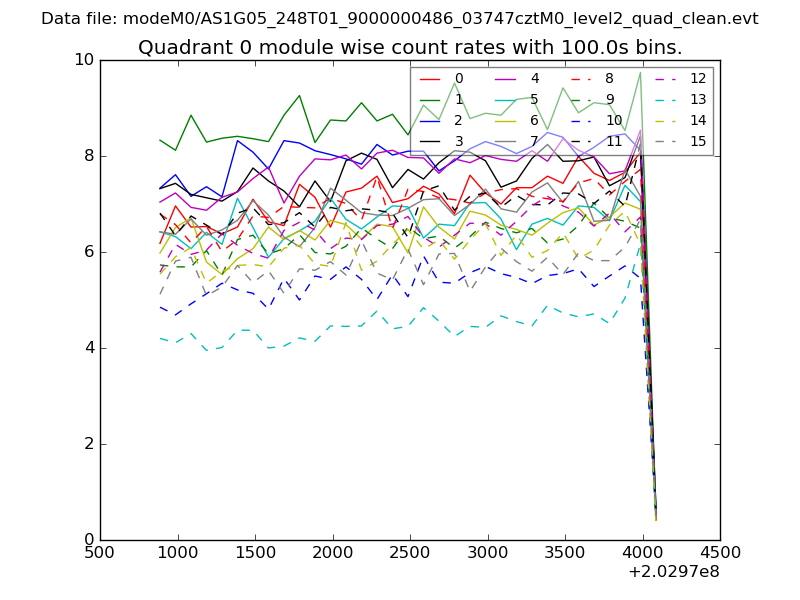 |
 |
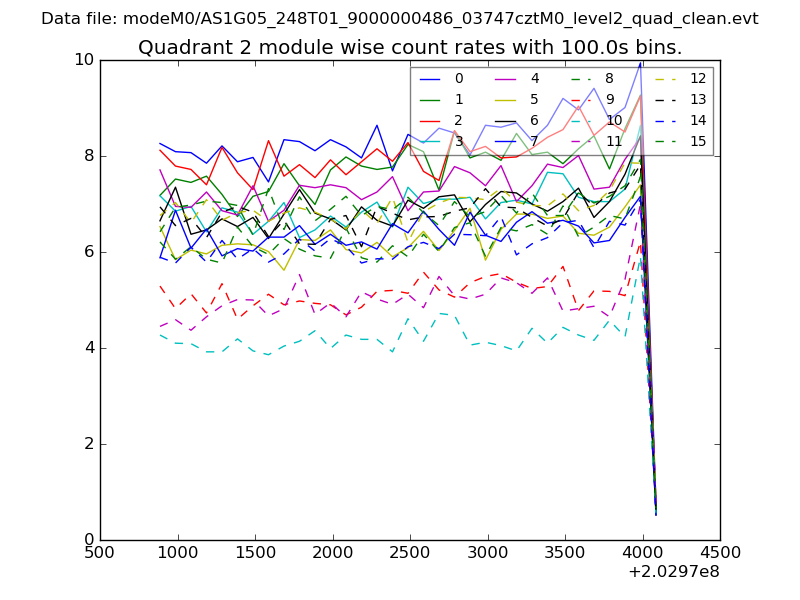
| Module-wise count rates for Quadrant B Data is divided into 100 sec bins |
 |
 |
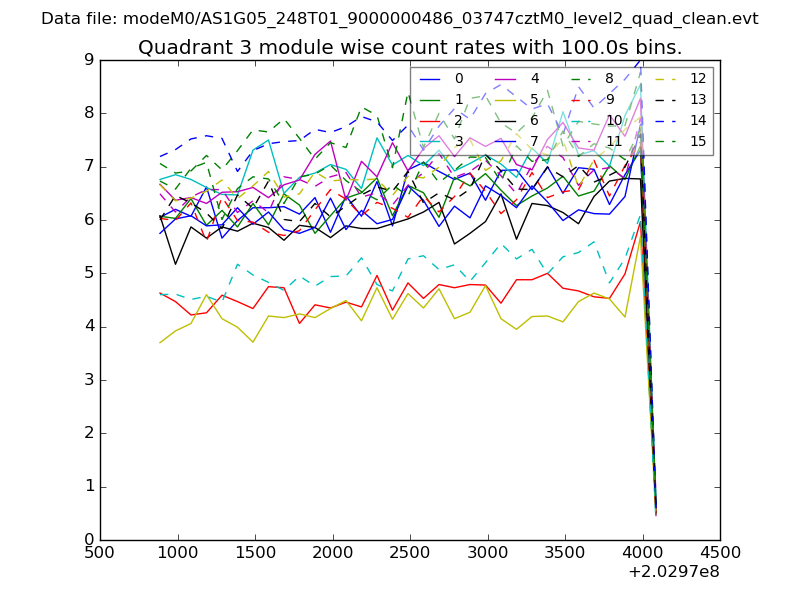
| Module-wise count rates for Quadrant C Data is divided into 100 sec bins |
 |
 |
| Module-wise count rates for Quadrant D Data is divided into 100 sec bins |
 |
 |
| Parameter | Plot |
|---|---|
| CZT HV Monitor | 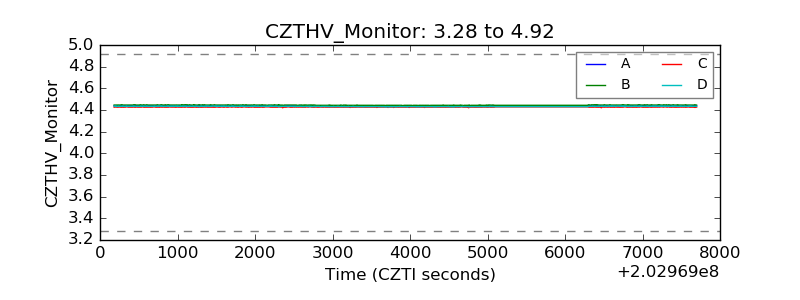 |
| D_VDD | 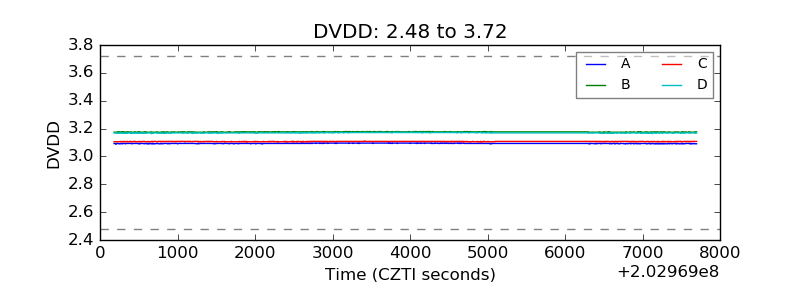 |
| Temperature 1 | 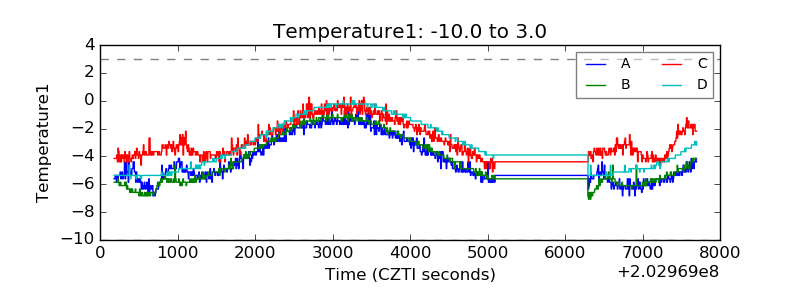 |
| Veto HV Monitor | 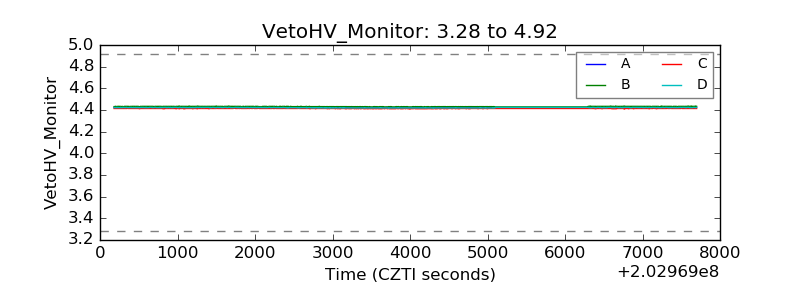 |
| Veto LLD | 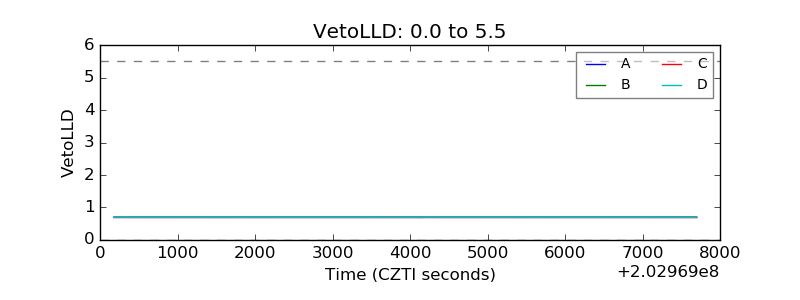 |
| Alpha Counter | 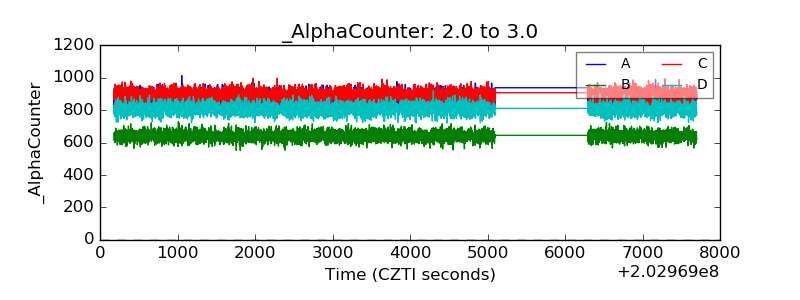 |
| _CPM_Rate | 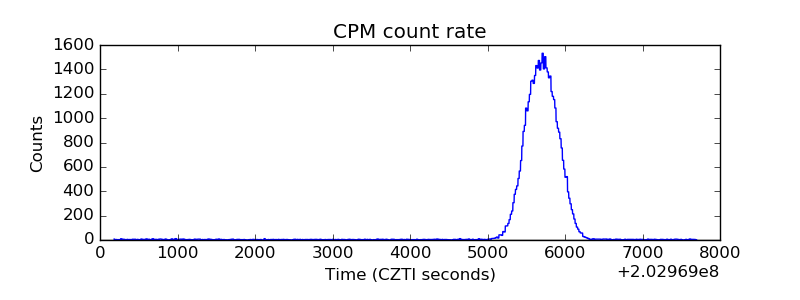 |
| CZT Counter | 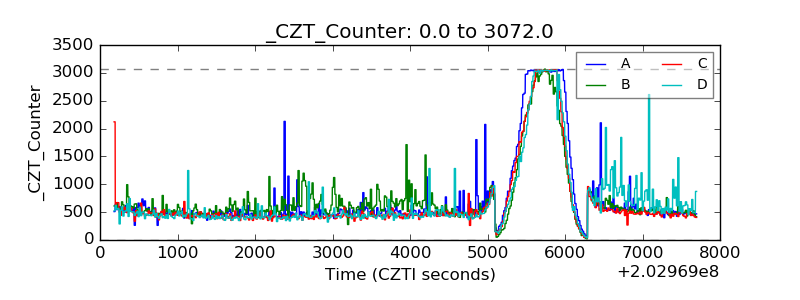 |
| +2.5 Volts monitor |  |
| +5 Volts monitor |  |
| Veto Counter | 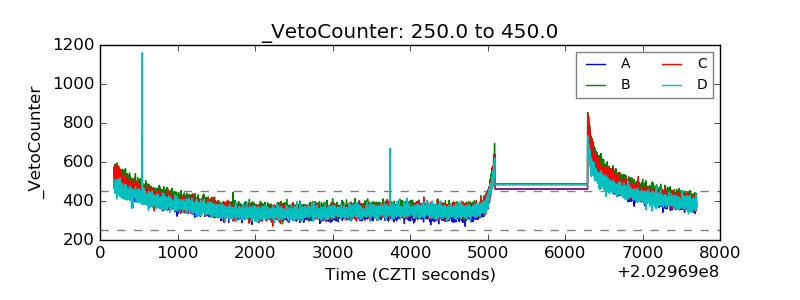 |