| Param | Original file | Final file |
|---|---|---|
| Filename | modeM0/AS1G05_248T01_9000000486_03748cztM0_level2.evt | modeM0/AS1G05_248T01_9000000486_03748cztM0_level2_quad_clean.evt |
| Size (bytes) | 478,261,440 | 64,995,840 |
| Size | 456.1 MB | 62.0 MB |
| Events in quadrant A | 3,403,983 | 394,385 |
| Events in quadrant B | 4,382,105 | 389,779 |
| Events in quadrant C | 2,873,292 | 389,217 |
| Events in quadrant D | 3,417,356 | 375,048 |
| Mode SS | |||
|---|---|---|---|
| Quadrant | BADHDUFLAG | Total packets | Discarded packets |
| A | 0 | 122 | 0 |
| B | 0 | 122 | 0 |
| C | 0 | 122 | 0 |
| D | 0 | 122 | 0 |
| Mode M9 | |||
|---|---|---|---|
| Quadrant | BADHDUFLAG | Total packets | Discarded packets |
| A | 0 | 18 | 0 |
| B | 0 | 18 | 0 |
| C | 0 | 18 | 0 |
| D | 0 | 19 | 0 |
| Mode M0 | |||
|---|---|---|---|
| Quadrant | BADHDUFLAG | Total packets | Discarded packets |
| A | 0 | 13767 | 3 |
| B | 0 | 16863 | 2 |
| C | 0 | 12463 | 2 |
| D | 0 | 14240 | 2 |
| Quadrant | Total seconds | Saturated seconds | Saturation percentage |
|---|---|---|---|
| A | 6006 | 172 | 2.863803% |
| B | 6006 | 164 | 2.730603% |
| C | 6006 | 76 | 1.265401% |
| D | 6006 | 104 | 1.731602% |
Noise dominated data is calculated using 1-second bins in cleaned event files. If a bin has >2000 counts, and if more than 50% of those come from <1% of pixels, then it is considered to be noise-dominated and hence unusable.
| Quadrant | # 1 sec bins | Bins with >0 counts | Bins with >2000 counts | High rate bins dominated by noise | Noise dominated (total time) | Noise dominated (detector-on time) | Marked lightcurve |
|---|---|---|---|---|---|---|---|
| A | 7266 | 6006 | 38 | 38 | 0.52% | 0.63% | 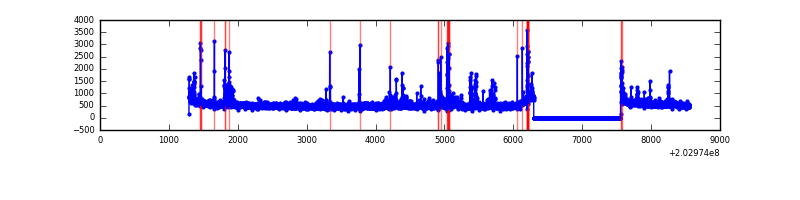 |
| B | 7266 | 6006 | 43 | 43 | 0.59% | 0.72% | 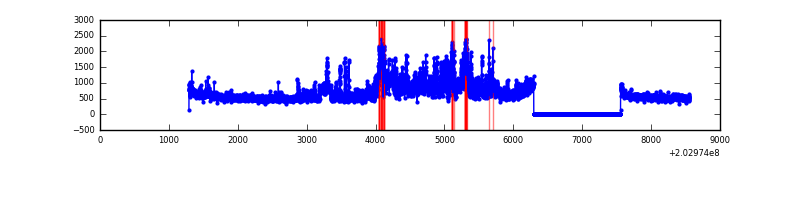 |
| C | 7266 | 6006 | 1 | 1 | 0.01% | 0.02% | 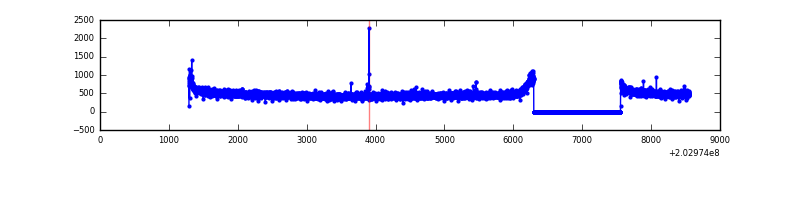 |
| D | 7266 | 6006 | 28 | 28 | 0.39% | 0.47% |  |
Top three noisy pixels from each quadrant. If the there are fewer than three noisy pixels in the level2.evt file, extra rows are filled as -1
| Pixel properties | Quadrant properties | ||||||
|---|---|---|---|---|---|---|---|
| Quadrant | DetID | PixID | Counts | Sigma | Mean | Median | Sigma |
| A | 0 | 118 | 160100 | 1049.3 | 758 | 744 | 151.9 |
| A | 8 | 15 | 140015 | 917.05 | 758 | 744 | 151.9 |
| A | 13 | 251 | 94391 | 616.63 | 758 | 744 | 151.9 |
| B | 5 | 70 | 807983 | 5504.19 | 767 | 752 | 146.7 |
| B | 15 | 204 | 429333 | 2922.32 | 767 | 752 | 146.7 |
| B | 14 | 167 | 67134 | 452.63 | 767 | 752 | 146.7 |
| C | 7 | 220 | 6632 | 34.87 | 730 | 732 | 169.2 |
| C | 13 | 61 | 6096 | 31.7 | 730 | 732 | 169.2 |
| C | 14 | 67 | 5072 | 25.65 | 730 | 732 | 169.2 |
| D | 1 | 20 | 473700 | 2768.26 | 727 | 708 | 170.9 |
| D | 6 | 112 | 60291 | 348.72 | 727 | 708 | 170.9 |
| D | 9 | 35 | 38617 | 221.87 | 727 | 708 | 170.9 |
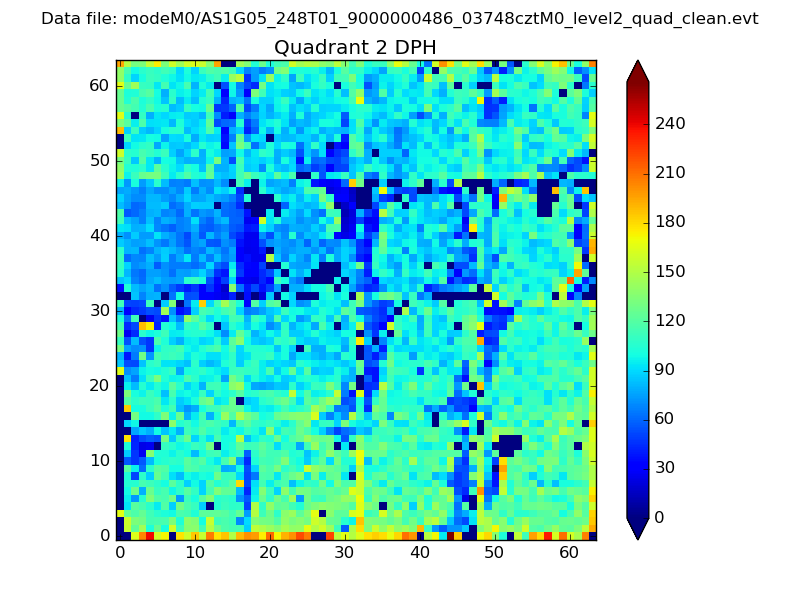
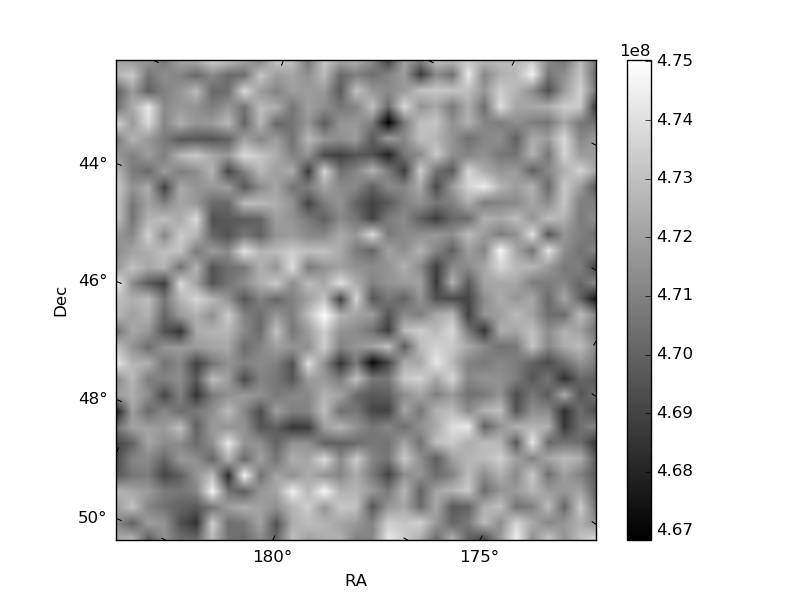
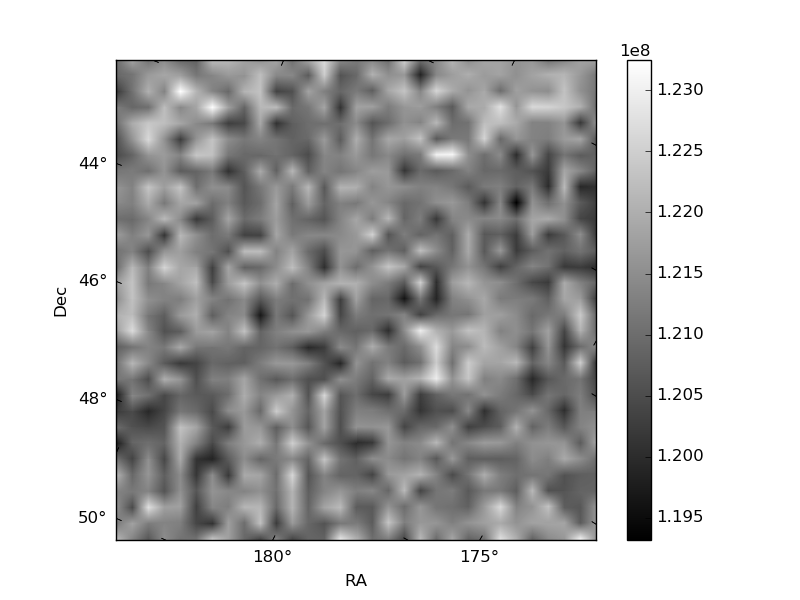
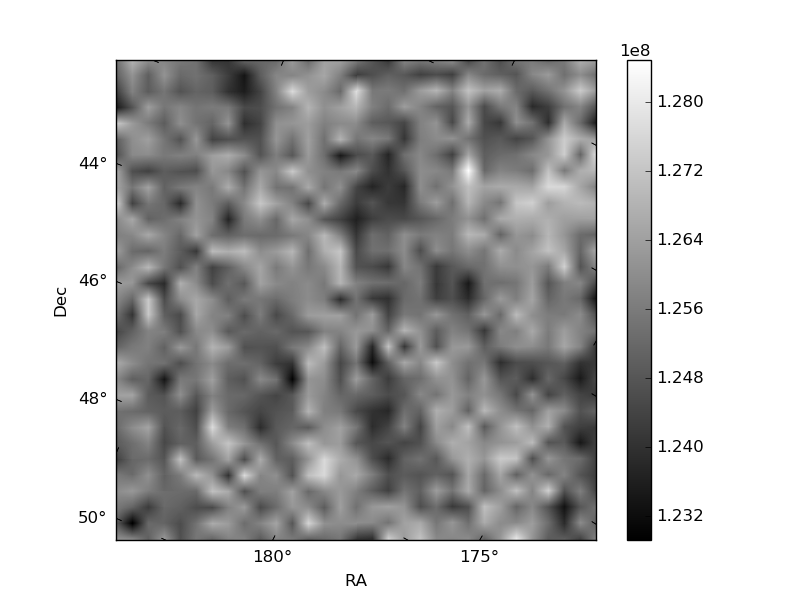
Histogram calculated using DETX and DETY for each event in the final _common_clean file
| Quadrant A | 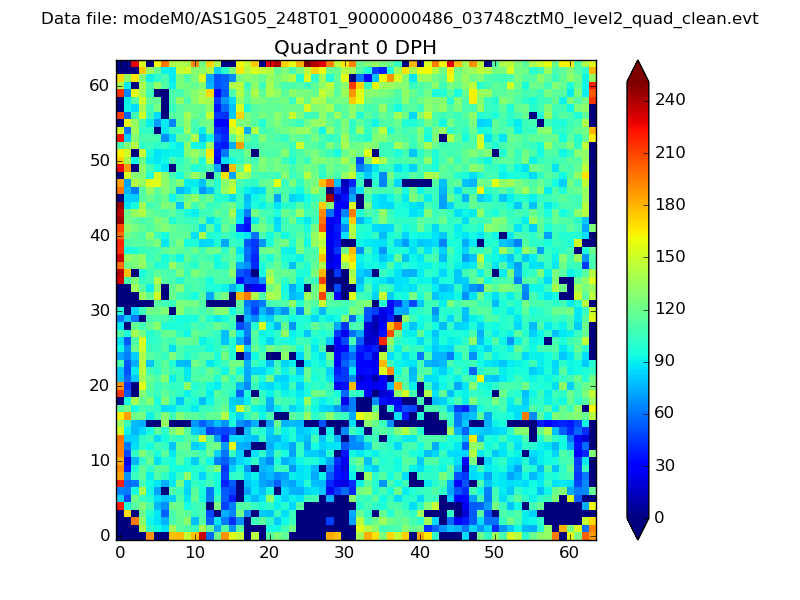 |
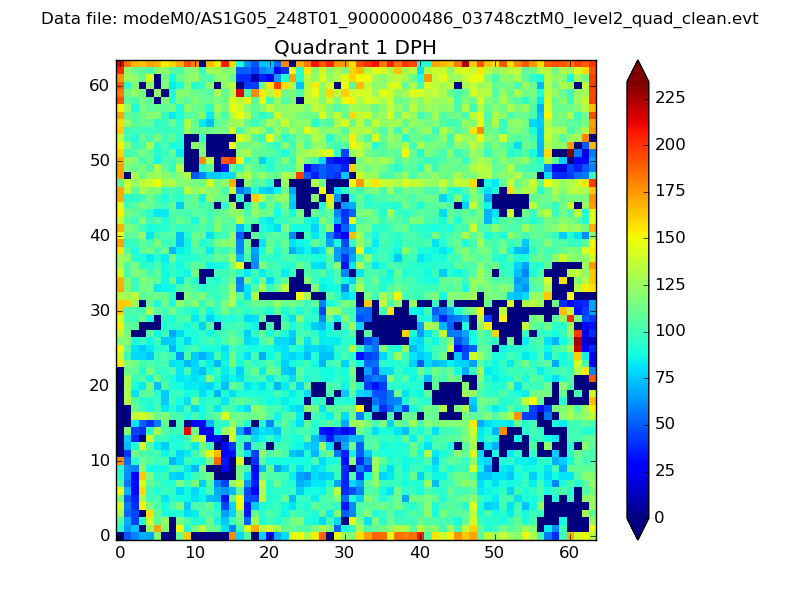 |
Quadrant B |
|---|---|---|---|
| Quadrant D | 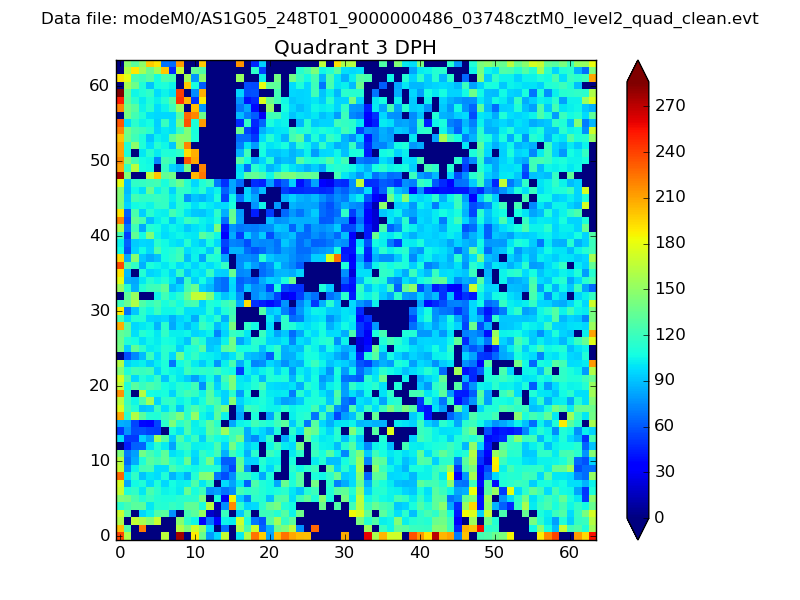 |
 |
Quadrant C |
| Plot type | Count rate plots | Images |
|---|---|---|
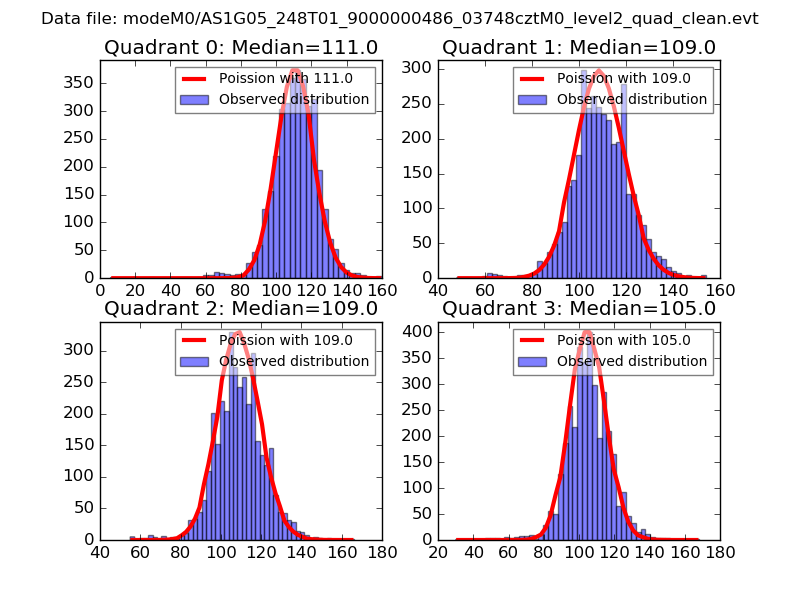
| Comparison with Poisson distribution Blue bars denote a histogram of data divided into 1 sec bins. Red curve is a Poisson curve with rate = median count rate of data. |
 |
 |
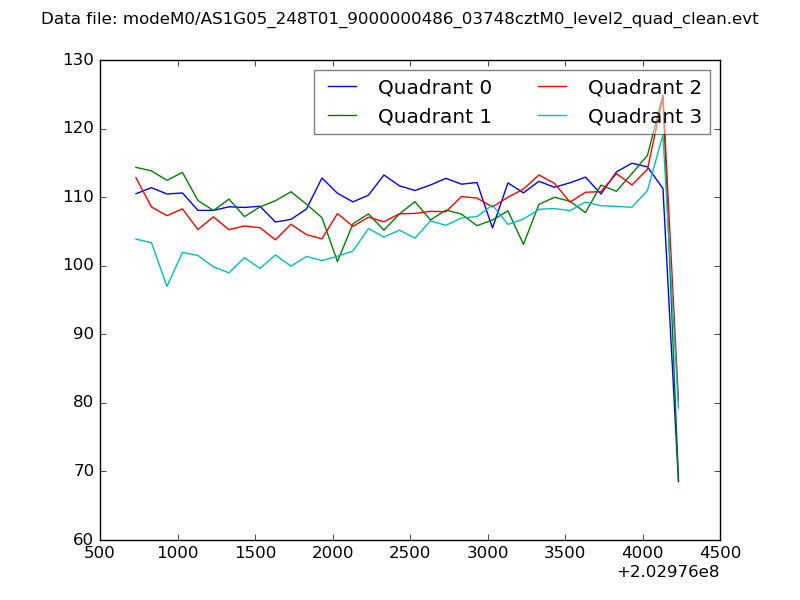
| Quadrant-wise count rates Data is divided into 100 sec bins |
 |
|
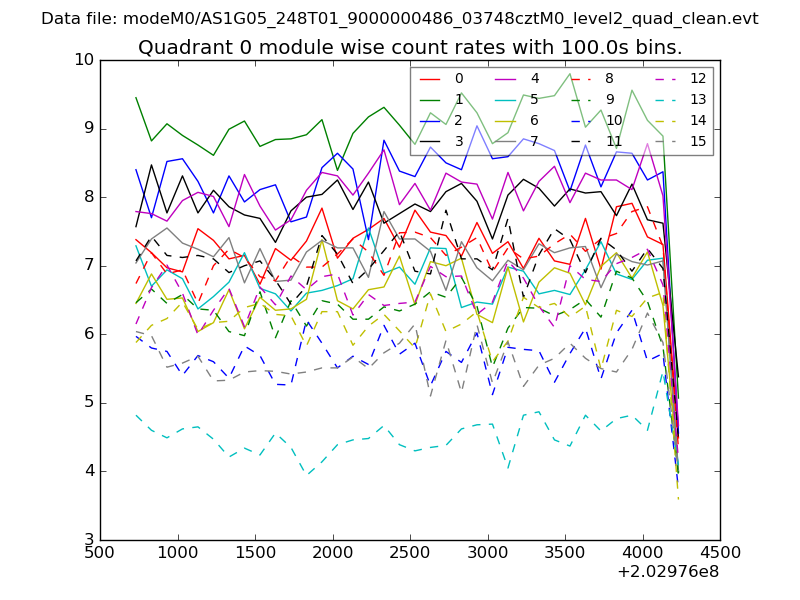
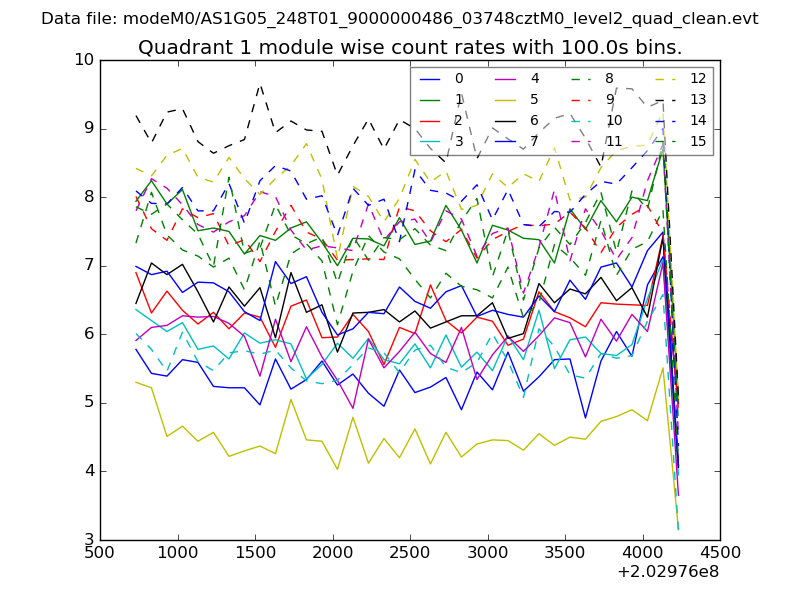
| Module-wise count rates for Quadrant A Data is divided into 100 sec bins |
 |
 |
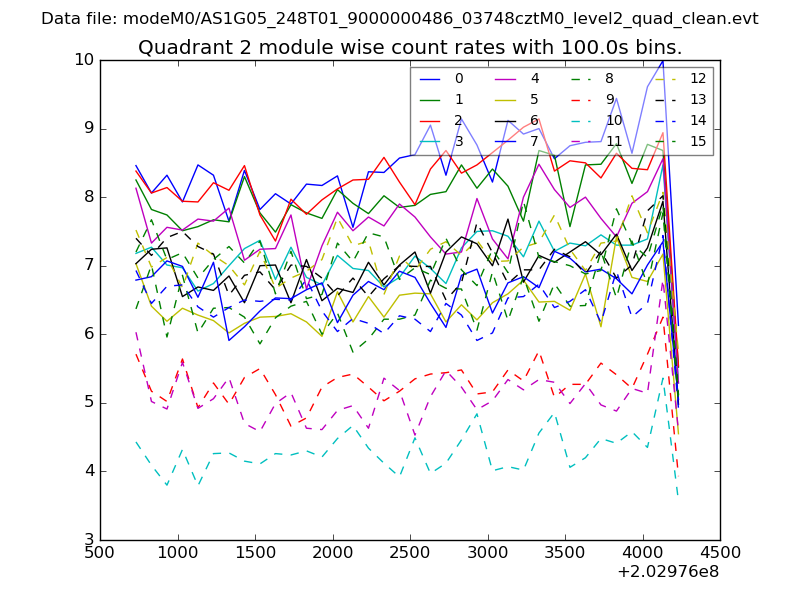
| Module-wise count rates for Quadrant B Data is divided into 100 sec bins |
 |
 |
| Module-wise count rates for Quadrant C Data is divided into 100 sec bins |
 |
 |
| Module-wise count rates for Quadrant D Data is divided into 100 sec bins |
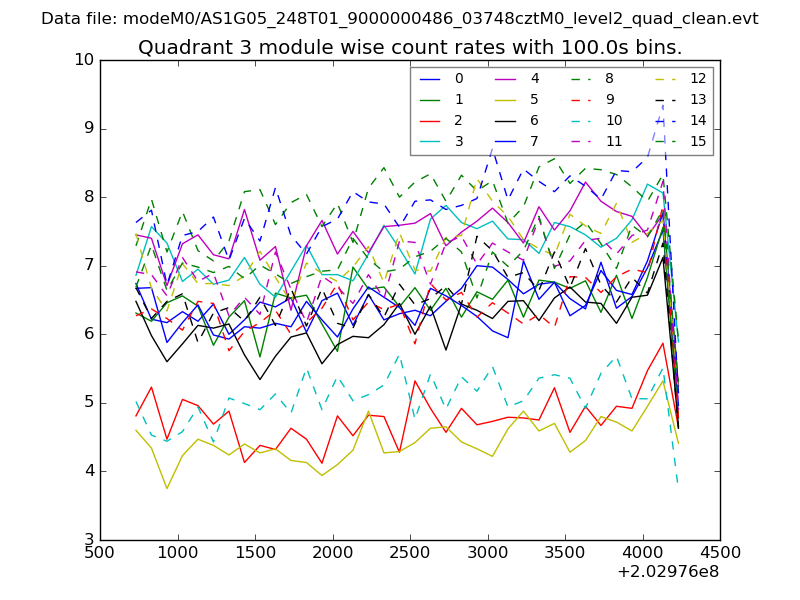 |
 |
| Parameter | Plot |
|---|---|
| CZT HV Monitor | 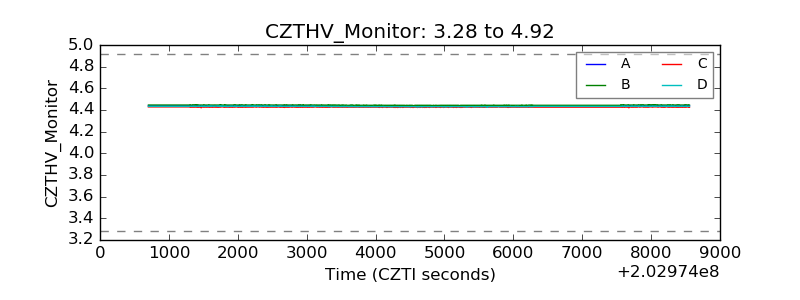 |
| D_VDD | 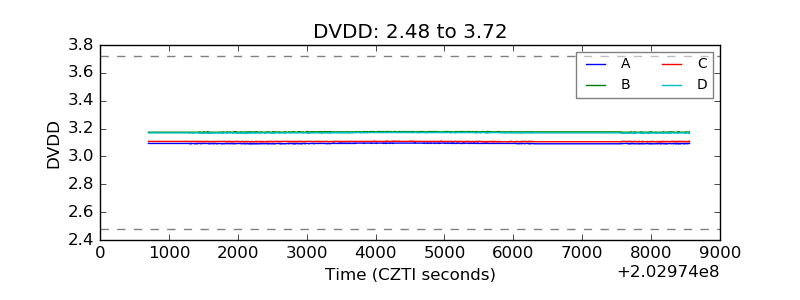 |
| Temperature 1 | 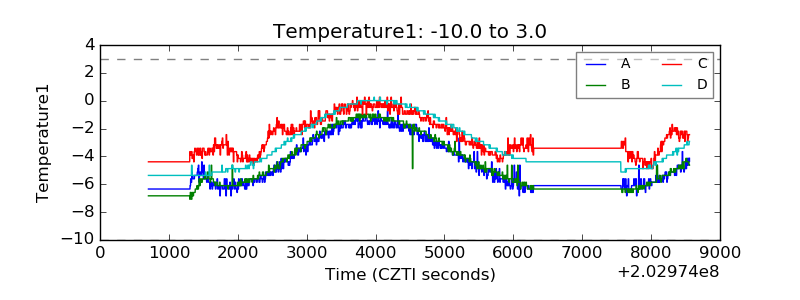 |
| Veto HV Monitor | 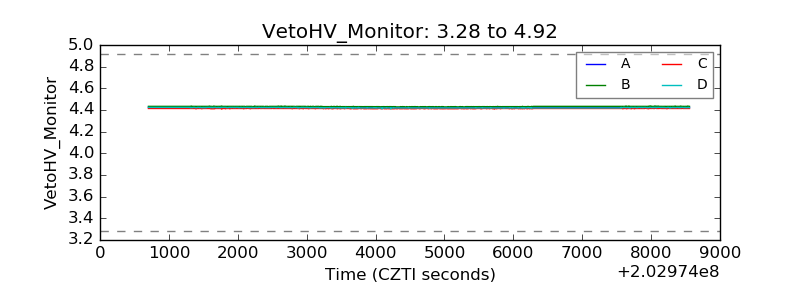 |
| Veto LLD | 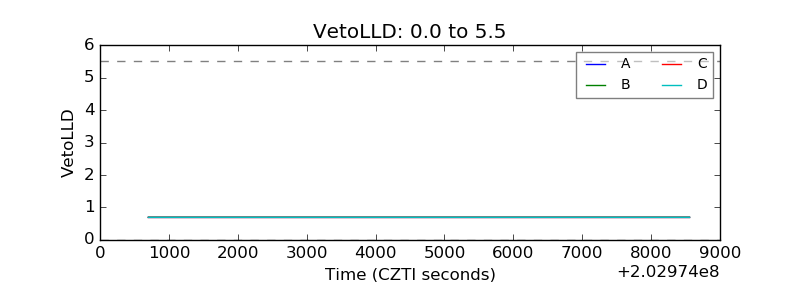 |
| Alpha Counter | 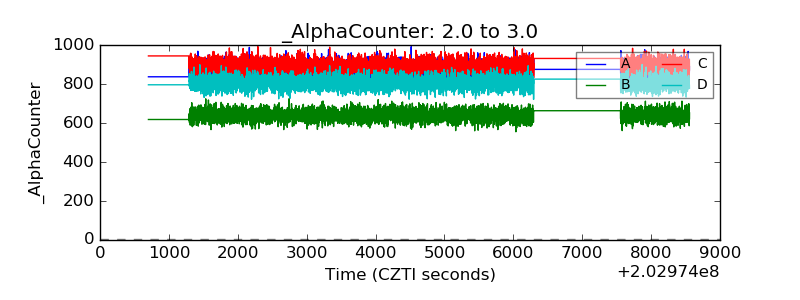 |
| _CPM_Rate | 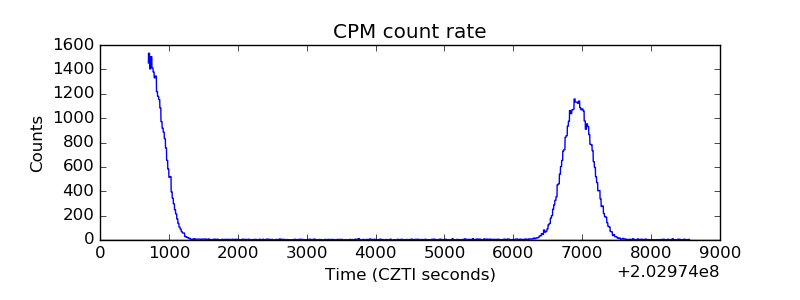 |
| CZT Counter | 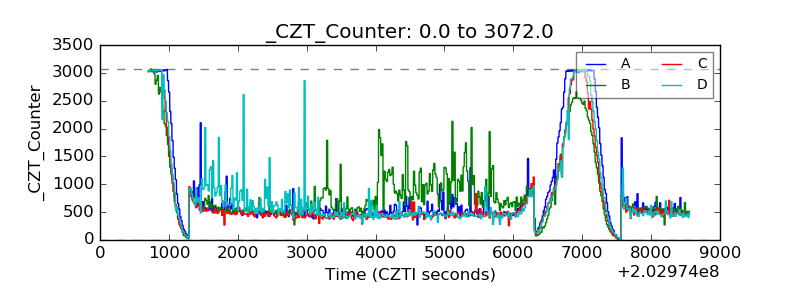 |
| +2.5 Volts monitor |  |
| +5 Volts monitor | 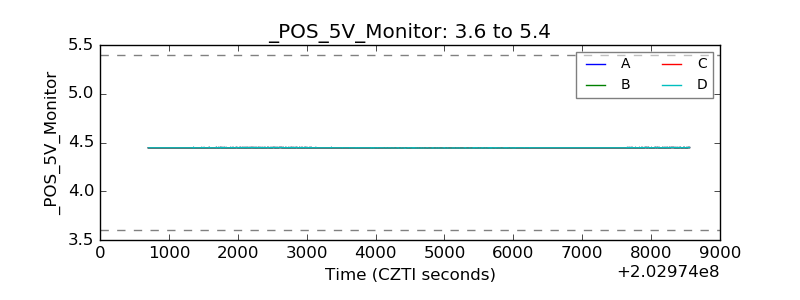 |
| Veto Counter | 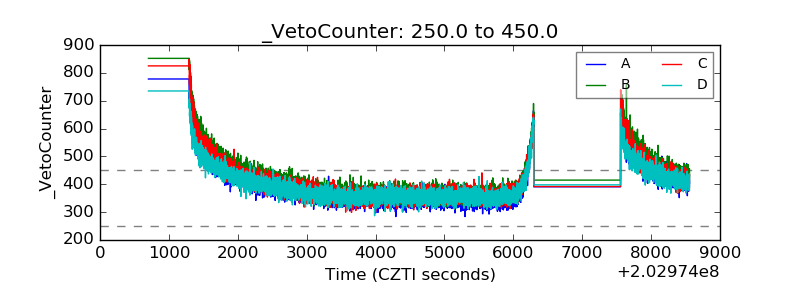 |