| Param | Original file | Final file |
|---|---|---|
| Filename | modeM0/AS1G05_248T01_9000000486_03749cztM0_level2.evt | modeM0/AS1G05_248T01_9000000486_03749cztM0_level2_quad_clean.evt |
| Size (bytes) | 480,980,160 | 79,698,240 |
| Size | 458.7 MB | 76.0 MB |
| Events in quadrant A | 3,969,459 | 498,380 |
| Events in quadrant B | 4,048,840 | 504,014 |
| Events in quadrant C | 2,989,186 | 490,669 |
| Events in quadrant D | 3,129,987 | 479,169 |
| Mode SS | |||
|---|---|---|---|
| Quadrant | BADHDUFLAG | Total packets | Discarded packets |
| A | 0 | 128 | 0 |
| B | 0 | 128 | 0 |
| C | 0 | 128 | 0 |
| D | 0 | 128 | 0 |
| Mode M9 | |||
|---|---|---|---|
| Quadrant | BADHDUFLAG | Total packets | Discarded packets |
| A | 0 | 15 | 0 |
| B | 0 | 15 | 0 |
| C | 0 | 15 | 0 |
| D | 0 | 16 | 0 |
| Mode M0 | |||
|---|---|---|---|
| Quadrant | BADHDUFLAG | Total packets | Discarded packets |
| A | 0 | 15657 | 3 |
| B | 0 | 16079 | 2 |
| C | 0 | 13072 | 2 |
| D | 0 | 13465 | 2 |
| Quadrant | Total seconds | Saturated seconds | Saturation percentage |
|---|---|---|---|
| A | 6321 | 198 | 3.132416% |
| B | 6321 | 164 | 2.594526% |
| C | 6321 | 76 | 1.202341% |
| D | 6321 | 92 | 1.455466% |
Noise dominated data is calculated using 1-second bins in cleaned event files. If a bin has >2000 counts, and if more than 50% of those come from <1% of pixels, then it is considered to be noise-dominated and hence unusable.
| Quadrant | # 1 sec bins | Bins with >0 counts | Bins with >2000 counts | High rate bins dominated by noise | Noise dominated (total time) | Noise dominated (detector-on time) | Marked lightcurve |
|---|---|---|---|---|---|---|---|
| A | 7583 | 6322 | 59 | 59 | 0.78% | 0.93% | 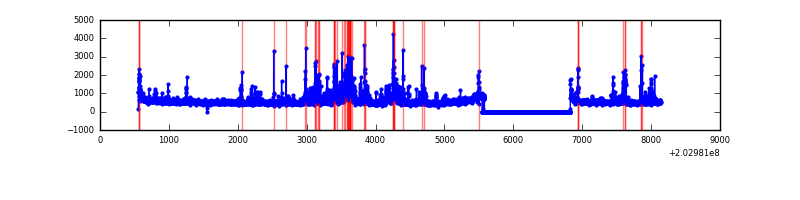 |
| B | 7583 | 6322 | 7 | 7 | 0.09% | 0.11% | 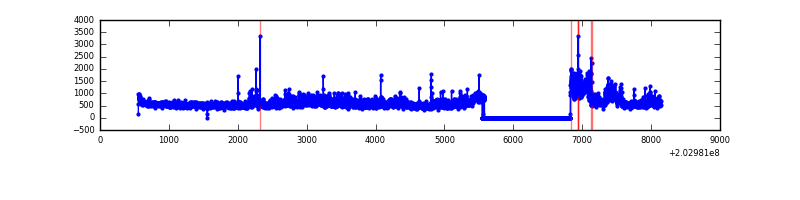 |
| C | 7583 | 6323 | 5 | 5 | 0.07% | 0.08% | 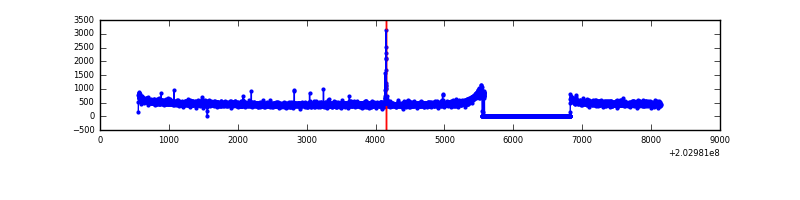 |
| D | 7583 | 6323 | 16 | 16 | 0.21% | 0.25% | 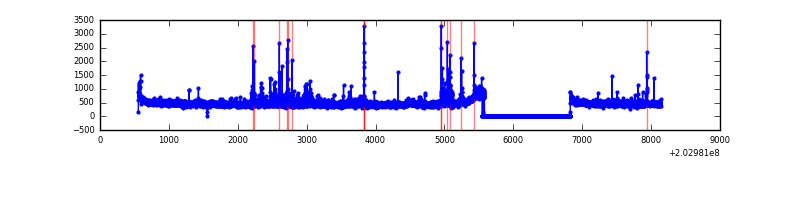 |
Top three noisy pixels from each quadrant. If the there are fewer than three noisy pixels in the level2.evt file, extra rows are filled as -1
| Pixel properties | Quadrant properties | ||||||
|---|---|---|---|---|---|---|---|
| Quadrant | DetID | PixID | Counts | Sigma | Mean | Median | Sigma |
| A | 0 | 118 | 320686 | 1976.49 | 788 | 773 | 161.9 |
| A | 13 | 251 | 283722 | 1748.12 | 788 | 773 | 161.9 |
| A | 8 | 15 | 202759 | 1247.91 | 788 | 773 | 161.9 |
| B | 0 | 173 | 379889 | 2482.06 | 793 | 775 | 152.7 |
| B | 15 | 204 | 378362 | 2472.07 | 793 | 775 | 152.7 |
| B | 14 | 167 | 80816 | 524.03 | 793 | 775 | 152.7 |
| C | 1 | 16 | 26090 | 144.19 | 755 | 759 | 175.7 |
| C | 14 | 67 | 6695 | 33.79 | 755 | 759 | 175.7 |
| C | 13 | 61 | 6368 | 31.93 | 755 | 759 | 175.7 |
| D | 8 | 112 | 71833 | 391.93 | 761 | 739 | 181.4 |
| D | 6 | 16 | 31861 | 171.57 | 761 | 739 | 181.4 |
| D | 13 | 223 | 22965 | 122.53 | 761 | 739 | 181.4 |
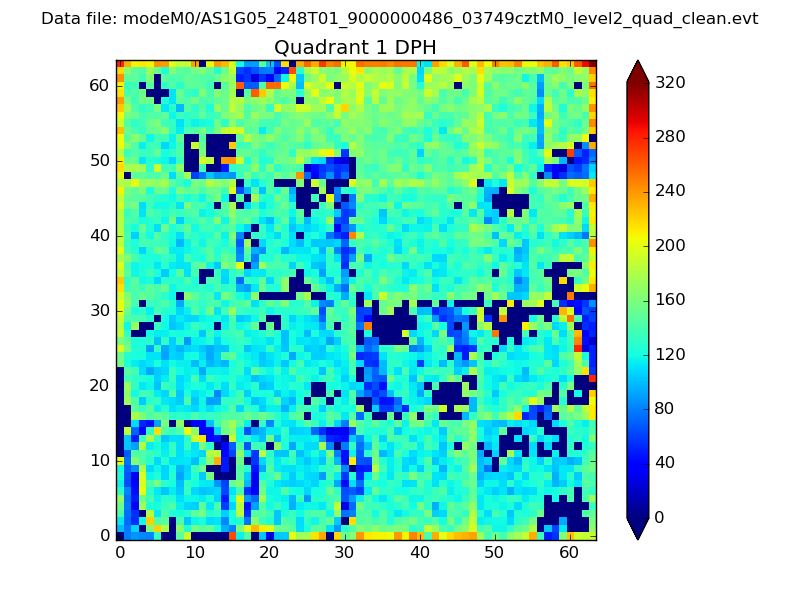
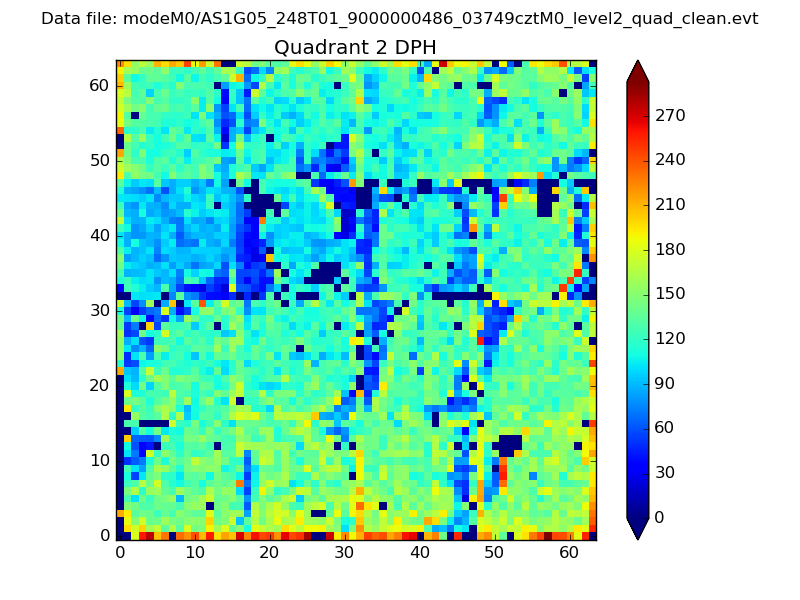
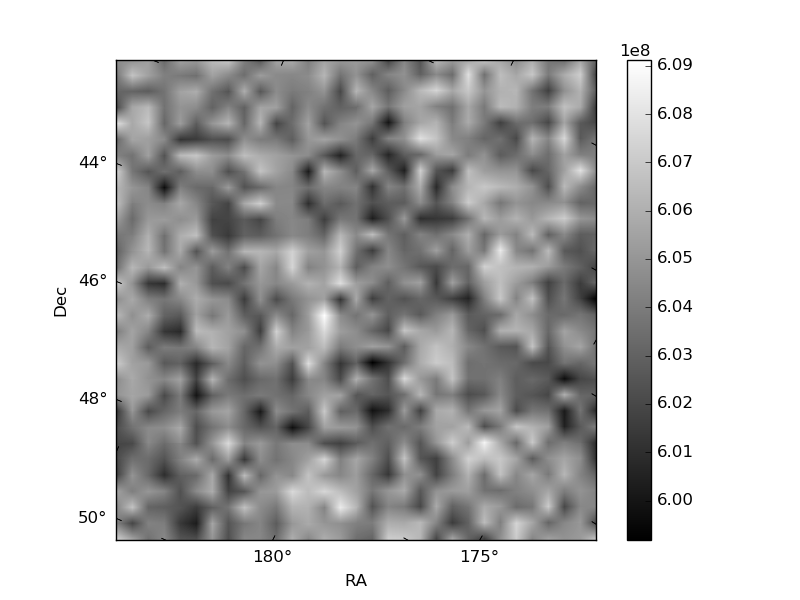
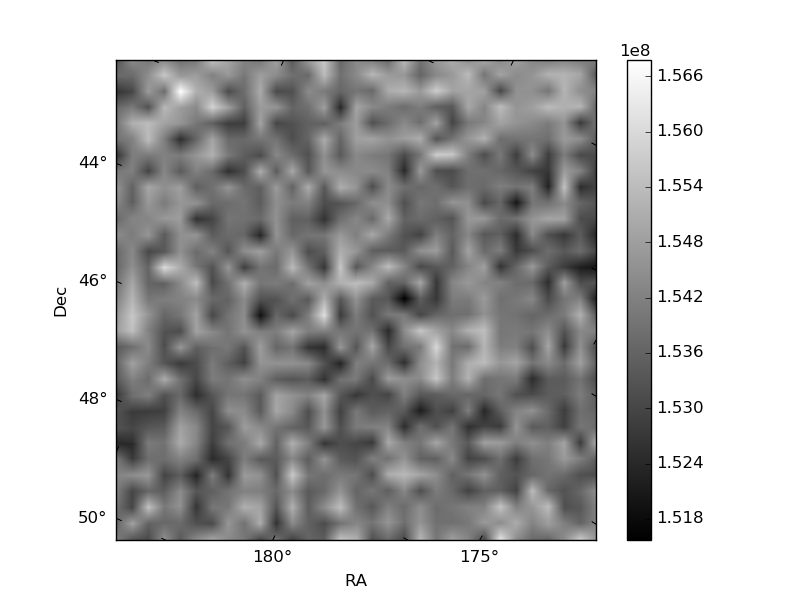
Histogram calculated using DETX and DETY for each event in the final _common_clean file
| Quadrant A |  |
 |
Quadrant B |
|---|---|---|---|
| Quadrant D | 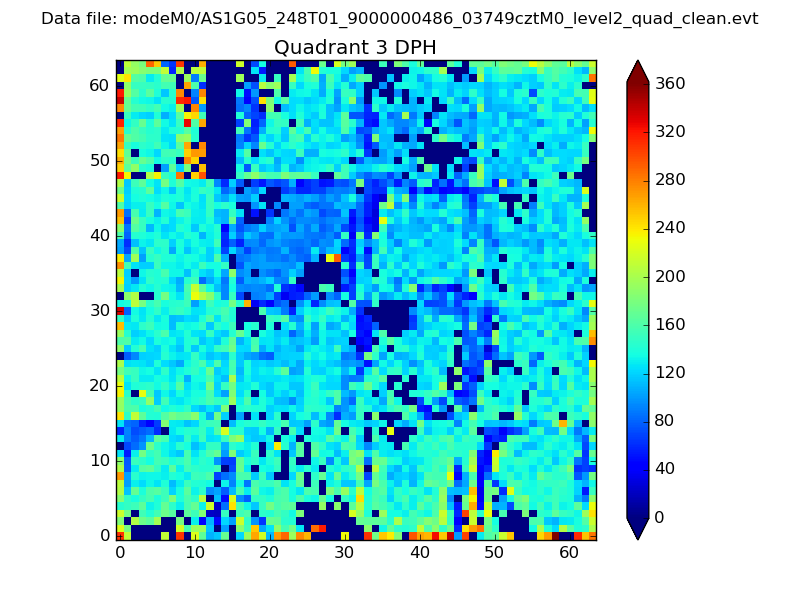 |
 |
Quadrant C |
| Plot type | Count rate plots | Images |
|---|---|---|
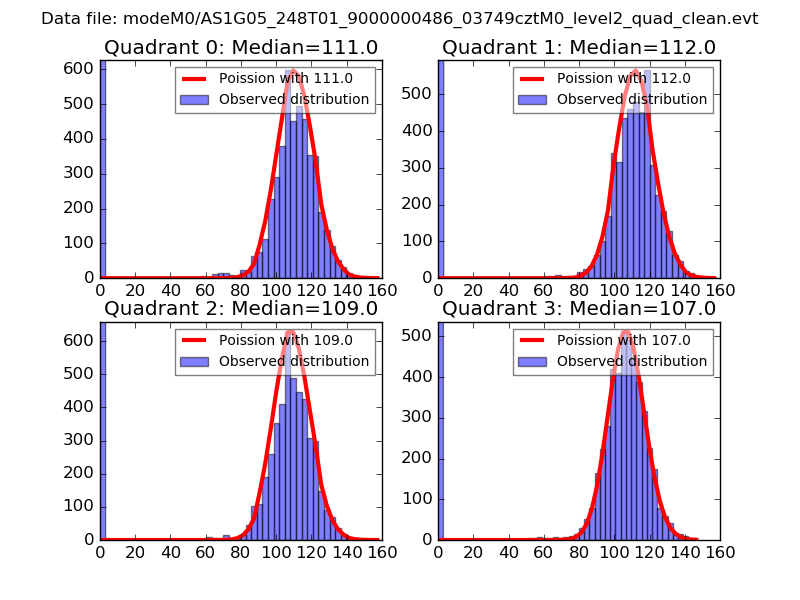
| Comparison with Poisson distribution Blue bars denote a histogram of data divided into 1 sec bins. Red curve is a Poisson curve with rate = median count rate of data. |
 |
 |
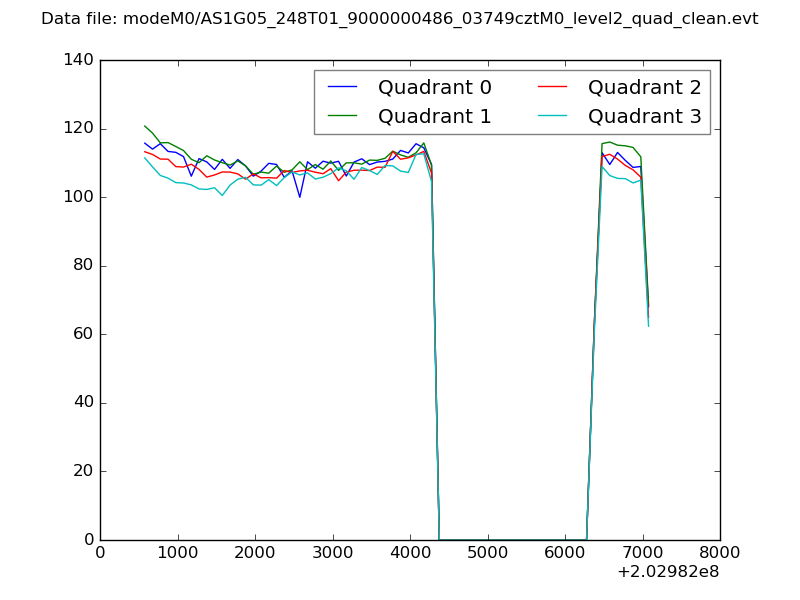
| Quadrant-wise count rates Data is divided into 100 sec bins |
 |
|
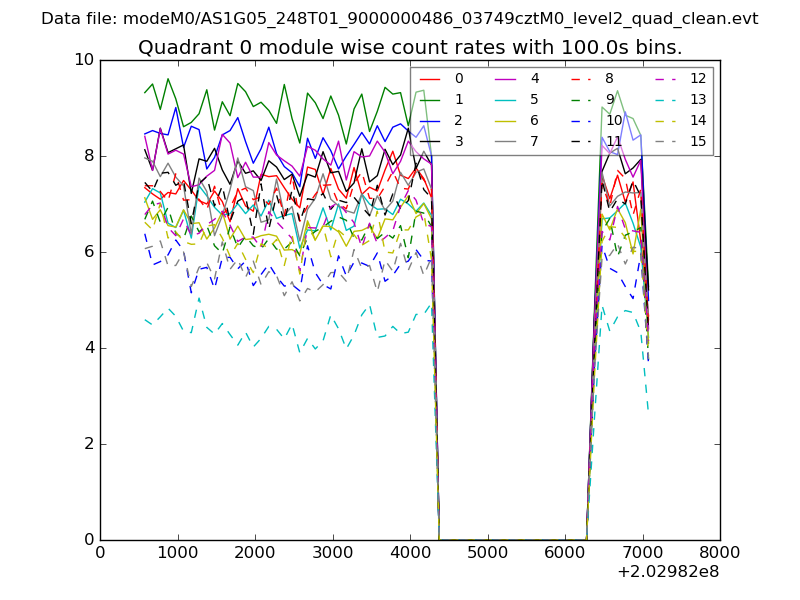
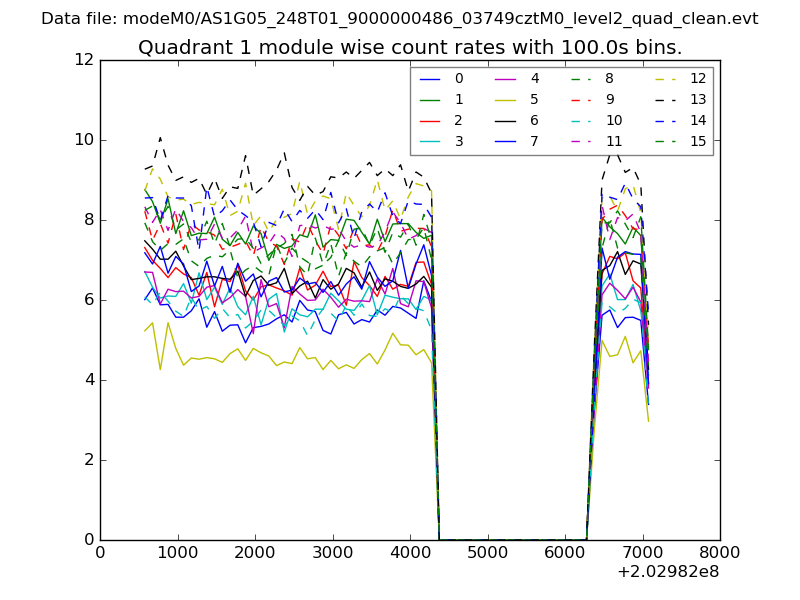
| Module-wise count rates for Quadrant A Data is divided into 100 sec bins |
 |
 |
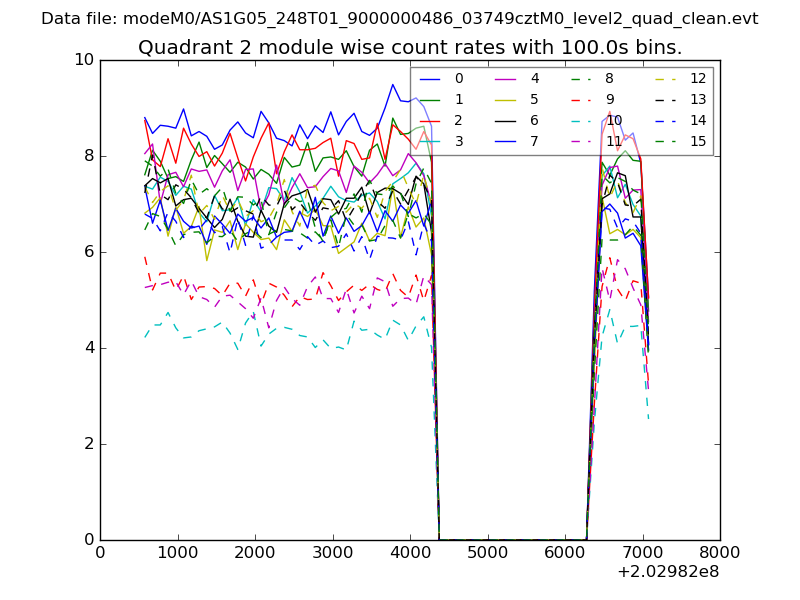
| Module-wise count rates for Quadrant B Data is divided into 100 sec bins |
 |
 |
| Module-wise count rates for Quadrant C Data is divided into 100 sec bins |
 |
 |
| Module-wise count rates for Quadrant D Data is divided into 100 sec bins |
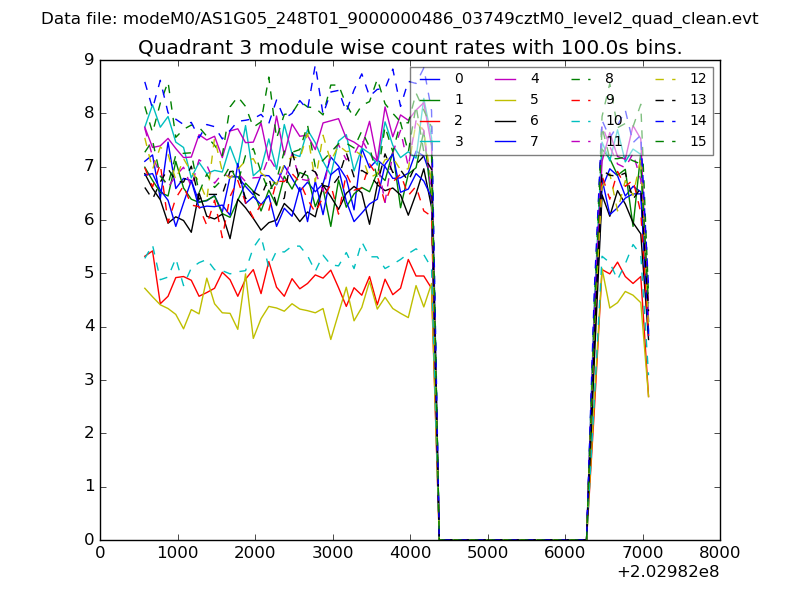 |
 |
| Parameter | Plot |
|---|---|
| CZT HV Monitor | 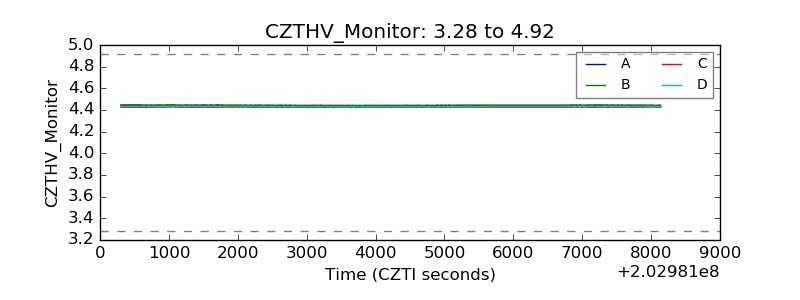 |
| D_VDD | 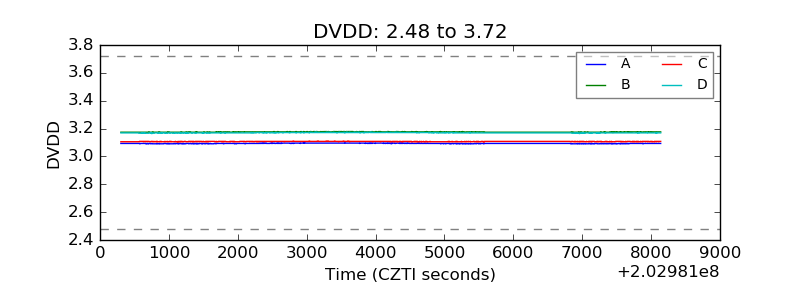 |
| Temperature 1 | 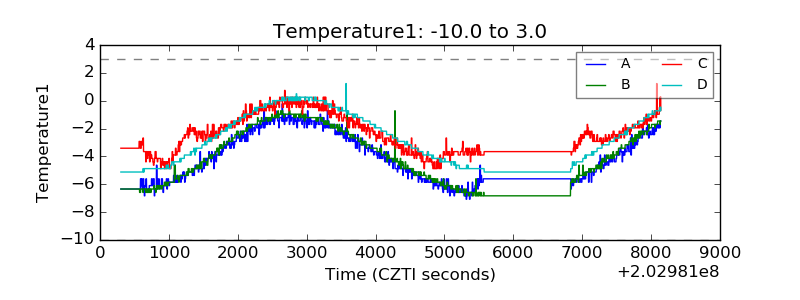 |
| Veto HV Monitor | 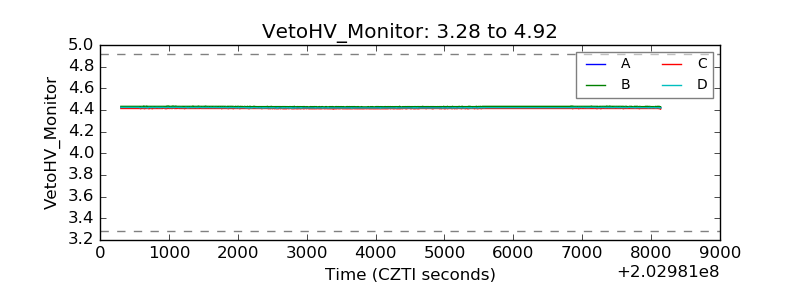 |
| Veto LLD | 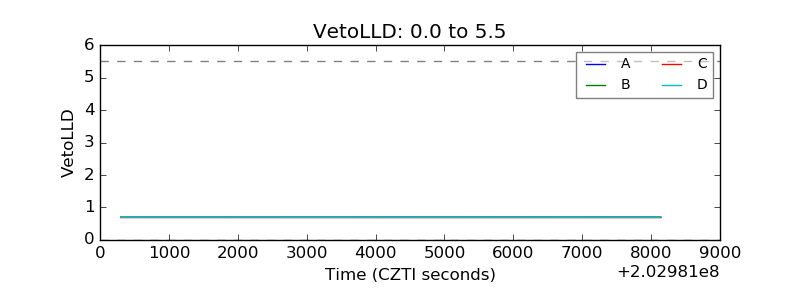 |
| Alpha Counter | 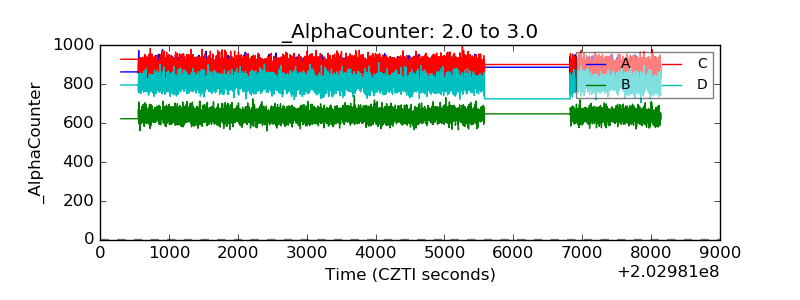 |
| _CPM_Rate | 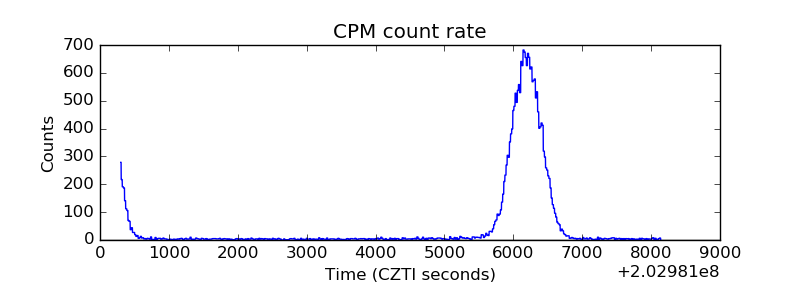 |
| CZT Counter | 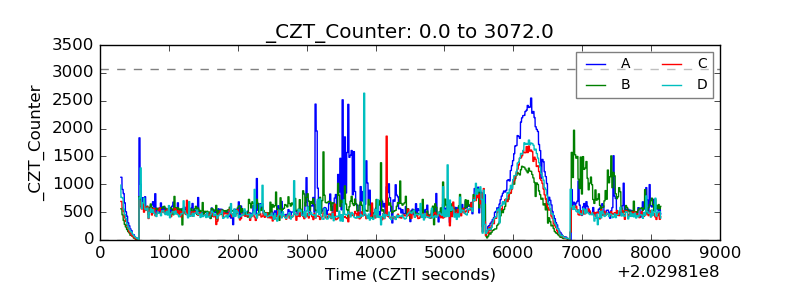 |
| +2.5 Volts monitor | 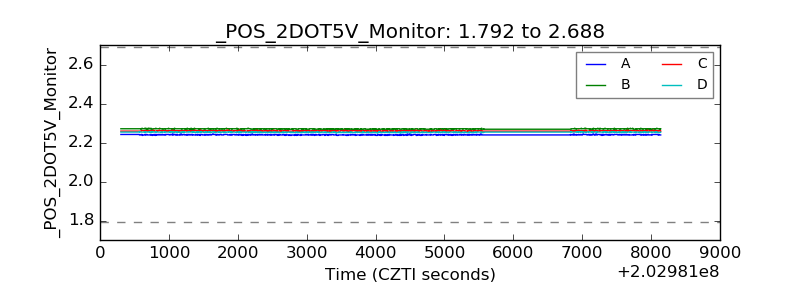 |
| +5 Volts monitor |  |
| Veto Counter | 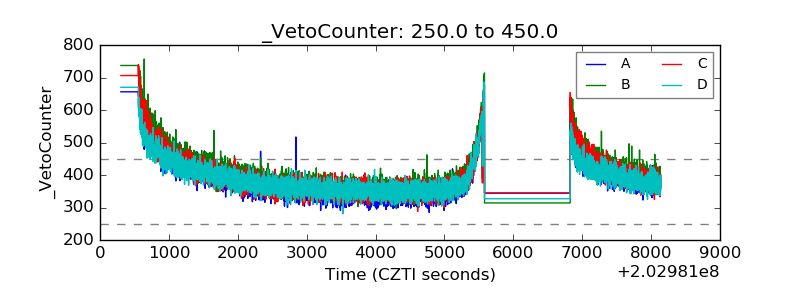 |