| Param | Original file | Final file |
|---|---|---|
| Filename | modeM0/AS1G05_248T01_9000000486_03750cztM0_level2.evt | modeM0/AS1G05_248T01_9000000486_03750cztM0_level2_quad_clean.evt |
| Size (bytes) | 525,507,840 | 89,331,840 |
| Size | 501.2 MB | 85.2 MB |
| Events in quadrant A | 4,083,091 | 563,273 |
| Events in quadrant B | 4,482,957 | 567,684 |
| Events in quadrant C | 3,162,781 | 556,686 |
| Events in quadrant D | 3,718,017 | 537,020 |
| Mode SS | |||
|---|---|---|---|
| Quadrant | BADHDUFLAG | Total packets | Discarded packets |
| A | 0 | 140 | 0 |
| B | 0 | 140 | 0 |
| C | 0 | 140 | 0 |
| D | 0 | 140 | 0 |
| Mode M9 | |||
|---|---|---|---|
| Quadrant | BADHDUFLAG | Total packets | Discarded packets |
| A | 0 | 17 | 0 |
| B | 0 | 17 | 0 |
| C | 0 | 17 | 0 |
| D | 0 | 18 | 0 |
| Mode M0 | |||
|---|---|---|---|
| Quadrant | BADHDUFLAG | Total packets | Discarded packets |
| A | 0 | 16441 | 3 |
| B | 0 | 17769 | 2 |
| C | 0 | 14201 | 2 |
| D | 0 | 15904 | 2 |
| Quadrant | Total seconds | Saturated seconds | Saturation percentage |
|---|---|---|---|
| A | 6897 | 277 | 4.016239% |
| B | 6897 | 244 | 3.537770% |
| C | 6897 | 134 | 1.942874% |
| D | 6897 | 224 | 3.247789% |
Noise dominated data is calculated using 1-second bins in cleaned event files. If a bin has >2000 counts, and if more than 50% of those come from <1% of pixels, then it is considered to be noise-dominated and hence unusable.
| Quadrant | # 1 sec bins | Bins with >0 counts | Bins with >2000 counts | High rate bins dominated by noise | Noise dominated (total time) | Noise dominated (detector-on time) | Marked lightcurve |
|---|---|---|---|---|---|---|---|
| A | 7927 | 6897 | 72 | 72 | 0.91% | 1.04% | 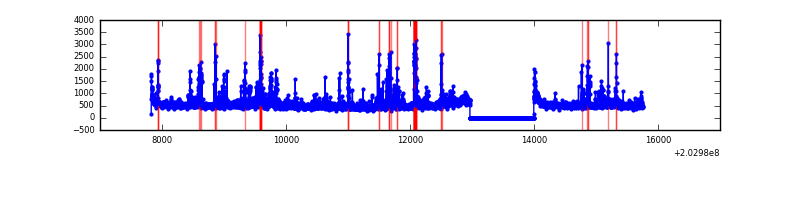 |
| B | 7927 | 6897 | 21 | 21 | 0.26% | 0.30% | 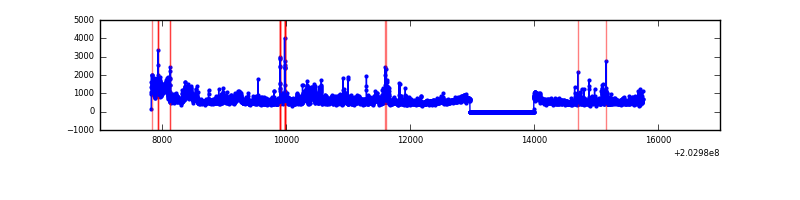 |
| C | 7927 | 6897 | 0 | 0 | 0.00% | 0.00% | 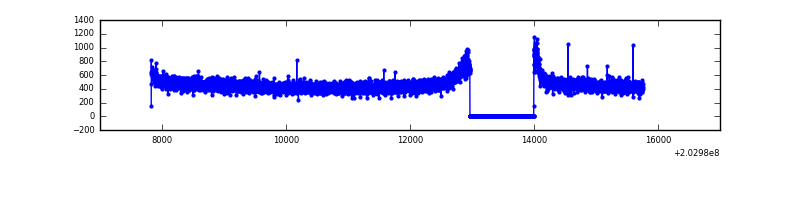 |
| D | 7927 | 6897 | 83 | 83 | 1.05% | 1.20% | 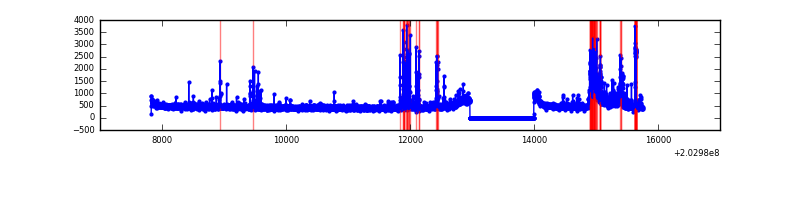 |
Top three noisy pixels from each quadrant. If the there are fewer than three noisy pixels in the level2.evt file, extra rows are filled as -1
| Pixel properties | Quadrant properties | ||||||
|---|---|---|---|---|---|---|---|
| Quadrant | DetID | PixID | Counts | Sigma | Mean | Median | Sigma |
| A | 13 | 251 | 321694 | 1870.62 | 833 | 814 | 171.5 |
| A | 0 | 118 | 313354 | 1822.0 | 833 | 814 | 171.5 |
| A | 8 | 15 | 123835 | 717.17 | 833 | 814 | 171.5 |
| B | 0 | 173 | 508588 | 3103.12 | 839 | 819 | 163.6 |
| B | 15 | 204 | 405315 | 2471.99 | 839 | 819 | 163.6 |
| B | 4 | 81 | 121815 | 739.44 | 839 | 819 | 163.6 |
| C | 13 | 61 | 7012 | 33.02 | 807 | 811 | 187.8 |
| C | 14 | 67 | 3518 | 14.41 | 807 | 811 | 187.8 |
| C | 2 | 53 | 3224 | 12.85 | 807 | 811 | 187.8 |
| D | 1 | 20 | 414516 | 2117.12 | 810 | 784 | 195.4 |
| D | 13 | 239 | 123541 | 628.16 | 810 | 784 | 195.4 |
| D | 13 | 223 | 31133 | 155.3 | 810 | 784 | 195.4 |
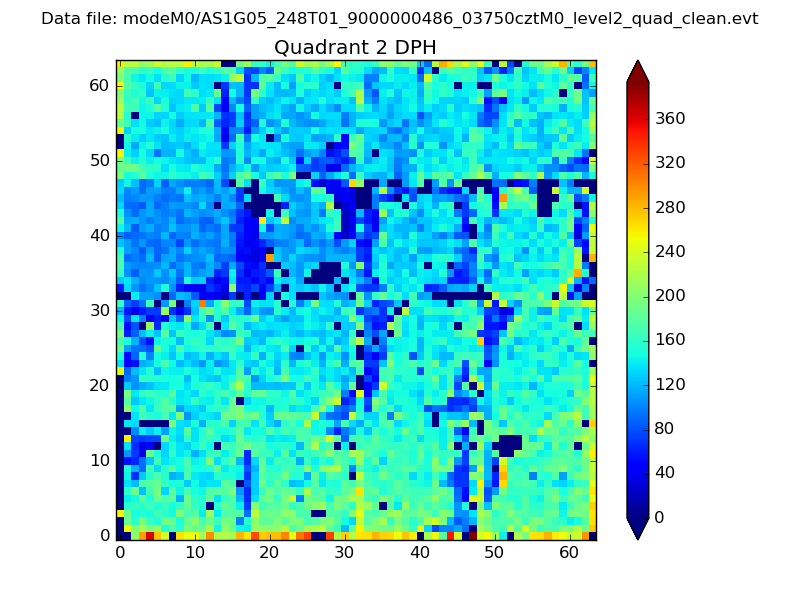
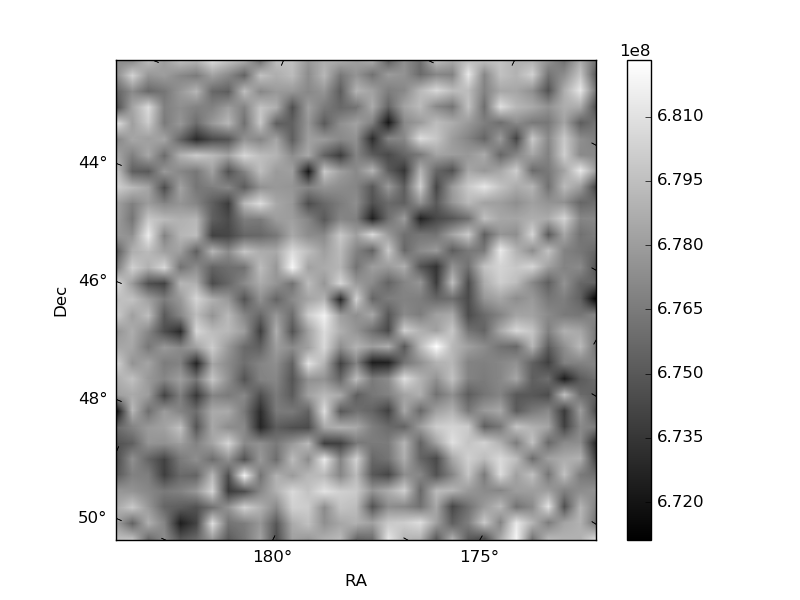
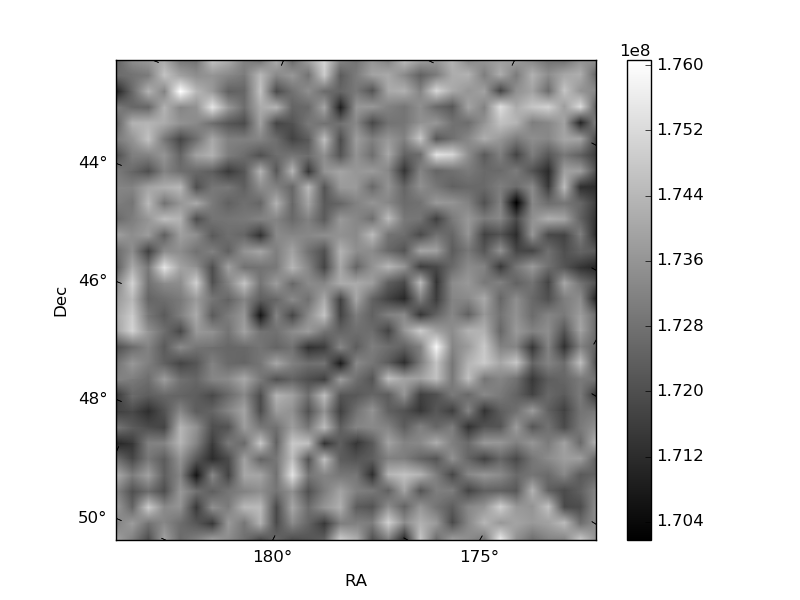
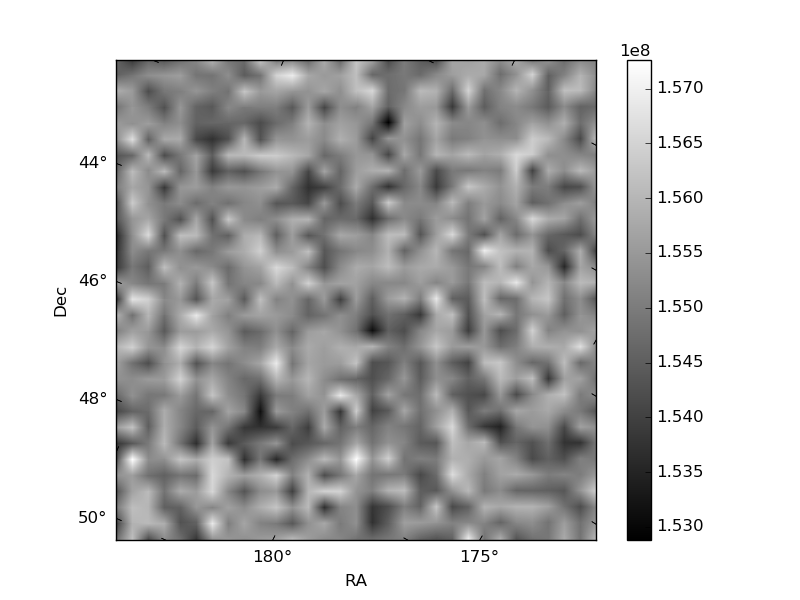
Histogram calculated using DETX and DETY for each event in the final _common_clean file
| Quadrant A | 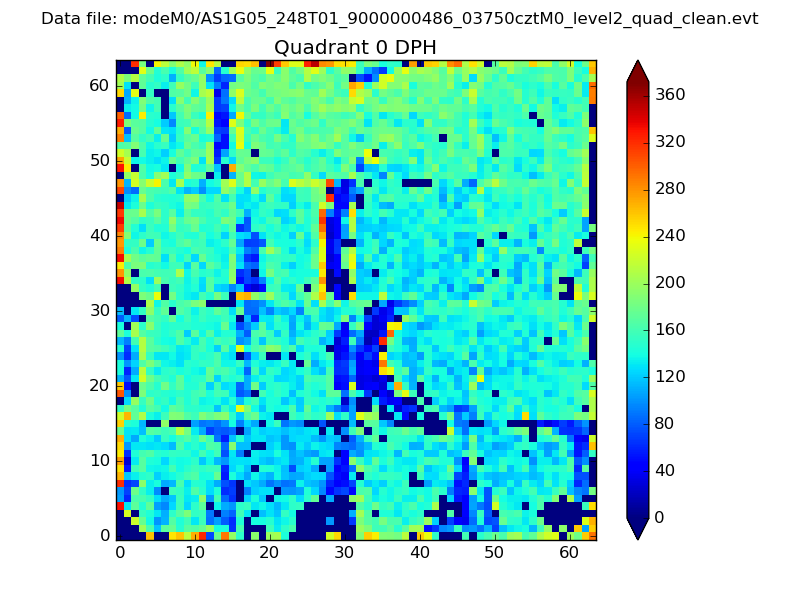 |
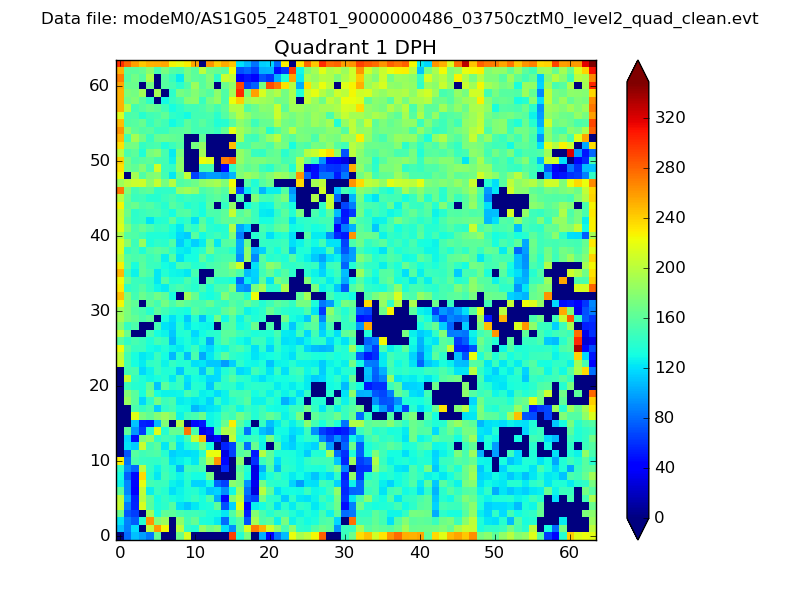 |
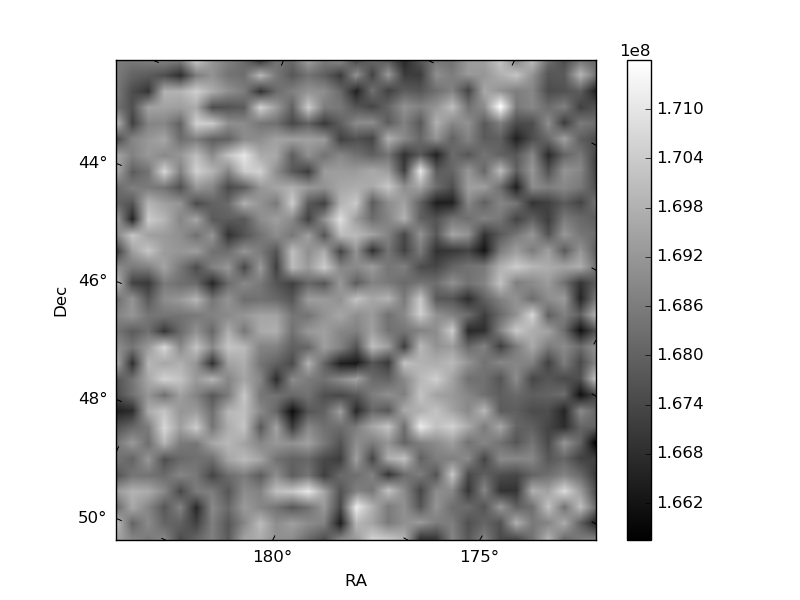
Quadrant B |
|---|---|---|---|
| Quadrant D | 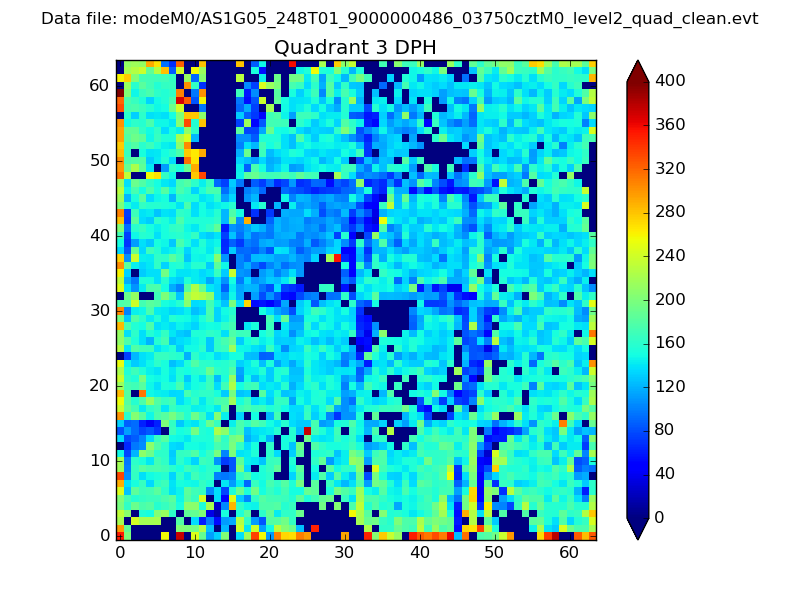 |
 |
Quadrant C |
| Plot type | Count rate plots | Images |
|---|---|---|
| Comparison with Poisson distribution Blue bars denote a histogram of data divided into 1 sec bins. Red curve is a Poisson curve with rate = median count rate of data. |
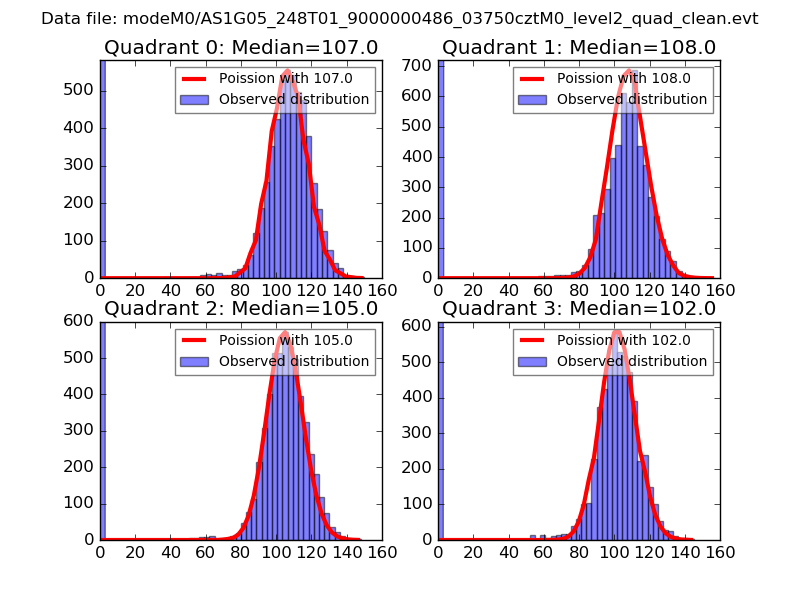 |
 |
| Quadrant-wise count rates Data is divided into 100 sec bins |
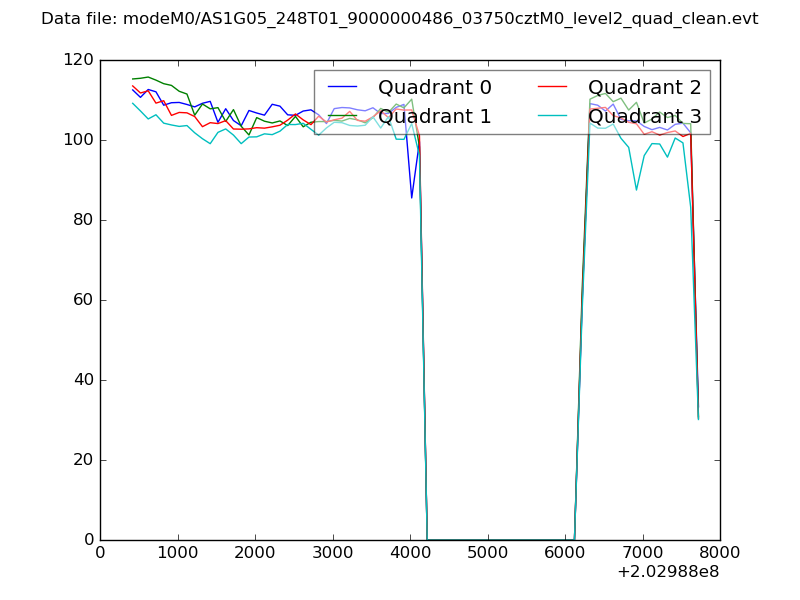 |
|
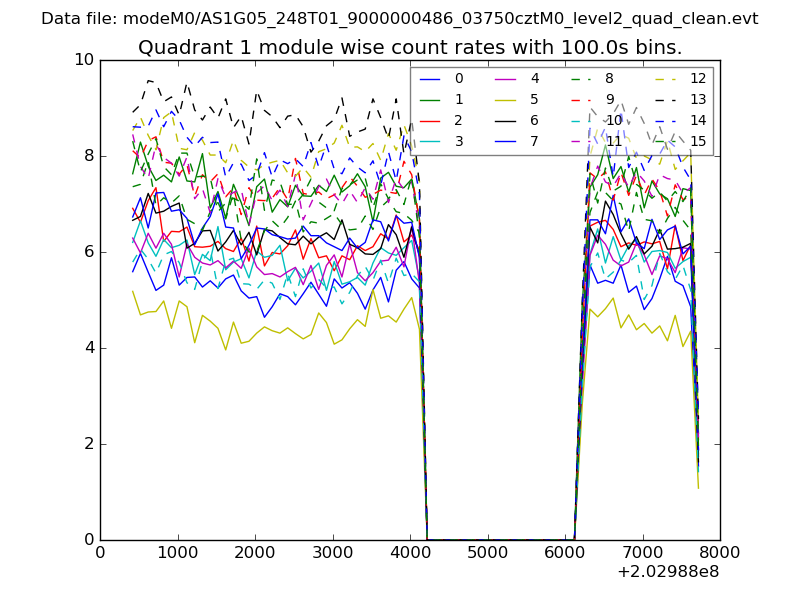
| Module-wise count rates for Quadrant A Data is divided into 100 sec bins |
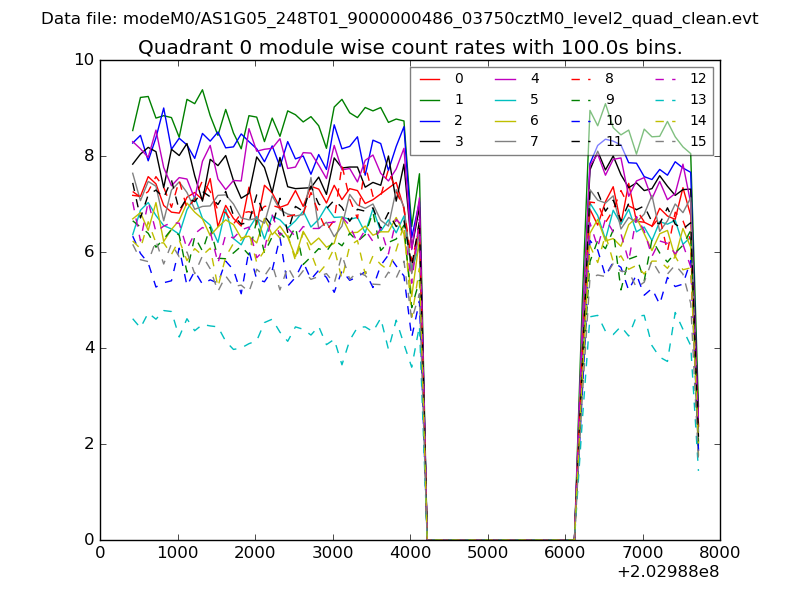 |
 |
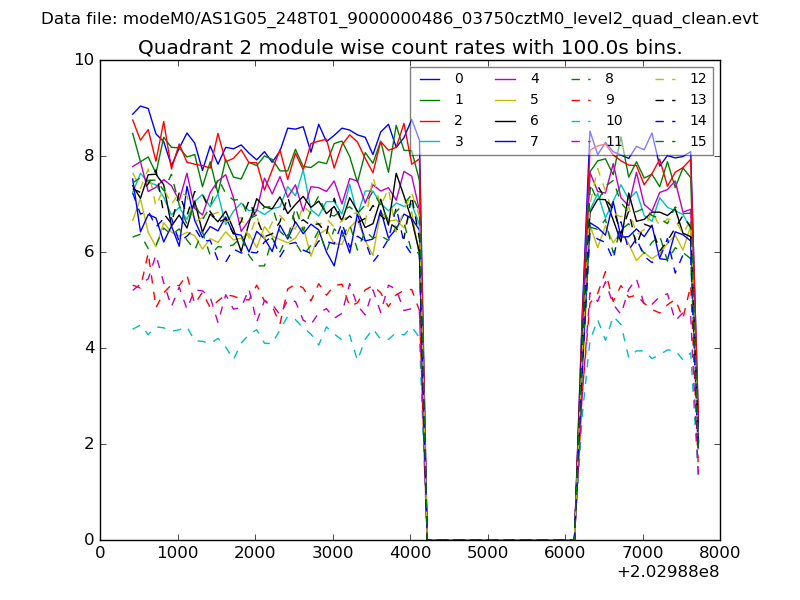
| Module-wise count rates for Quadrant B Data is divided into 100 sec bins |
 |
 |
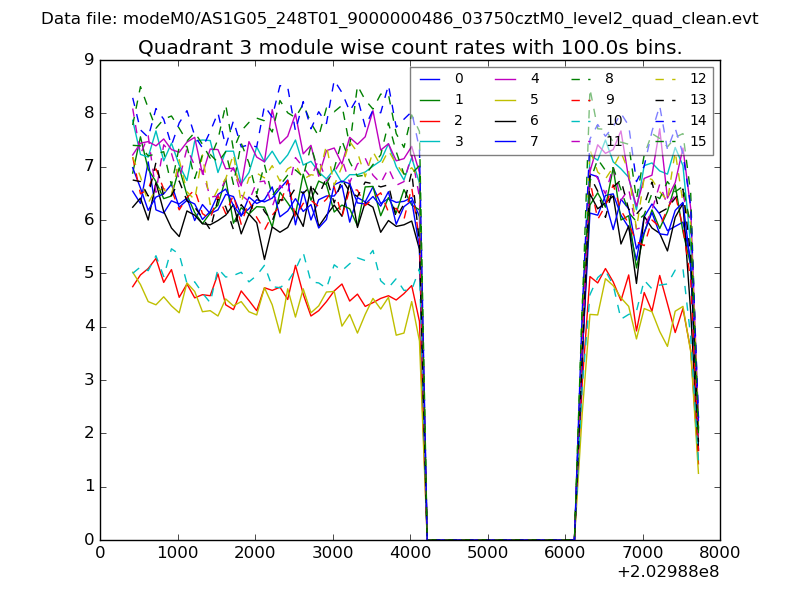
| Module-wise count rates for Quadrant C Data is divided into 100 sec bins |
 |
 |
| Module-wise count rates for Quadrant D Data is divided into 100 sec bins |
 |
 |
| Parameter | Plot |
|---|---|
| CZT HV Monitor | 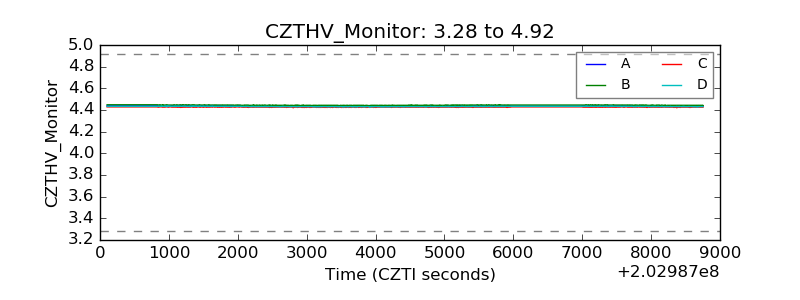 |
| D_VDD | 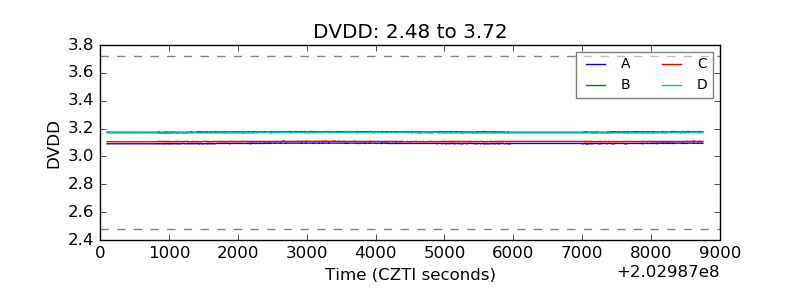 |
| Temperature 1 | 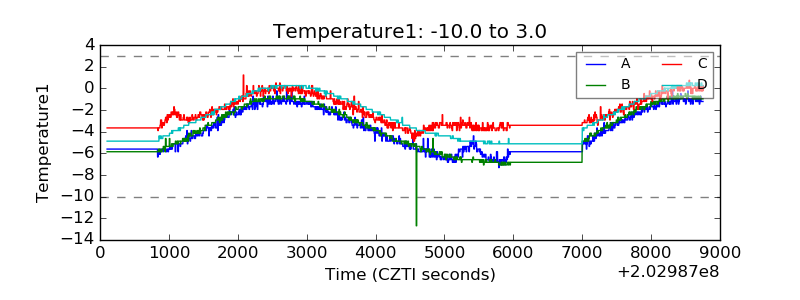 |
| Veto HV Monitor | 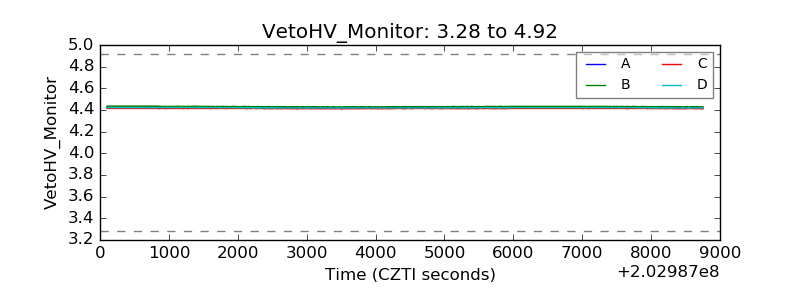 |
| Veto LLD | 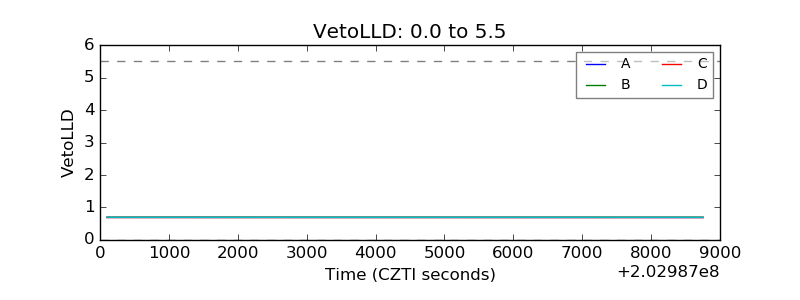 |
| Alpha Counter | 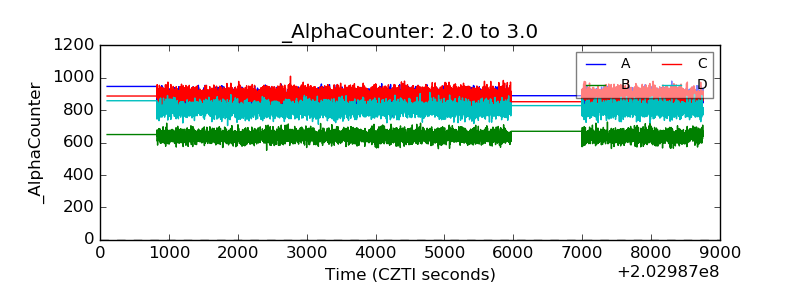 |
| _CPM_Rate | 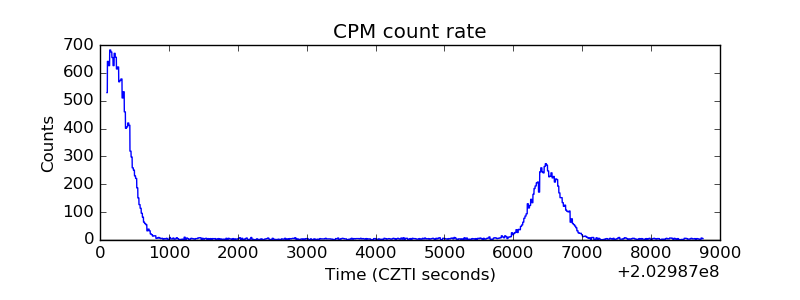 |
| CZT Counter | 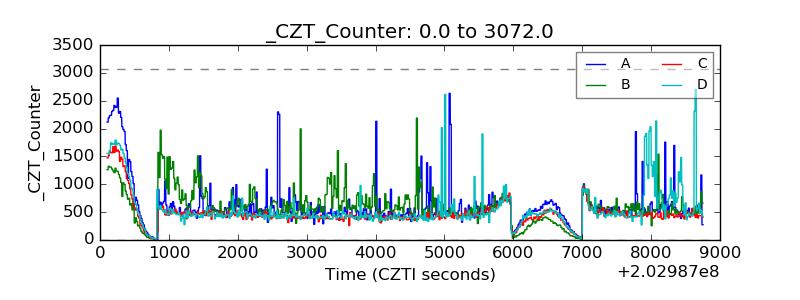 |
| +2.5 Volts monitor |  |
| +5 Volts monitor |  |
| Veto Counter | 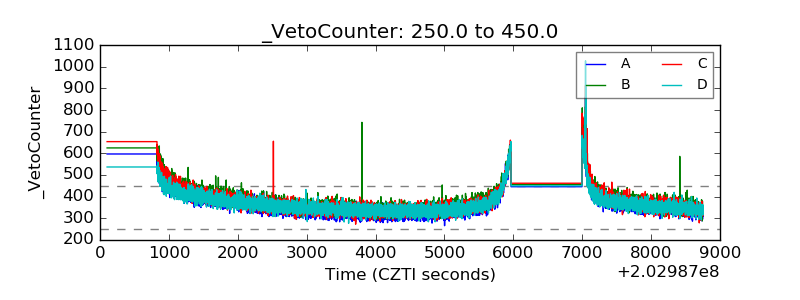 |