| Param | Original file | Final file |
|---|---|---|
| Filename | modeM0/AS1G05_248T01_9000000486_03751cztM0_level2.evt | modeM0/AS1G05_248T01_9000000486_03751cztM0_level2_quad_clean.evt |
| Size (bytes) | 531,959,040 | 84,971,520 |
| Size | 507.3 MB | 81.0 MB |
| Events in quadrant A | 5,125,103 | 532,829 |
| Events in quadrant B | 3,836,602 | 537,921 |
| Events in quadrant C | 2,903,396 | 530,189 |
| Events in quadrant D | 3,796,975 | 511,647 |
| Mode SS | |||
|---|---|---|---|
| Quadrant | BADHDUFLAG | Total packets | Discarded packets |
| A | 0 | 134 | 0 |
| B | 0 | 134 | 0 |
| C | 0 | 134 | 0 |
| D | 0 | 134 | 0 |
| Mode M9 | |||
|---|---|---|---|
| Quadrant | BADHDUFLAG | Total packets | Discarded packets |
| A | 0 | 8 | 0 |
| B | 0 | 8 | 0 |
| C | 0 | 8 | 0 |
| D | 0 | 8 | 0 |
| Mode M0 | |||
|---|---|---|---|
| Quadrant | BADHDUFLAG | Total packets | Discarded packets |
| A | 0 | 19512 | 2 |
| B | 0 | 15687 | 1 |
| C | 0 | 13438 | 1 |
| D | 0 | 15966 | 1 |
| Quadrant | Total seconds | Saturated seconds | Saturation percentage |
|---|---|---|---|
| A | 6603 | 770 | 11.661366% |
| B | 6603 | 119 | 1.802211% |
| C | 6603 | 60 | 0.908678% |
| D | 6603 | 176 | 2.665455% |
Noise dominated data is calculated using 1-second bins in cleaned event files. If a bin has >2000 counts, and if more than 50% of those come from <1% of pixels, then it is considered to be noise-dominated and hence unusable.
| Quadrant | # 1 sec bins | Bins with >0 counts | Bins with >2000 counts | High rate bins dominated by noise | Noise dominated (total time) | Noise dominated (detector-on time) | Marked lightcurve |
|---|---|---|---|---|---|---|---|
| A | 7433 | 6605 | 584 | 584 | 7.86% | 8.84% | 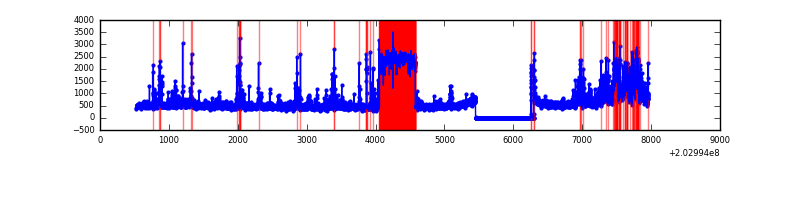 |
| B | 7433 | 6605 | 29 | 29 | 0.39% | 0.44% | 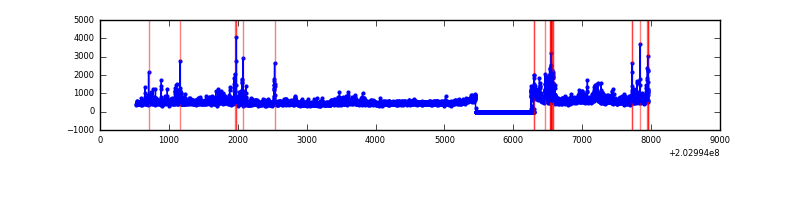 |
| C | 7433 | 6604 | 0 | 0 | 0.00% | 0.00% | 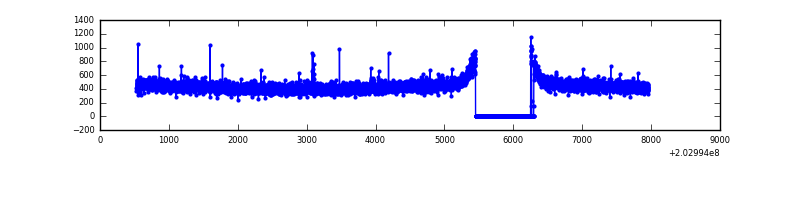 |
| D | 7433 | 6604 | 94 | 94 | 1.26% | 1.42% | 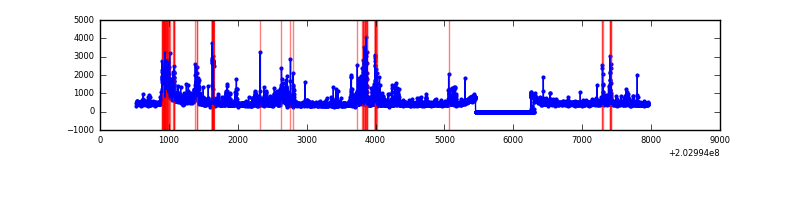 |
Top three noisy pixels from each quadrant. If the there are fewer than three noisy pixels in the level2.evt file, extra rows are filled as -1
| Pixel properties | Quadrant properties | ||||||
|---|---|---|---|---|---|---|---|
| Quadrant | DetID | PixID | Counts | Sigma | Mean | Median | Sigma |
| A | 0 | 118 | 1416460 | 9591.9 | 716 | 699 | 147.6 |
| A | 13 | 251 | 568578 | 3847.43 | 716 | 699 | 147.6 |
| A | 8 | 15 | 156891 | 1058.21 | 716 | 699 | 147.6 |
| B | 15 | 204 | 360503 | 2409.81 | 764 | 745 | 149.3 |
| B | 0 | 173 | 188274 | 1256.15 | 764 | 745 | 149.3 |
| B | 4 | 81 | 73114 | 484.76 | 764 | 745 | 149.3 |
| C | 13 | 61 | 6281 | 32.04 | 739 | 742 | 172.9 |
| C | 1 | 16 | 5242 | 26.03 | 739 | 742 | 172.9 |
| C | 12 | 4 | 4217 | 20.1 | 739 | 742 | 172.9 |
| D | 1 | 20 | 550583 | 3068.48 | 737 | 716 | 179.2 |
| D | 13 | 239 | 134208 | 744.94 | 737 | 716 | 179.2 |
| D | 13 | 249 | 93603 | 518.35 | 737 | 716 | 179.2 |
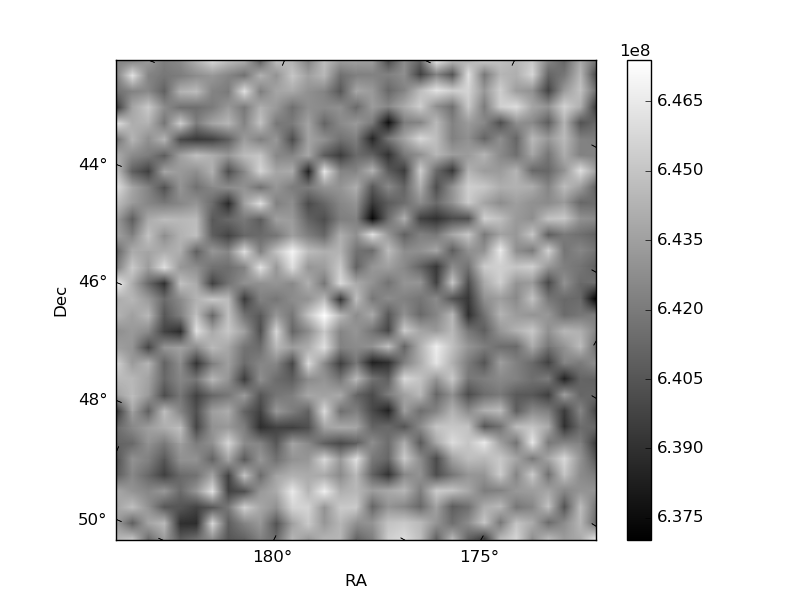
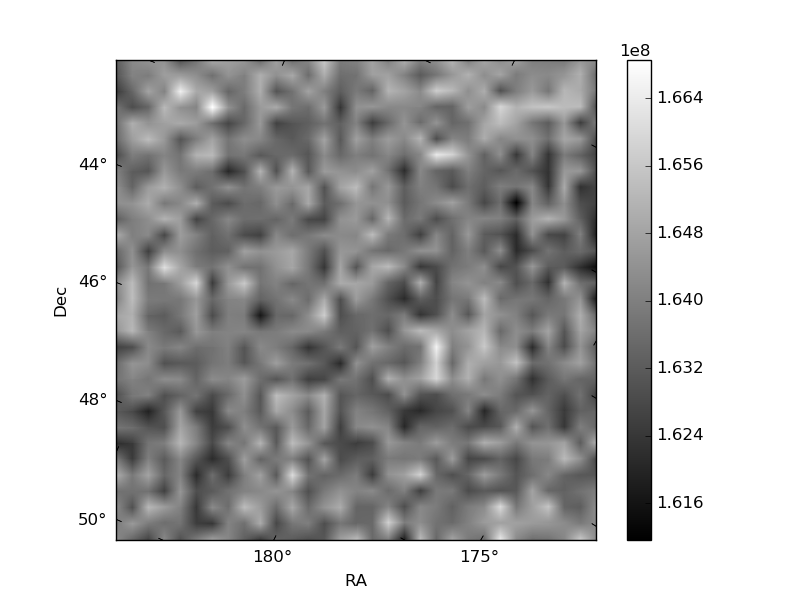
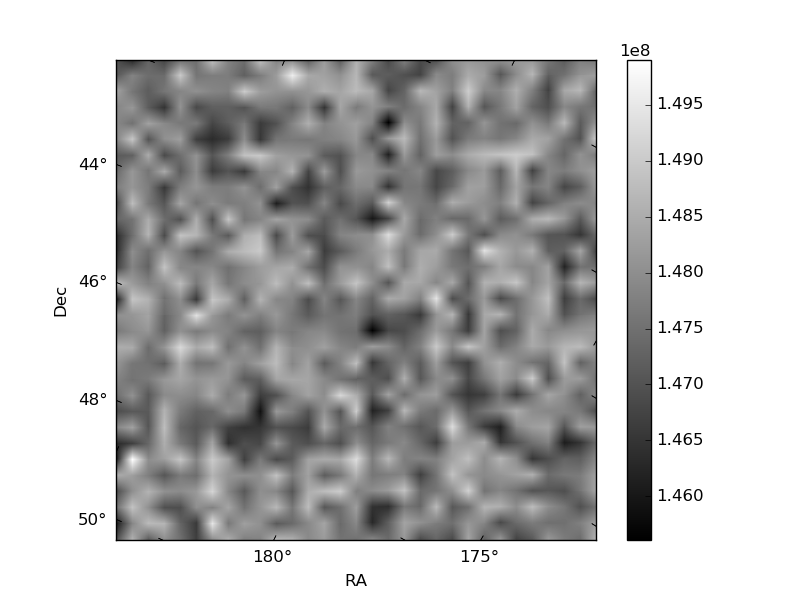
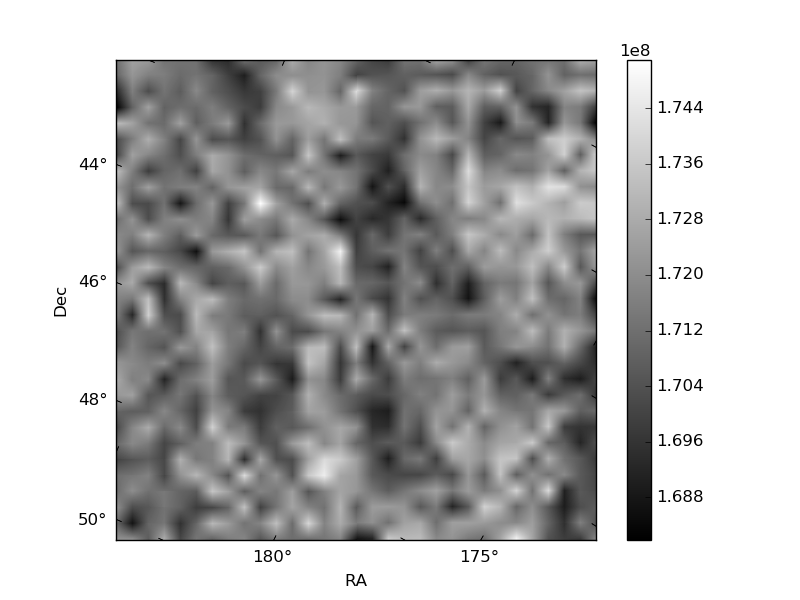
Histogram calculated using DETX and DETY for each event in the final _common_clean file
| Quadrant A | 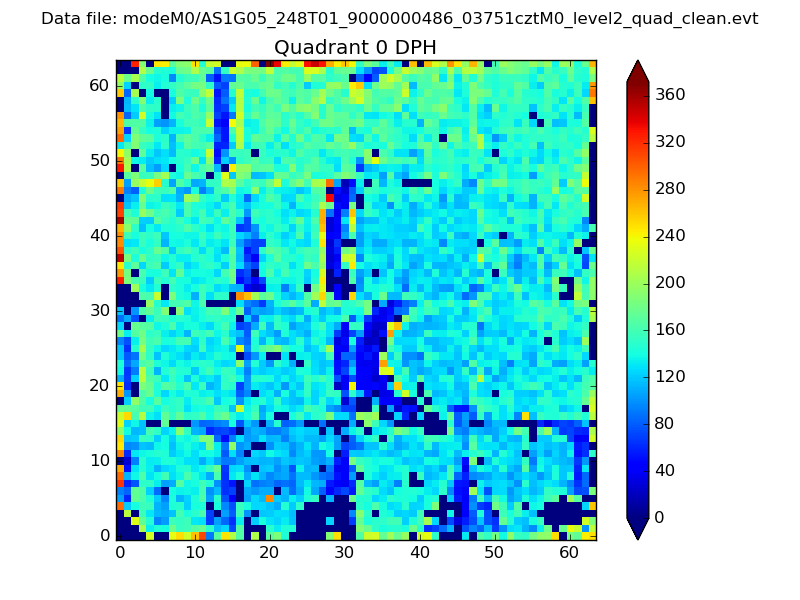 |
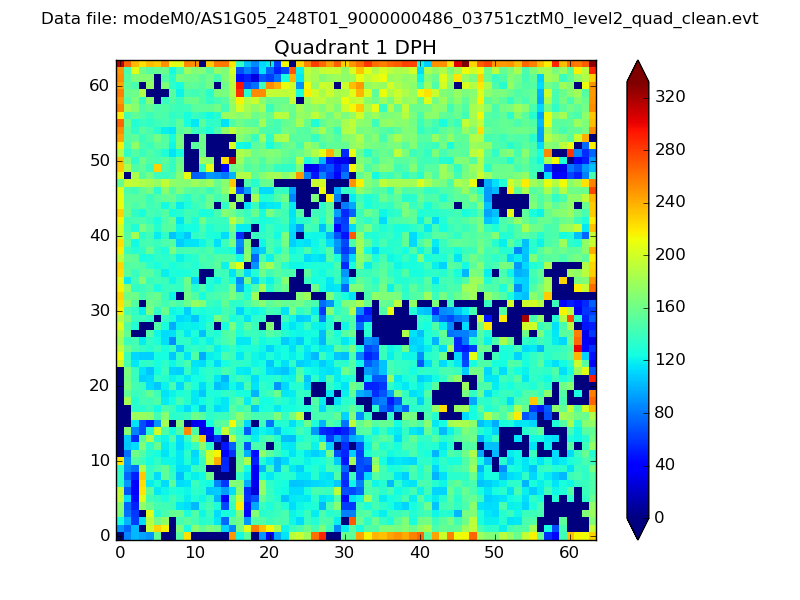 |
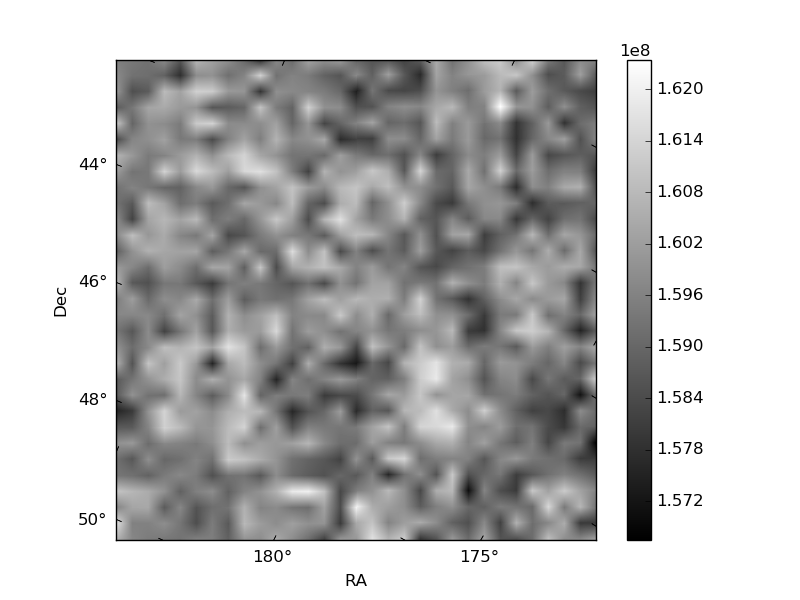
Quadrant B |
|---|---|---|---|
| Quadrant D | 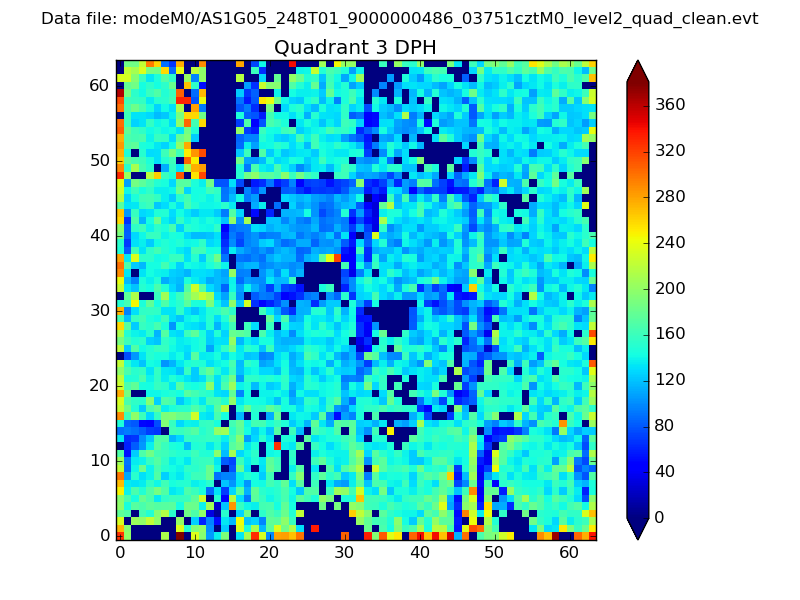 |
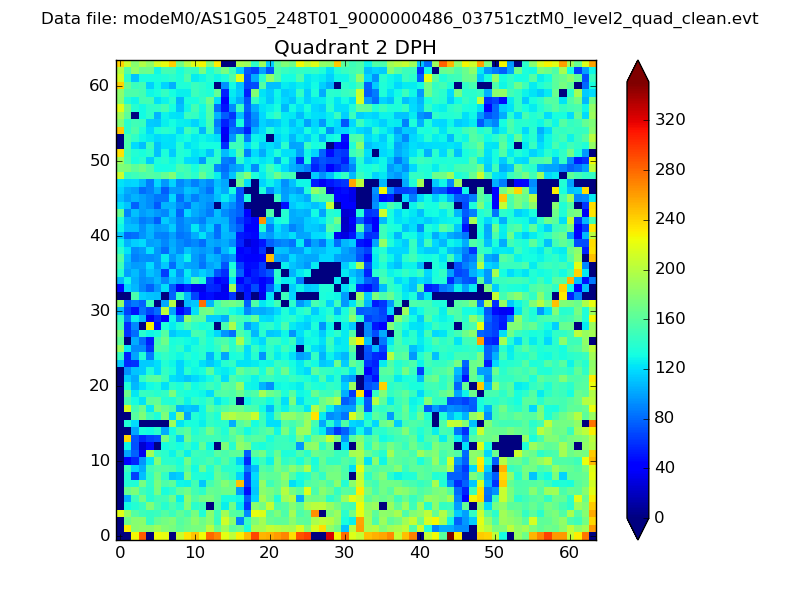 |
Quadrant C |
| Plot type | Count rate plots | Images |
|---|---|---|
| Comparison with Poisson distribution Blue bars denote a histogram of data divided into 1 sec bins. Red curve is a Poisson curve with rate = median count rate of data. |
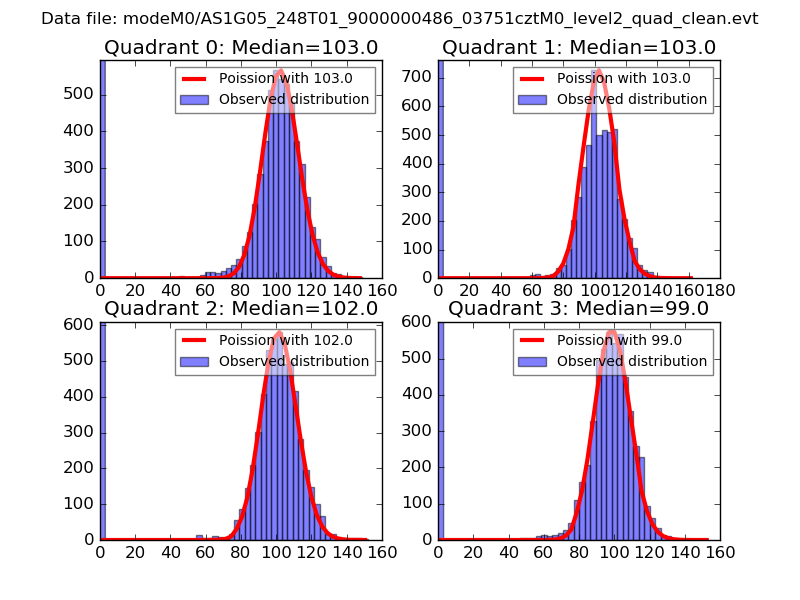 |
 |
| Quadrant-wise count rates Data is divided into 100 sec bins |
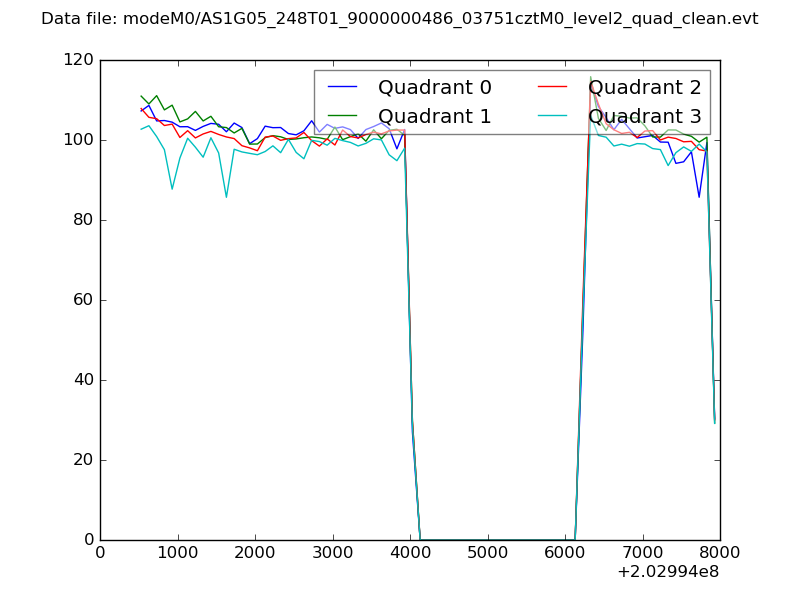 |
|
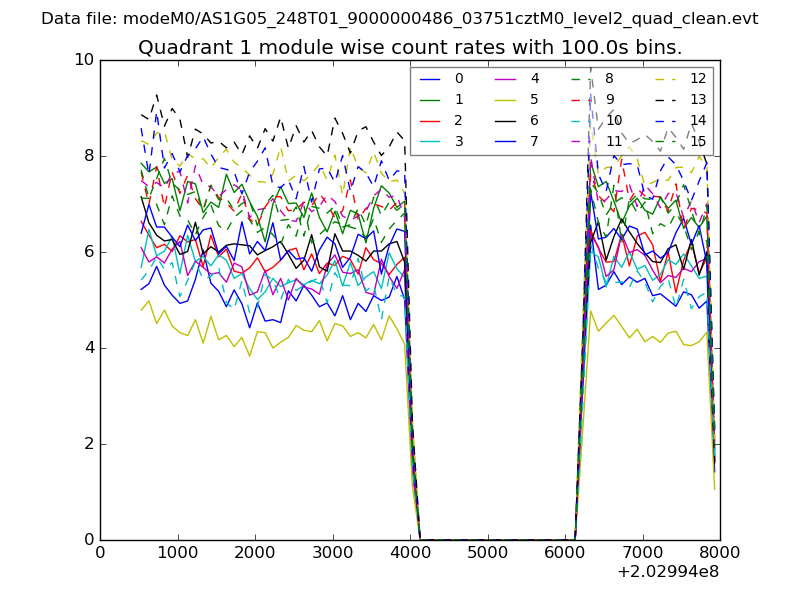
| Module-wise count rates for Quadrant A Data is divided into 100 sec bins |
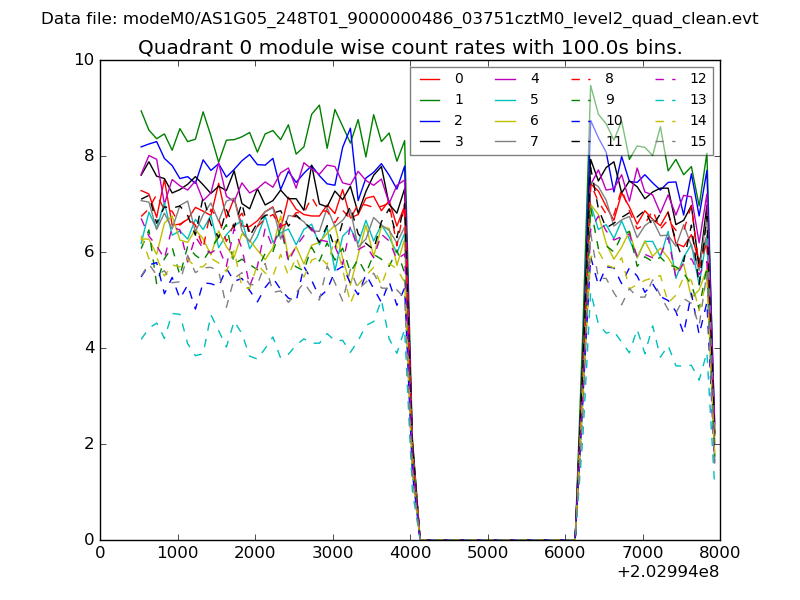 |
 |
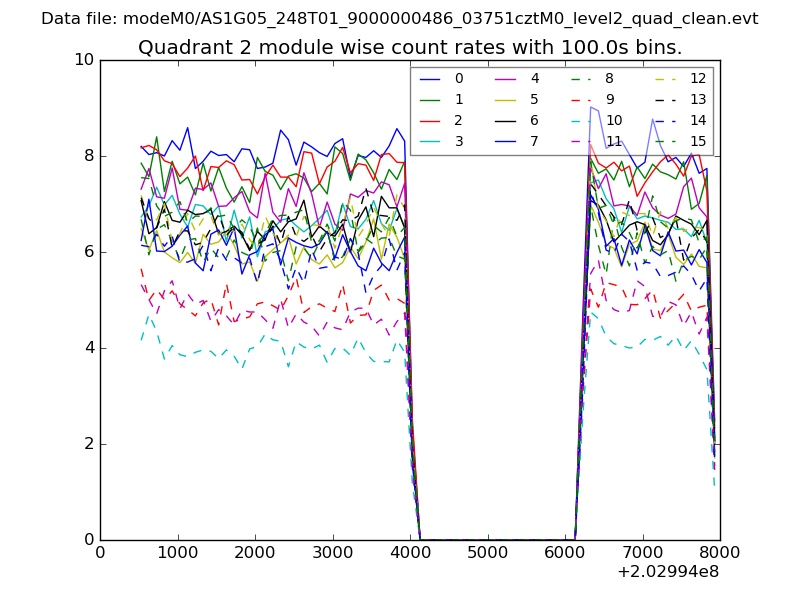
| Module-wise count rates for Quadrant B Data is divided into 100 sec bins |
 |
 |
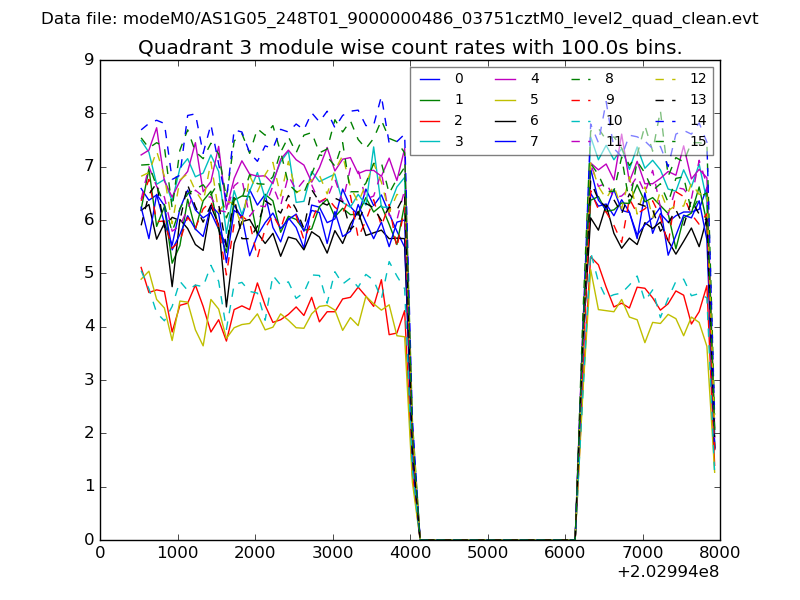
| Module-wise count rates for Quadrant C Data is divided into 100 sec bins |
 |
 |
| Module-wise count rates for Quadrant D Data is divided into 100 sec bins |
 |
 |
| Parameter | Plot |
|---|---|
| CZT HV Monitor | 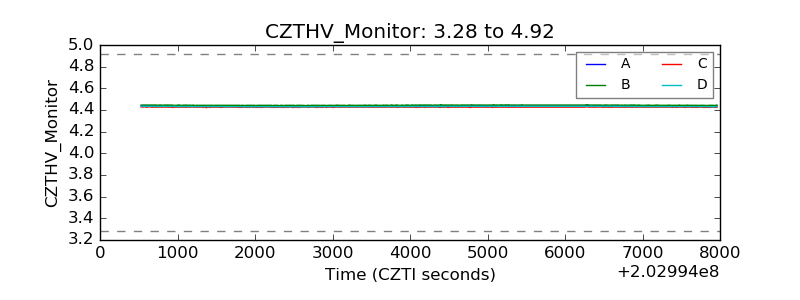 |
| D_VDD | 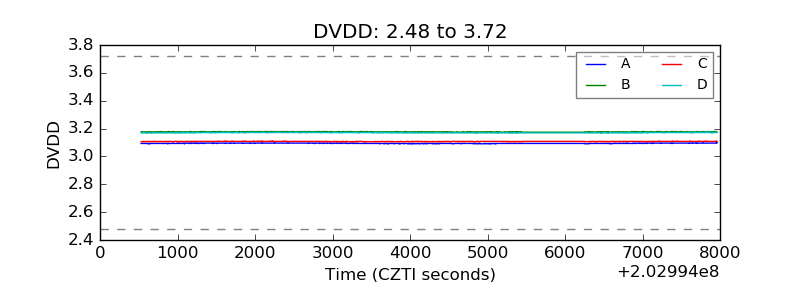 |
| Temperature 1 | 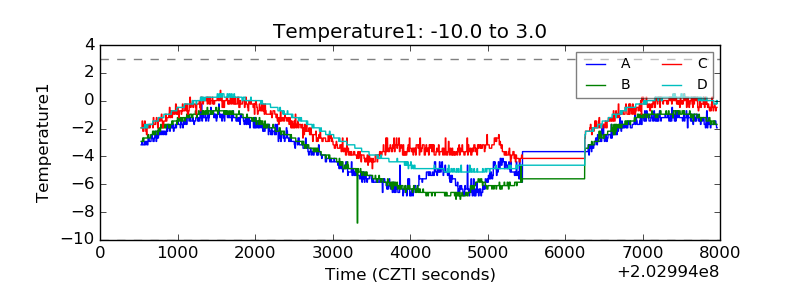 |
| Veto HV Monitor | 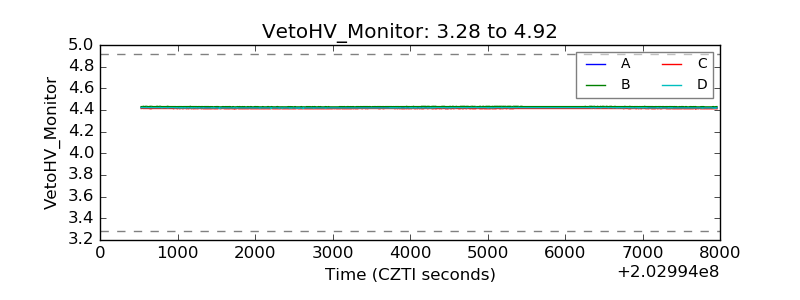 |
| Veto LLD | 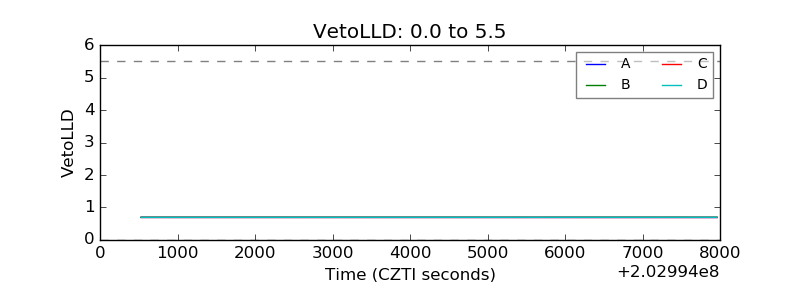 |
| Alpha Counter | 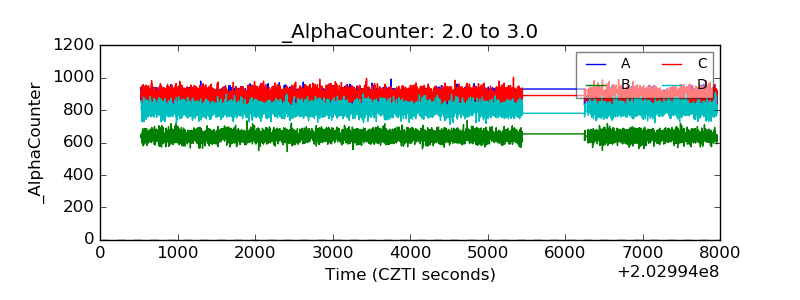 |
| _CPM_Rate | 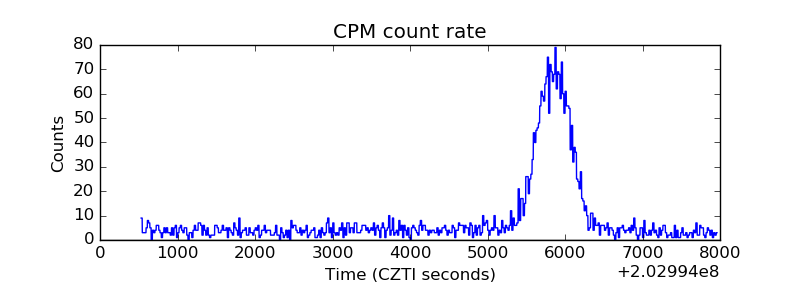 |
| CZT Counter | 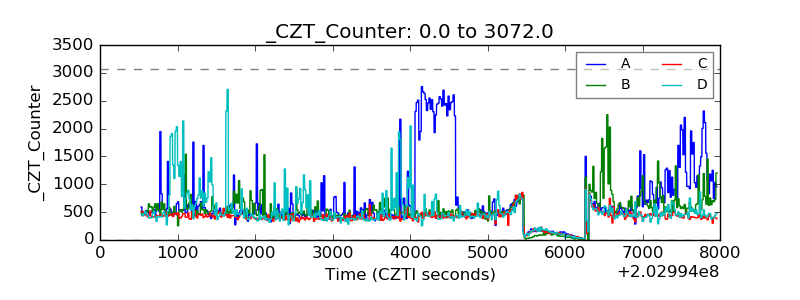 |
| +2.5 Volts monitor | 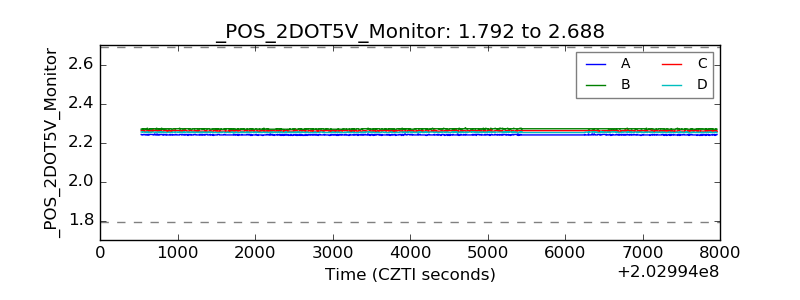 |
| +5 Volts monitor |  |
| Veto Counter | 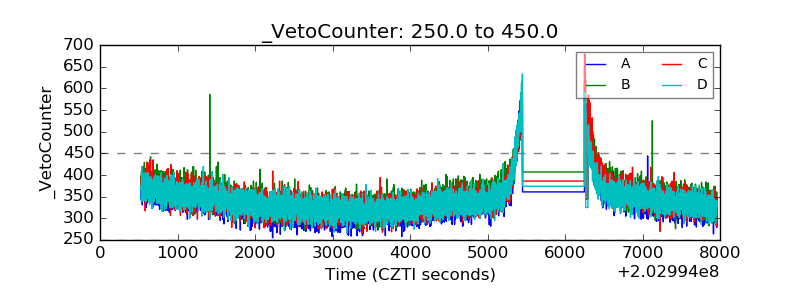 |