| Param | Original file | Final file |
|---|---|---|
| Filename | modeM0/AS1G05_248T01_9000000486_03752cztM0_level2.evt | modeM0/AS1G05_248T01_9000000486_03752cztM0_level2_quad_clean.evt |
| Size (bytes) | 498,660,480 | 72,887,040 |
| Size | 475.6 MB | 69.5 MB |
| Events in quadrant A | 4,524,979 | 437,094 |
| Events in quadrant B | 3,774,596 | 447,946 |
| Events in quadrant C | 2,866,994 | 443,037 |
| Events in quadrant D | 3,496,483 | 427,518 |
| Mode SS | |||
|---|---|---|---|
| Quadrant | BADHDUFLAG | Total packets | Discarded packets |
| A | 0 | 132 | 0 |
| B | 0 | 132 | 0 |
| C | 0 | 132 | 0 |
| D | 0 | 132 | 0 |
| Mode M9 | |||
|---|---|---|---|
| Quadrant | BADHDUFLAG | Total packets | Discarded packets |
| A | 0 | 4 | 0 |
| B | 0 | 4 | 0 |
| C | 0 | 4 | 0 |
| D | 0 | 4 | 0 |
| Mode M0 | |||
|---|---|---|---|
| Quadrant | BADHDUFLAG | Total packets | Discarded packets |
| A | 0 | 17786 | 2 |
| B | 0 | 15538 | 1 |
| C | 0 | 13318 | 1 |
| D | 0 | 15015 | 1 |
| Quadrant | Total seconds | Saturated seconds | Saturation percentage |
|---|---|---|---|
| A | 6465 | 377 | 5.831400% |
| B | 6465 | 92 | 1.423047% |
| C | 6465 | 47 | 0.726991% |
| D | 6465 | 180 | 2.784223% |
Noise dominated data is calculated using 1-second bins in cleaned event files. If a bin has >2000 counts, and if more than 50% of those come from <1% of pixels, then it is considered to be noise-dominated and hence unusable.
| Quadrant | # 1 sec bins | Bins with >0 counts | Bins with >2000 counts | High rate bins dominated by noise | Noise dominated (total time) | Noise dominated (detector-on time) | Marked lightcurve |
|---|---|---|---|---|---|---|---|
| A | 6860 | 6467 | 193 | 193 | 2.81% | 2.98% | 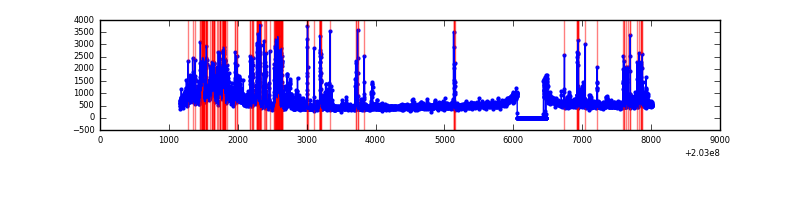 |
| B | 6860 | 6467 | 10 | 10 | 0.15% | 0.15% | 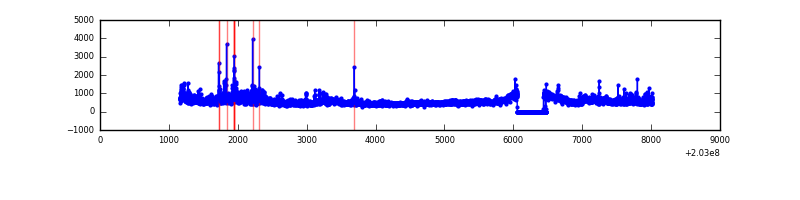 |
| C | 6860 | 6467 | 0 | 0 | 0.00% | 0.00% | 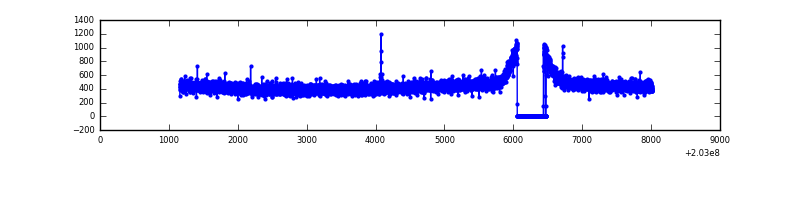 |
| D | 6860 | 6467 | 116 | 116 | 1.69% | 1.79% | 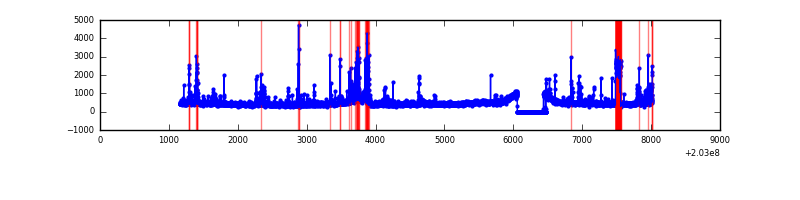 |
Top three noisy pixels from each quadrant. If the there are fewer than three noisy pixels in the level2.evt file, extra rows are filled as -1
| Pixel properties | Quadrant properties | ||||||
|---|---|---|---|---|---|---|---|
| Quadrant | DetID | PixID | Counts | Sigma | Mean | Median | Sigma |
| A | 0 | 118 | 732970 | 4813.68 | 738 | 719 | 152.1 |
| A | 13 | 251 | 589437 | 3870.12 | 738 | 719 | 152.1 |
| A | 8 | 15 | 117575 | 768.19 | 738 | 719 | 152.1 |
| B | 15 | 204 | 331093 | 2213.02 | 755 | 736 | 149.3 |
| B | 14 | 167 | 219892 | 1468.1 | 755 | 736 | 149.3 |
| B | 0 | 173 | 107019 | 711.98 | 755 | 736 | 149.3 |
| C | 13 | 61 | 6203 | 31.82 | 728 | 732 | 171.9 |
| C | 12 | 4 | 5637 | 28.53 | 728 | 732 | 171.9 |
| C | 8 | 128 | 5074 | 25.25 | 728 | 732 | 171.9 |
| D | 10 | 246 | 229473 | 1290.27 | 726 | 705 | 177.3 |
| D | 1 | 20 | 149413 | 838.73 | 726 | 705 | 177.3 |
| D | 13 | 239 | 114879 | 643.95 | 726 | 705 | 177.3 |
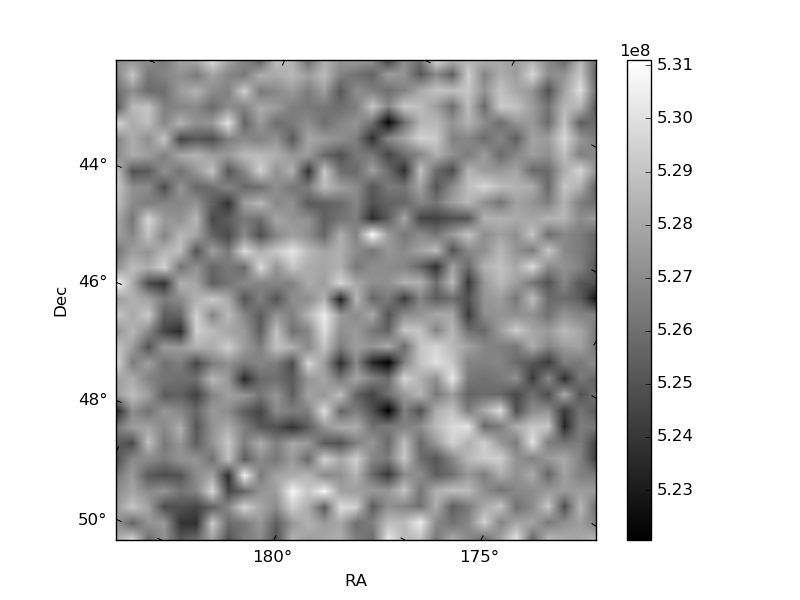
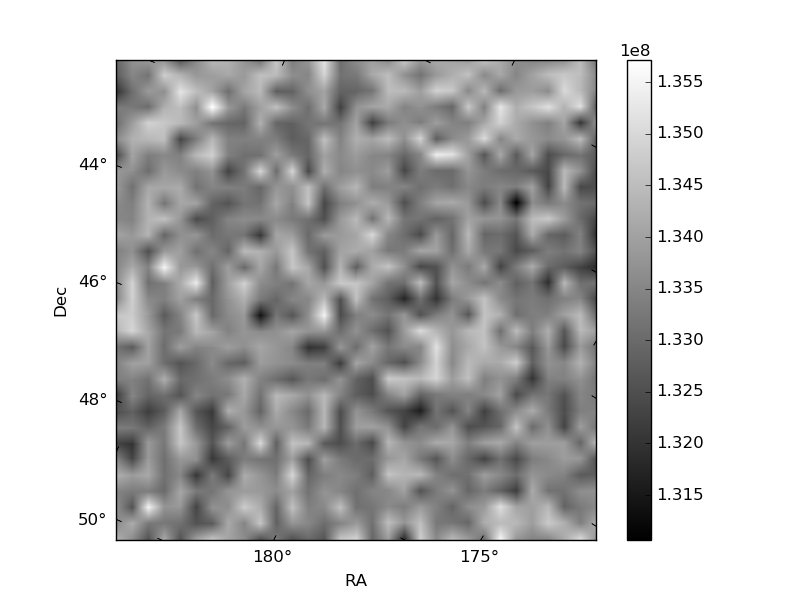
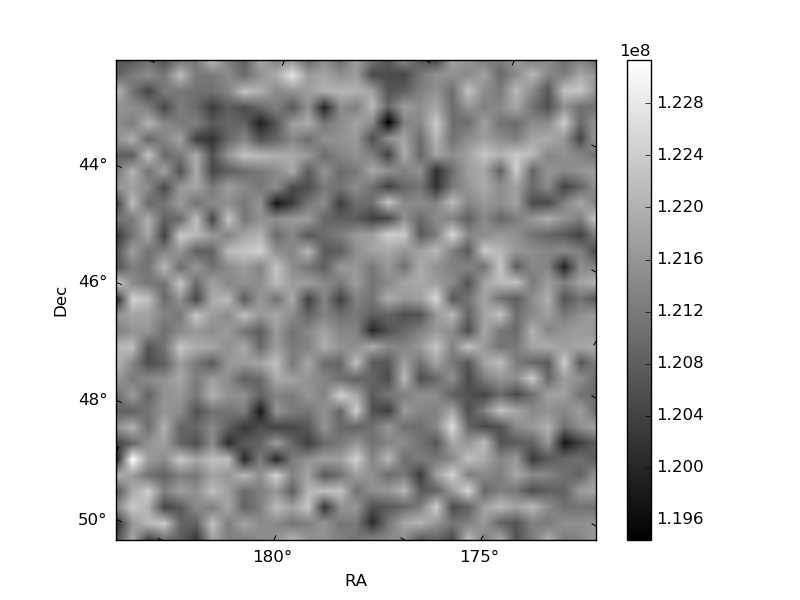
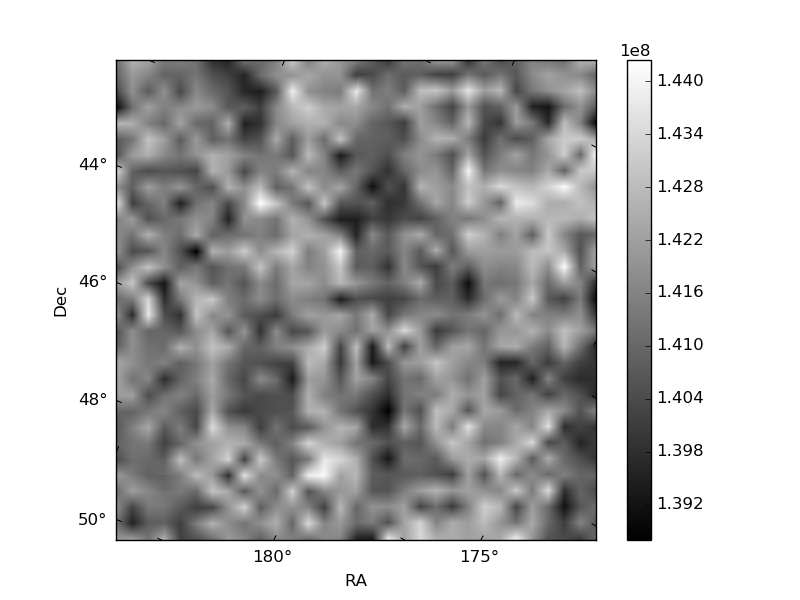
Histogram calculated using DETX and DETY for each event in the final _common_clean file
| Quadrant A | 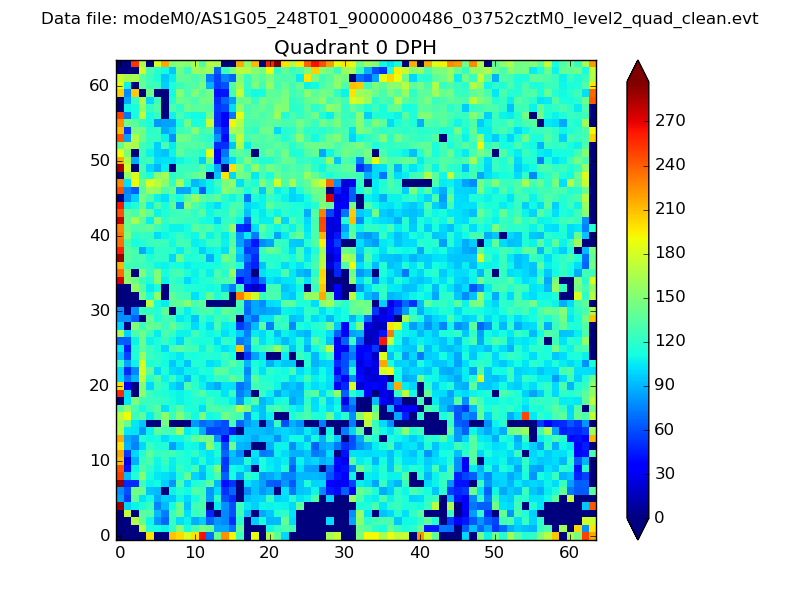 |
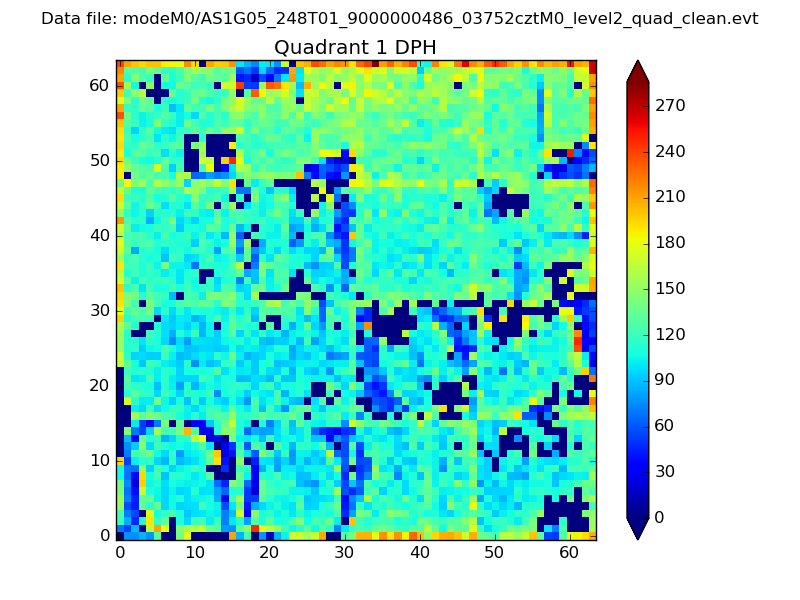 |
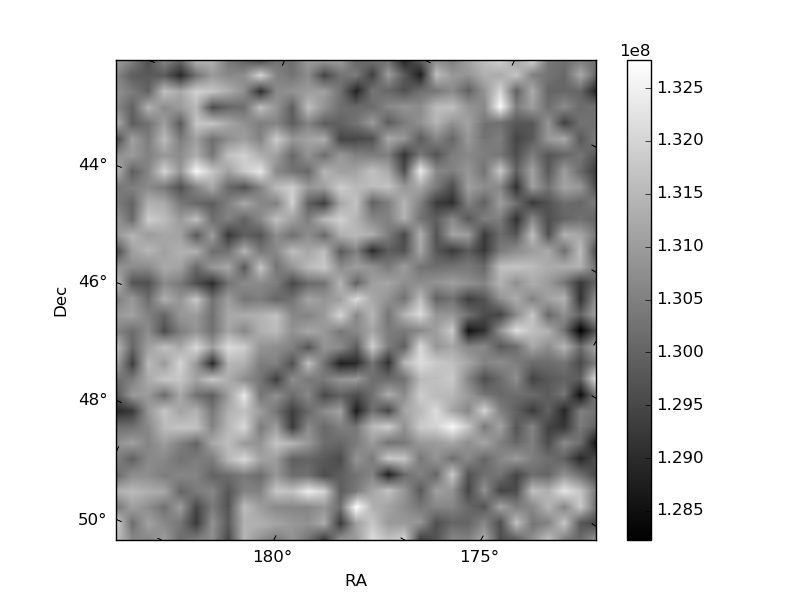
Quadrant B |
|---|---|---|---|
| Quadrant D | 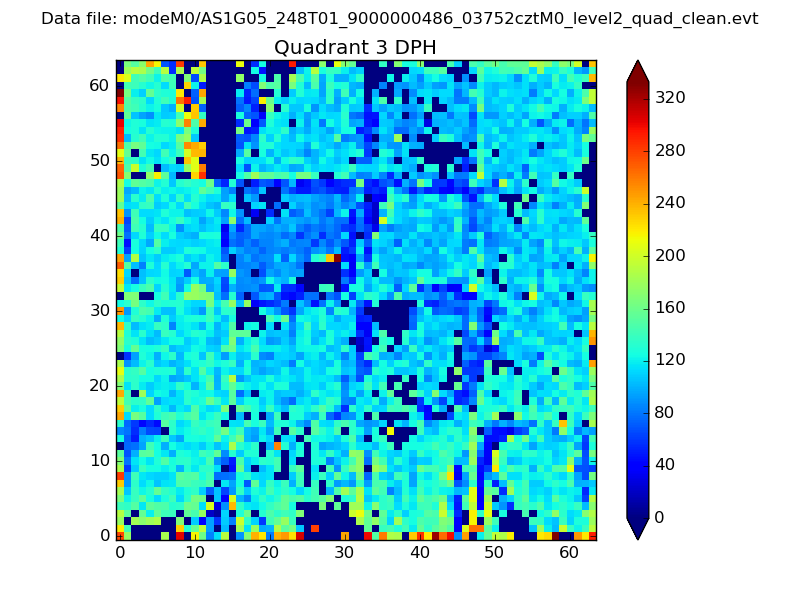 |
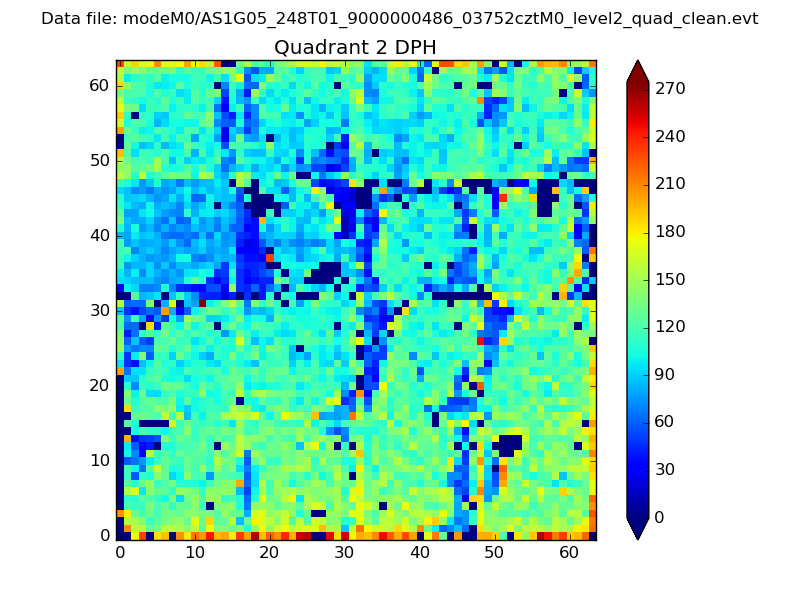 |
Quadrant C |
| Plot type | Count rate plots | Images |
|---|---|---|
| Comparison with Poisson distribution Blue bars denote a histogram of data divided into 1 sec bins. Red curve is a Poisson curve with rate = median count rate of data. |
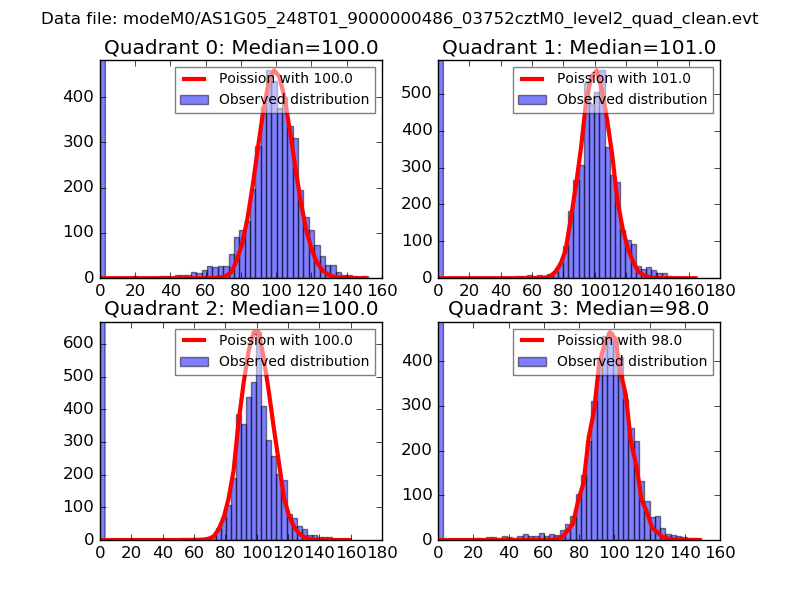 |
 |
| Quadrant-wise count rates Data is divided into 100 sec bins |
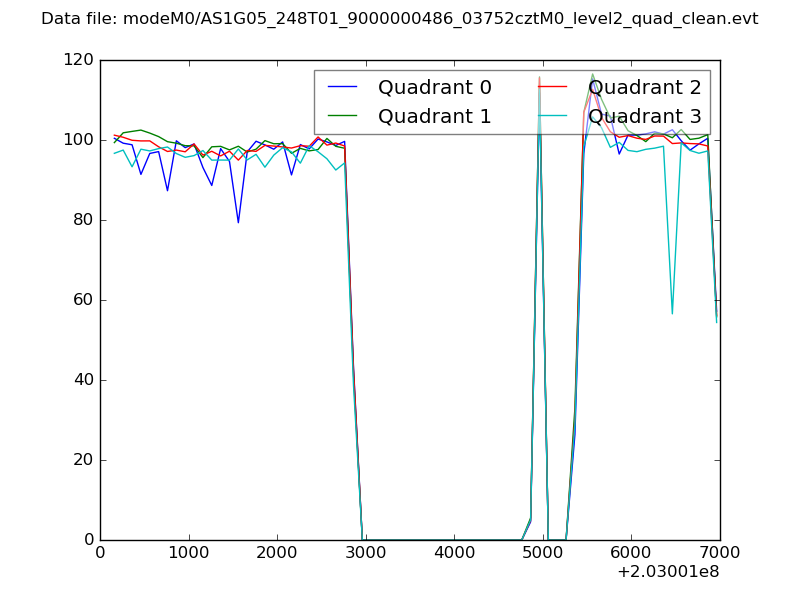 |
|
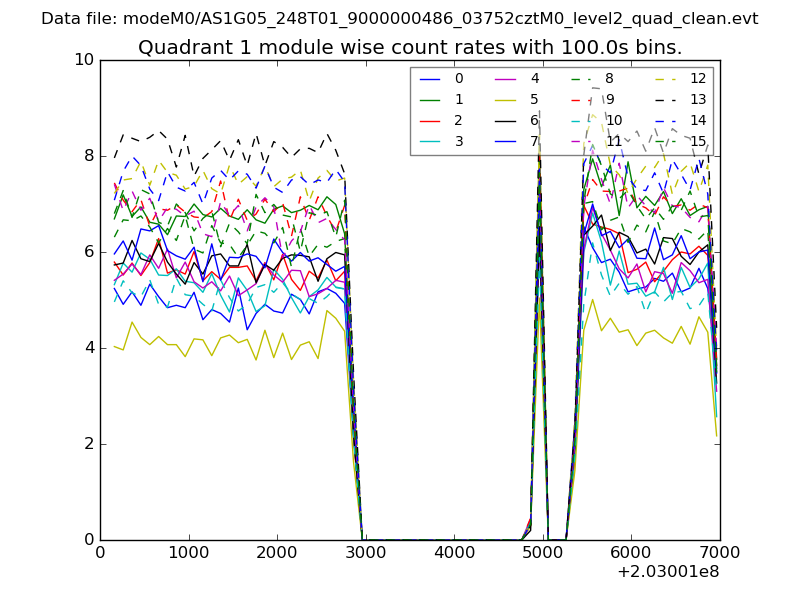
| Module-wise count rates for Quadrant A Data is divided into 100 sec bins |
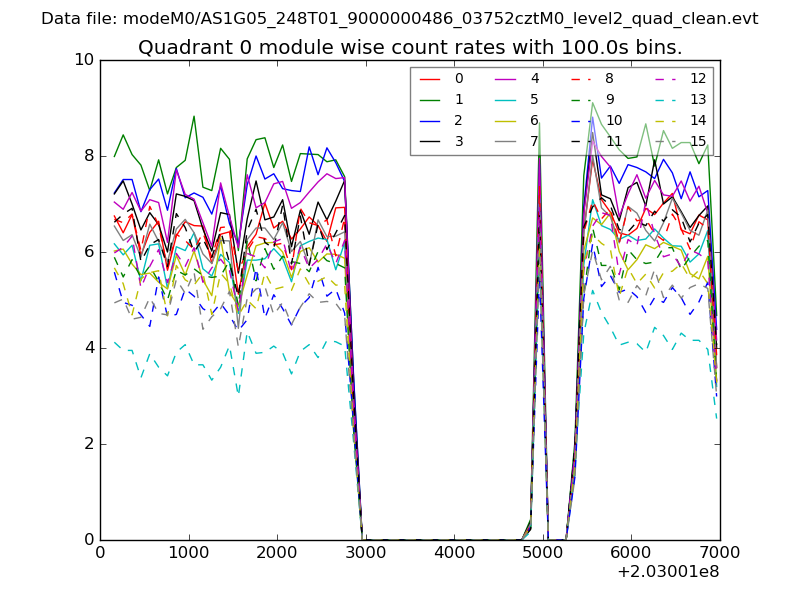 |
 |
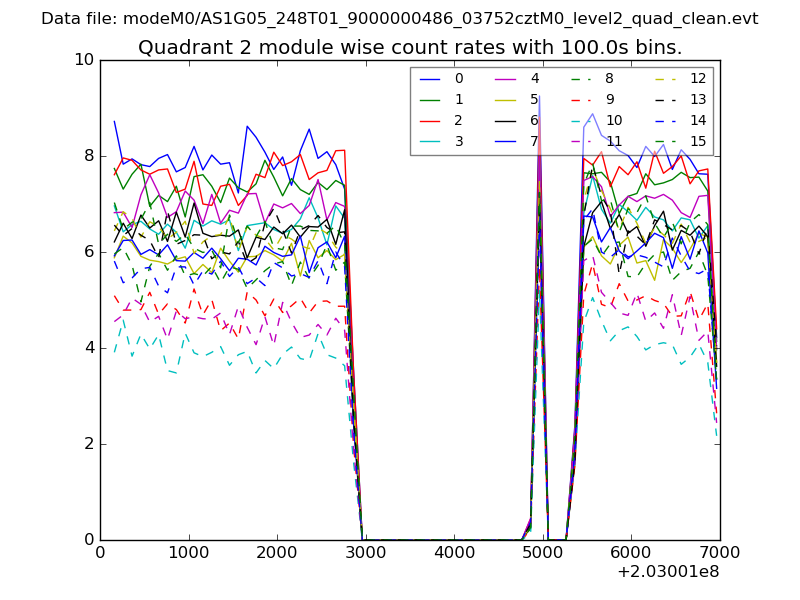
| Module-wise count rates for Quadrant B Data is divided into 100 sec bins |
 |
 |
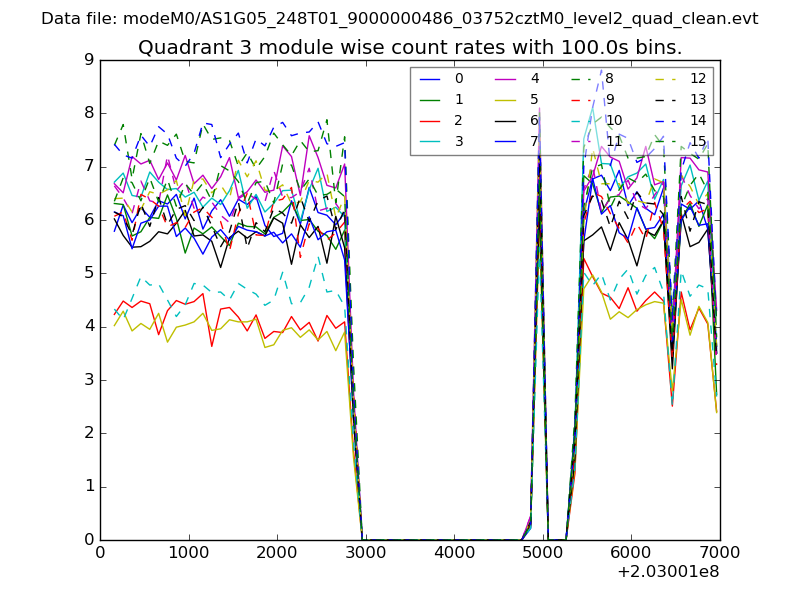
| Module-wise count rates for Quadrant C Data is divided into 100 sec bins |
 |
 |
| Module-wise count rates for Quadrant D Data is divided into 100 sec bins |
 |
 |
| Parameter | Plot |
|---|---|
| CZT HV Monitor | 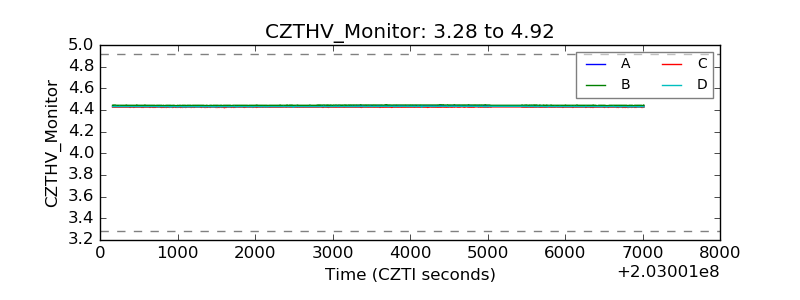 |
| D_VDD | 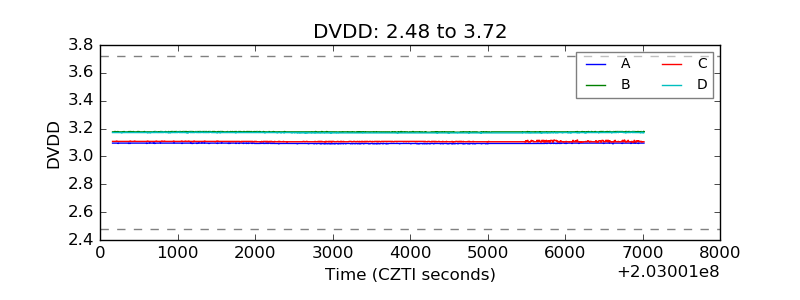 |
| Temperature 1 | 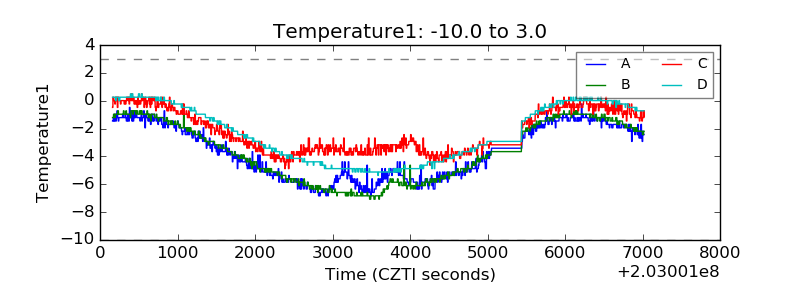 |
| Veto HV Monitor | 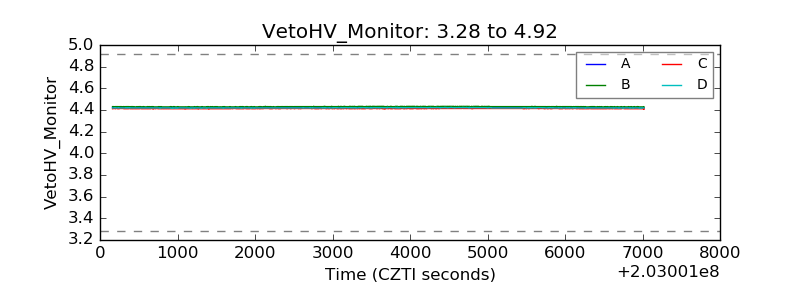 |
| Veto LLD | 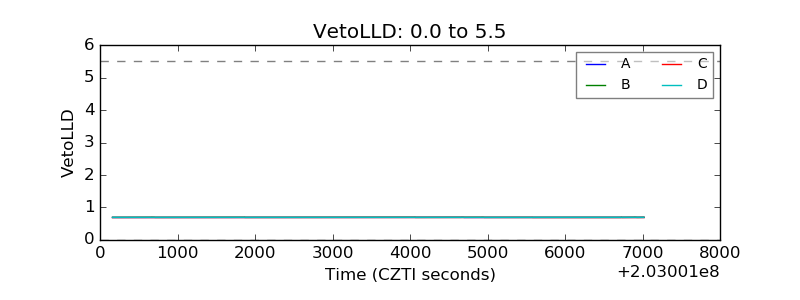 |
| Alpha Counter | 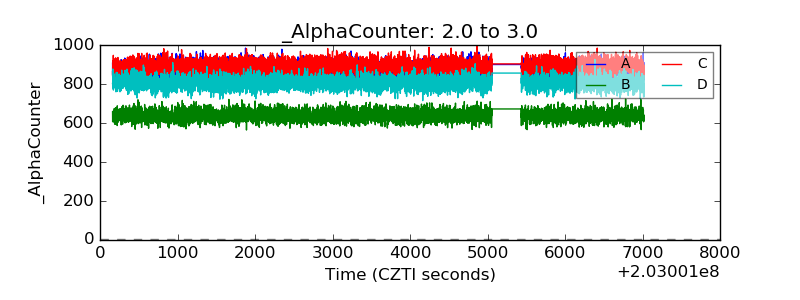 |
| _CPM_Rate | 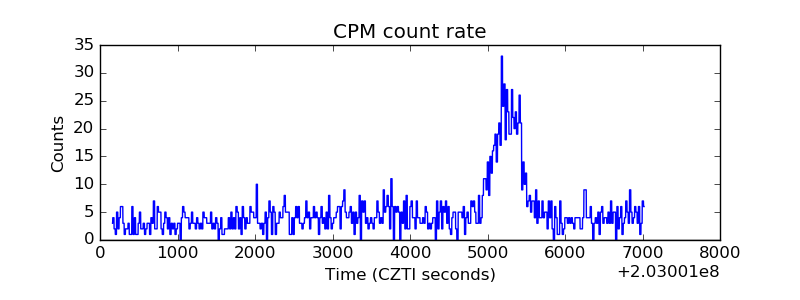 |
| CZT Counter | 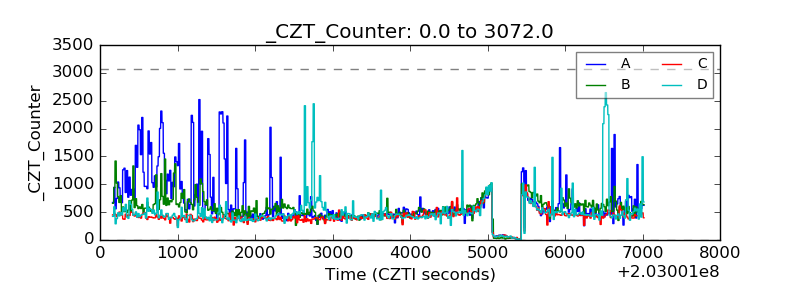 |
| +2.5 Volts monitor |  |
| +5 Volts monitor |  |
| Veto Counter | 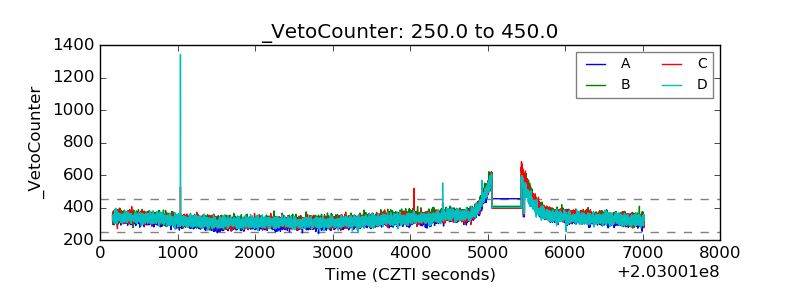 |