| Param | Original file | Final file |
|---|---|---|
| Filename | modeM0/AS1G05_248T01_9000000486_03753cztM0_level2.evt | modeM0/AS1G05_248T01_9000000486_03753cztM0_level2_quad_clean.evt |
| Size (bytes) | 720,892,800 | 85,642,560 |
| Size | 687.5 MB | 81.7 MB |
| Events in quadrant A | 4,243,837 | 546,214 |
| Events in quadrant B | 4,368,401 | 547,438 |
| Events in quadrant C | 3,473,589 | 543,385 |
| Events in quadrant D | 9,242,729 | 437,780 |
| Mode SS | |||
|---|---|---|---|
| Quadrant | BADHDUFLAG | Total packets | Discarded packets |
| A | 0 | 150 | 0 |
| B | 0 | 150 | 0 |
| C | 0 | 150 | 0 |
| D | 0 | 150 | 0 |
| Mode M0 | |||
|---|---|---|---|
| Quadrant | BADHDUFLAG | Total packets | Discarded packets |
| A | 0 | 17426 | 2 |
| B | 0 | 17943 | 1 |
| C | 0 | 15714 | 1 |
| D | 0 | 32423 | 1 |
| Quadrant | Total seconds | Saturated seconds | Saturation percentage |
|---|---|---|---|
| A | 7435 | 194 | 2.609280% |
| B | 7435 | 227 | 3.053127% |
| C | 7435 | 73 | 0.981843% |
| D | 7435 | 2318 | 31.176866% |
Noise dominated data is calculated using 1-second bins in cleaned event files. If a bin has >2000 counts, and if more than 50% of those come from <1% of pixels, then it is considered to be noise-dominated and hence unusable.
| Quadrant | # 1 sec bins | Bins with >0 counts | Bins with >2000 counts | High rate bins dominated by noise | Noise dominated (total time) | Noise dominated (detector-on time) | Marked lightcurve |
|---|---|---|---|---|---|---|---|
| A | 7470 | 7436 | 59 | 59 | 0.79% | 0.79% |  |
| B | 7470 | 7436 | 61 | 61 | 0.82% | 0.82% |  |
| C | 7470 | 7436 | 26 | 26 | 0.35% | 0.35% | 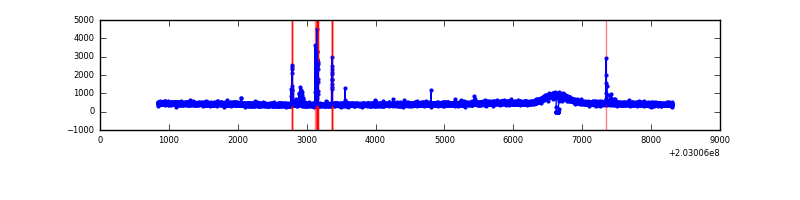 |
| D | 7470 | 7436 | 2064 | 2064 | 27.63% | 27.76% | 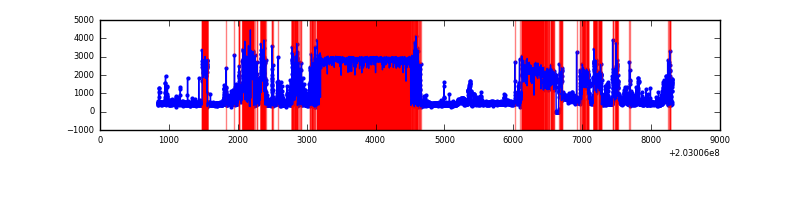 |
Top three noisy pixels from each quadrant. If the there are fewer than three noisy pixels in the level2.evt file, extra rows are filled as -1
| Pixel properties | Quadrant properties | ||||||
|---|---|---|---|---|---|---|---|
| Quadrant | DetID | PixID | Counts | Sigma | Mean | Median | Sigma |
| A | 0 | 118 | 399409 | 2219.57 | 868 | 848 | 179.6 |
| A | 13 | 251 | 118345 | 654.34 | 868 | 848 | 179.6 |
| A | 8 | 15 | 108910 | 601.79 | 868 | 848 | 179.6 |
| B | 15 | 204 | 299573 | 1724.83 | 878 | 857 | 173.2 |
| B | 4 | 81 | 206169 | 1185.5 | 878 | 857 | 173.2 |
| B | 14 | 167 | 167457 | 961.97 | 878 | 857 | 173.2 |
| C | 7 | 238 | 40428 | 197.99 | 848 | 848 | 199.9 |
| C | 1 | 16 | 40420 | 197.95 | 848 | 848 | 199.9 |
| C | 2 | 53 | 20467 | 98.14 | 848 | 848 | 199.9 |
| D | 10 | 246 | 3653849 | 21361.39 | 702 | 679 | 171.0 |
| D | 1 | 20 | 1365672 | 7981.6 | 702 | 679 | 171.0 |
| D | 8 | 112 | 1146879 | 6702.24 | 702 | 679 | 171.0 |
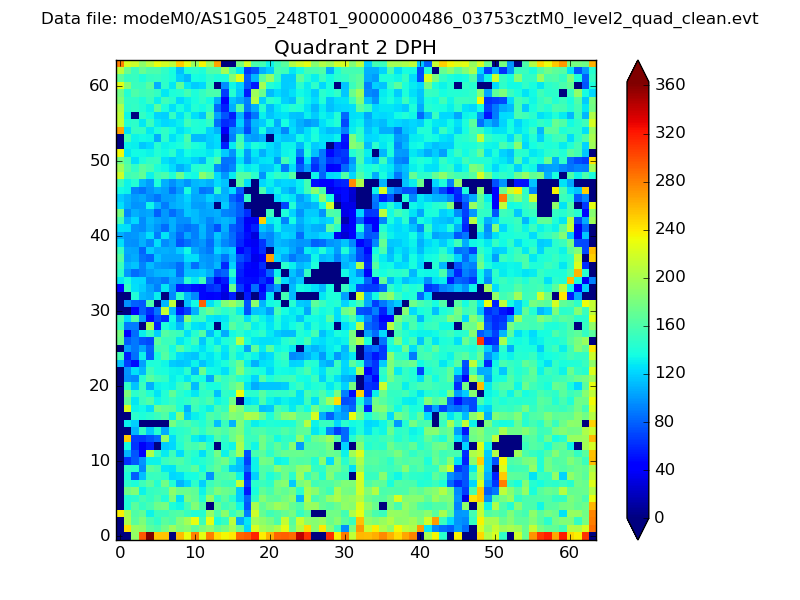
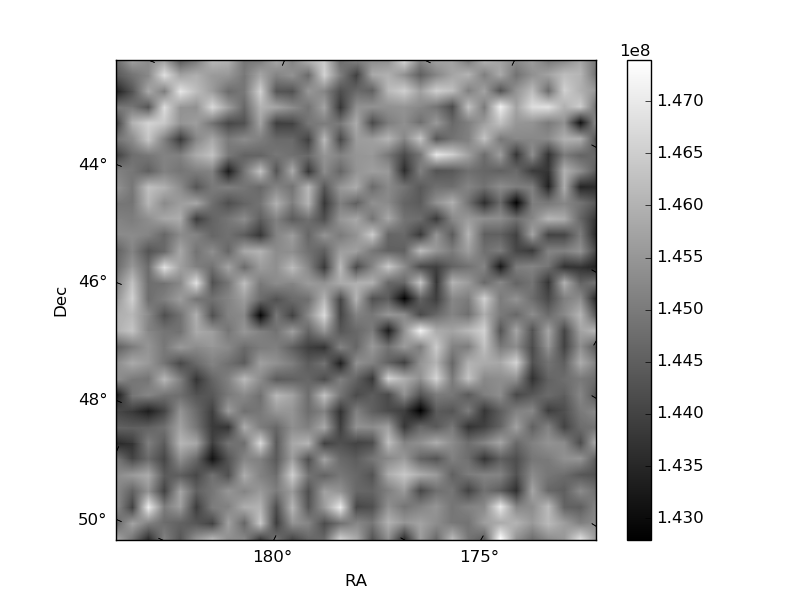
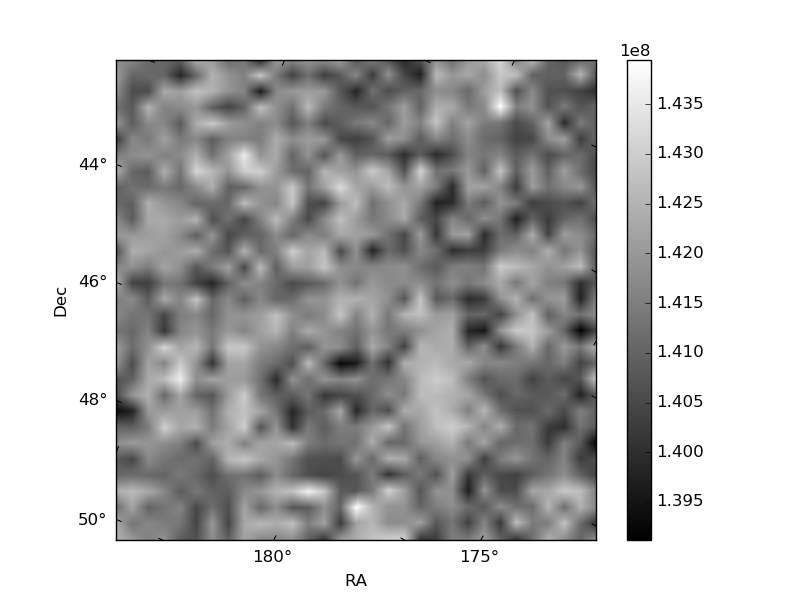
Histogram calculated using DETX and DETY for each event in the final _common_clean file
| Quadrant A | 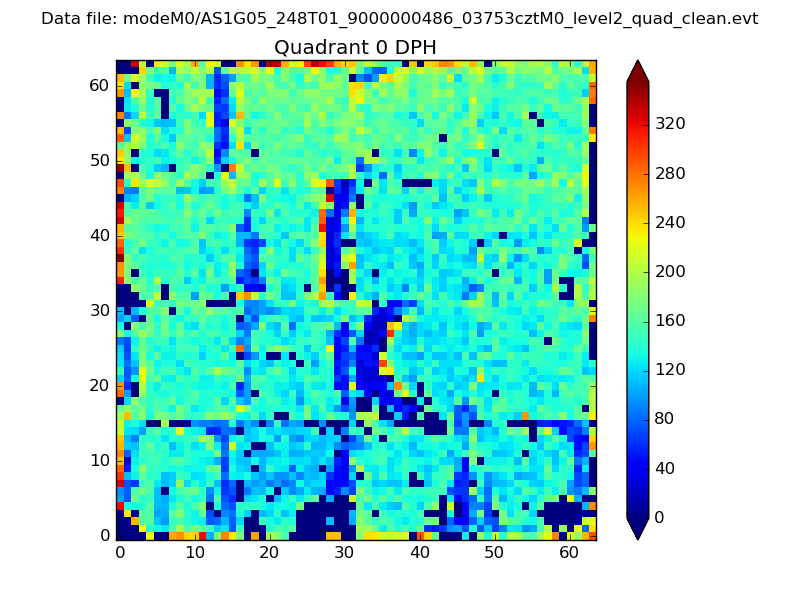 |
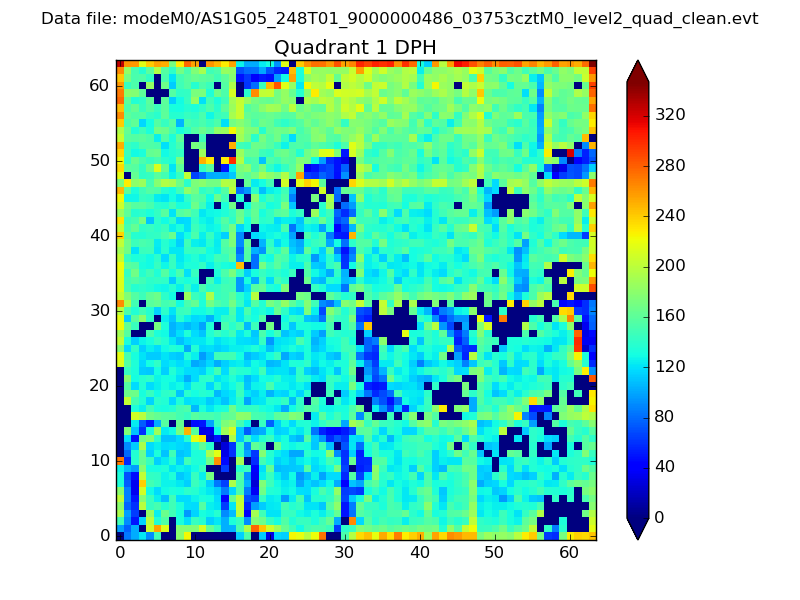 |
Quadrant B |
|---|---|---|---|
| Quadrant D | 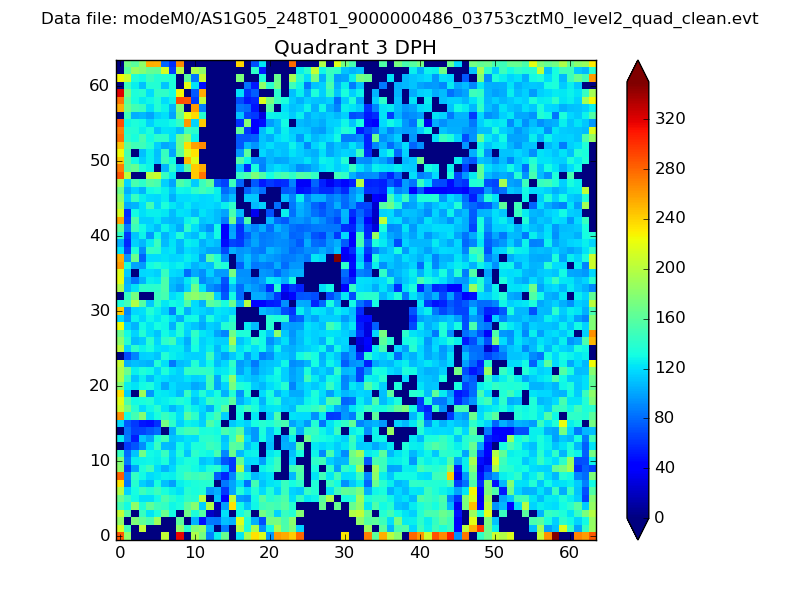 |
 |
Quadrant C |
| Plot type | Count rate plots | Images |
|---|---|---|
| Comparison with Poisson distribution Blue bars denote a histogram of data divided into 1 sec bins. Red curve is a Poisson curve with rate = median count rate of data. |
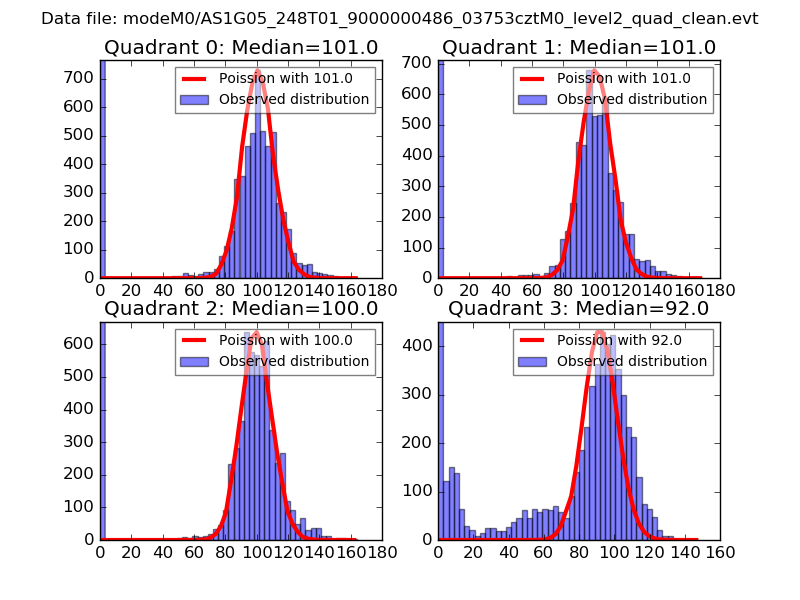 |
 |
| Quadrant-wise count rates Data is divided into 100 sec bins |
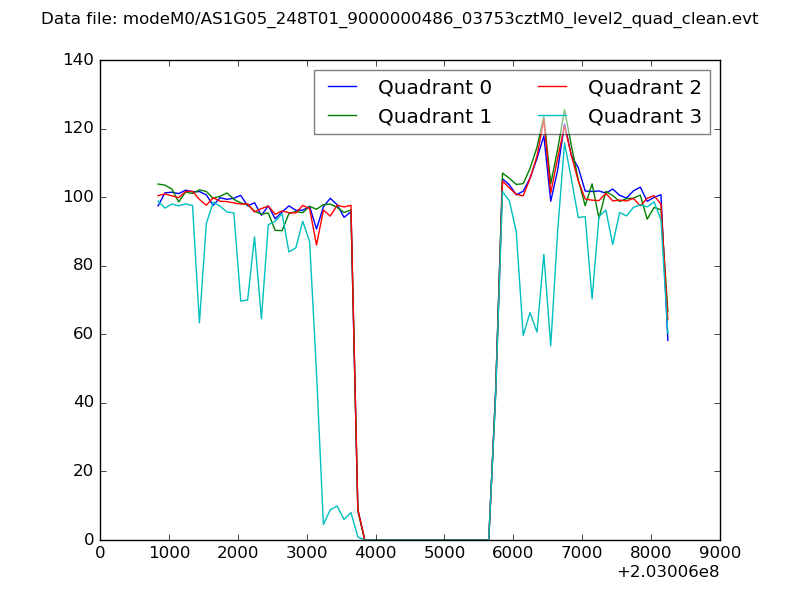 |
|
| Module-wise count rates for Quadrant A Data is divided into 100 sec bins |
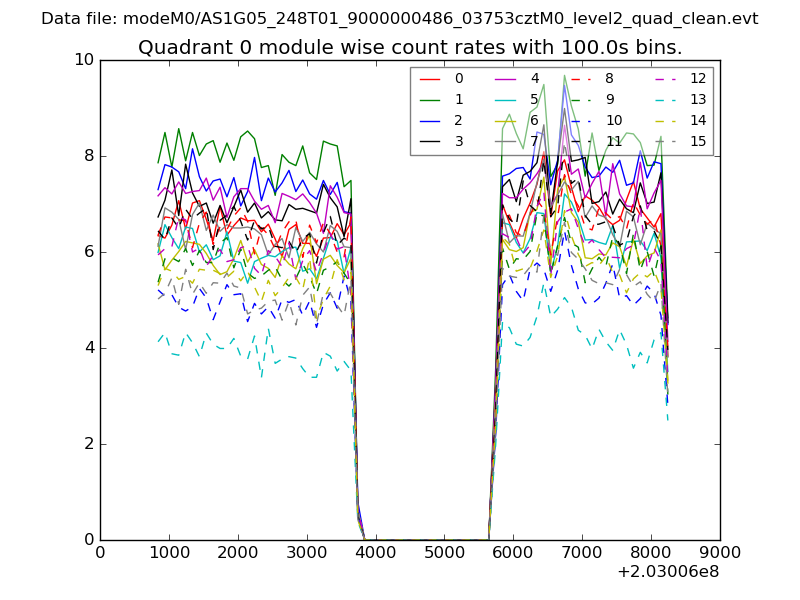 |
 |
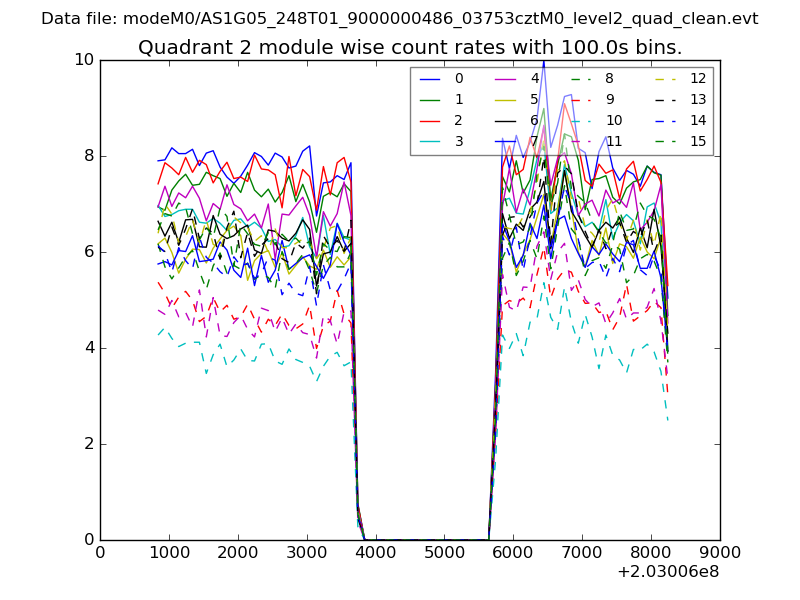
| Module-wise count rates for Quadrant B Data is divided into 100 sec bins |
 |
 |
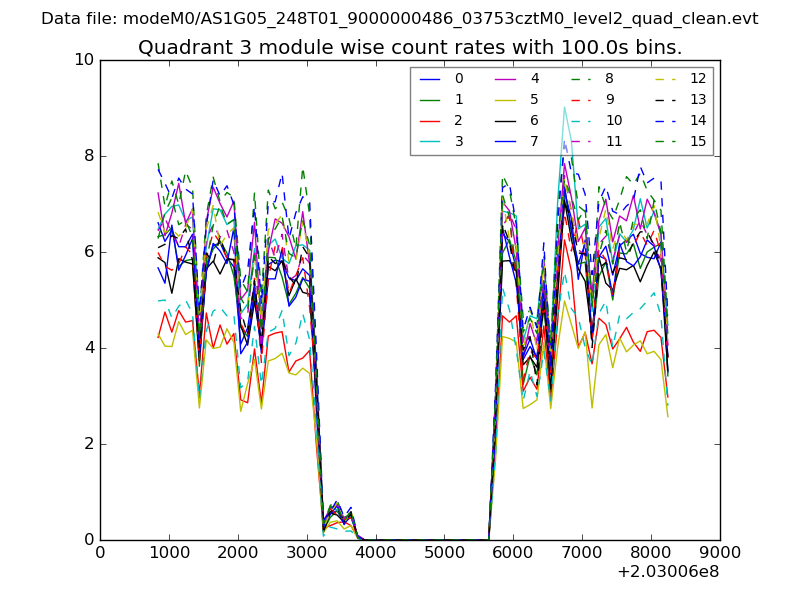
| Module-wise count rates for Quadrant C Data is divided into 100 sec bins |
 |
 |
| Module-wise count rates for Quadrant D Data is divided into 100 sec bins |
 |
 |
| Parameter | Plot |
|---|---|
| CZT HV Monitor | 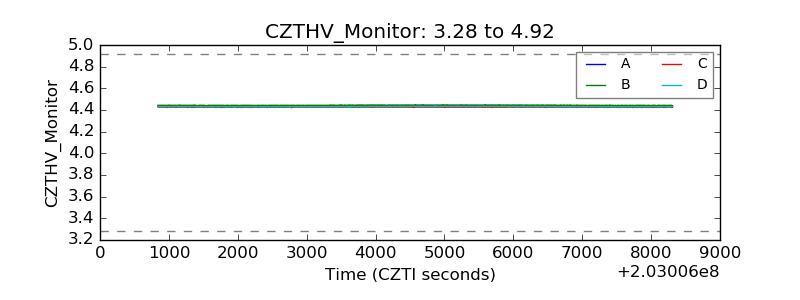 |
| D_VDD | 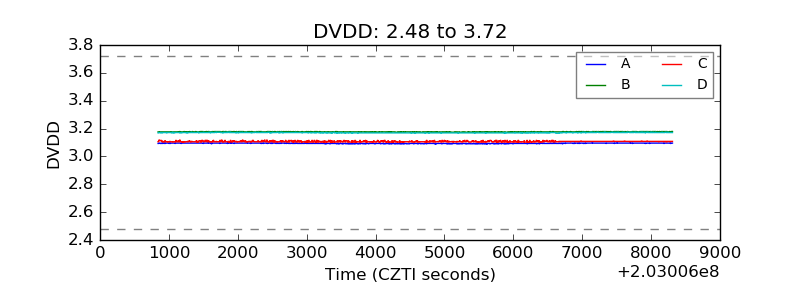 |
| Temperature 1 | 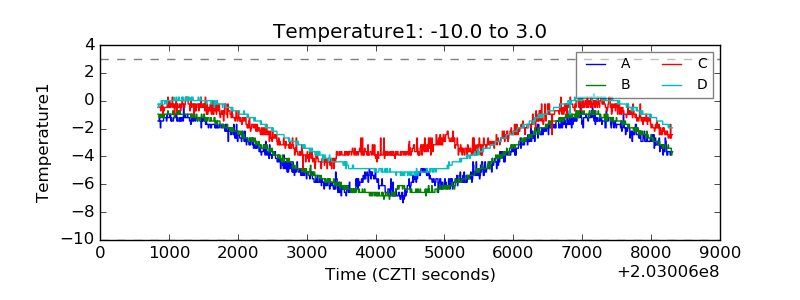 |
| Veto HV Monitor | 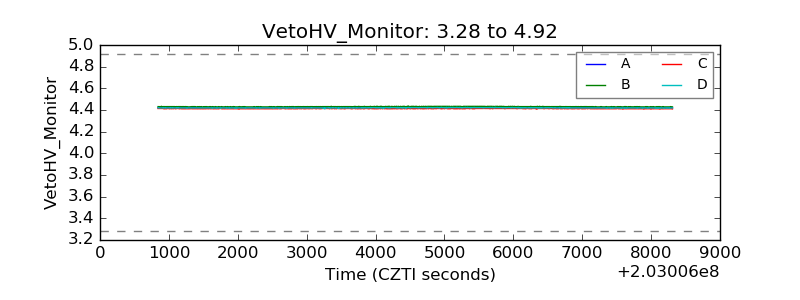 |
| Veto LLD | 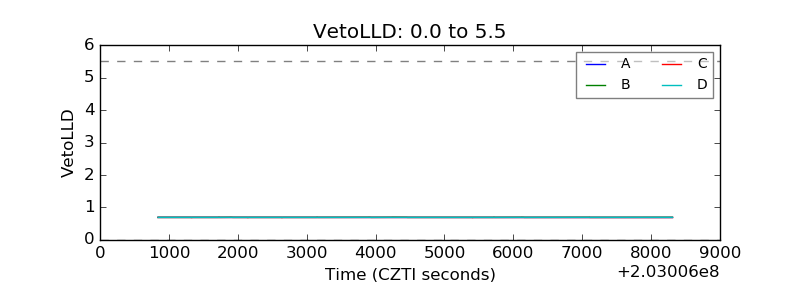 |
| Alpha Counter | 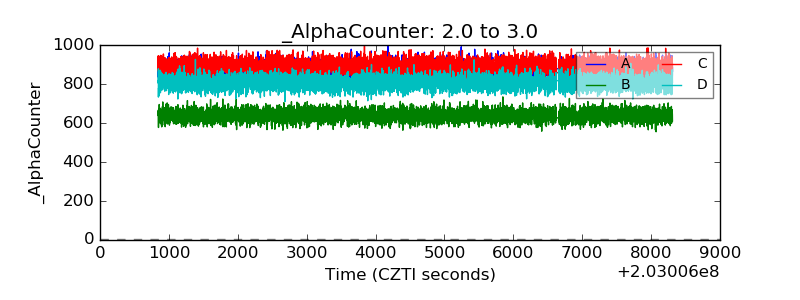 |
| _CPM_Rate | 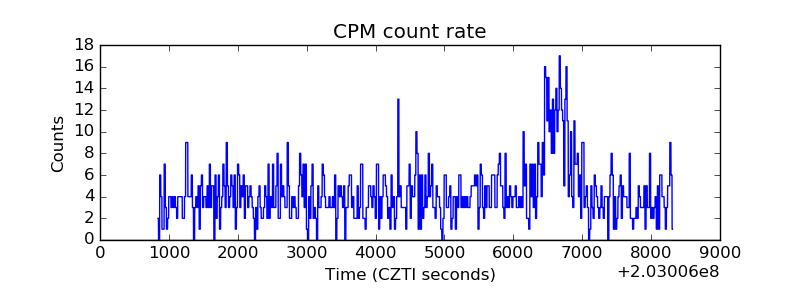 |
| CZT Counter | 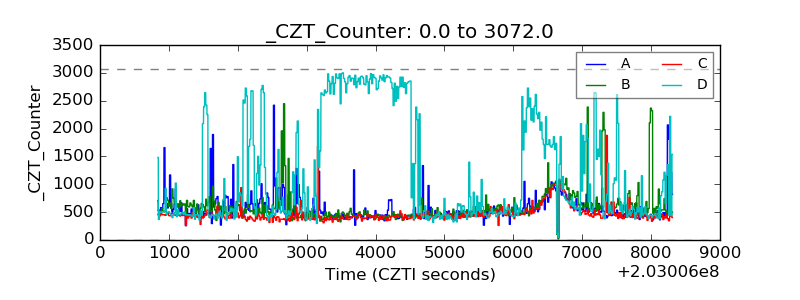 |
| +2.5 Volts monitor |  |
| +5 Volts monitor | 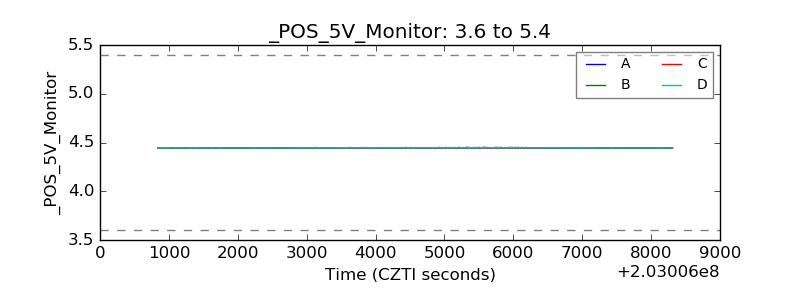 |
| Veto Counter |  |