| Param | Original file | Final file |
|---|---|---|
| Filename | modeM0/AS1G05_248T01_9000000486_03754cztM0_level2.evt | modeM0/AS1G05_248T01_9000000486_03754cztM0_level2_quad_clean.evt |
| Size (bytes) | 591,402,240 | 88,254,720 |
| Size | 564.0 MB | 84.2 MB |
| Events in quadrant A | 4,185,032 | 545,454 |
| Events in quadrant B | 4,265,152 | 545,515 |
| Events in quadrant C | 3,271,537 | 543,605 |
| Events in quadrant D | 5,683,841 | 519,376 |
| Mode SS | |||
|---|---|---|---|
| Quadrant | BADHDUFLAG | Total packets | Discarded packets |
| A | 0 | 150 | 0 |
| B | 0 | 150 | 0 |
| C | 0 | 150 | 0 |
| D | 0 | 150 | 0 |
| Mode M9 | |||
|---|---|---|---|
| Quadrant | BADHDUFLAG | Total packets | Discarded packets |
| A | 0 | 3 | 0 |
| B | 0 | 3 | 0 |
| C | 0 | 3 | 0 |
| D | 0 | 3 | 0 |
| Mode M0 | |||
|---|---|---|---|
| Quadrant | BADHDUFLAG | Total packets | Discarded packets |
| A | 0 | 17461 | 2 |
| B | 0 | 17519 | 1 |
| C | 0 | 15241 | 1 |
| D | 0 | 22046 | 1 |
| Quadrant | Total seconds | Saturated seconds | Saturation percentage |
|---|---|---|---|
| A | 7454 | 140 | 1.878186% |
| B | 7454 | 113 | 1.515965% |
| C | 7454 | 29 | 0.389053% |
| D | 7454 | 617 | 8.277435% |
Noise dominated data is calculated using 1-second bins in cleaned event files. If a bin has >2000 counts, and if more than 50% of those come from <1% of pixels, then it is considered to be noise-dominated and hence unusable.
| Quadrant | # 1 sec bins | Bins with >0 counts | Bins with >2000 counts | High rate bins dominated by noise | Noise dominated (total time) | Noise dominated (detector-on time) | Marked lightcurve |
|---|---|---|---|---|---|---|---|
| A | 7739 | 7455 | 92 | 92 | 1.19% | 1.23% | 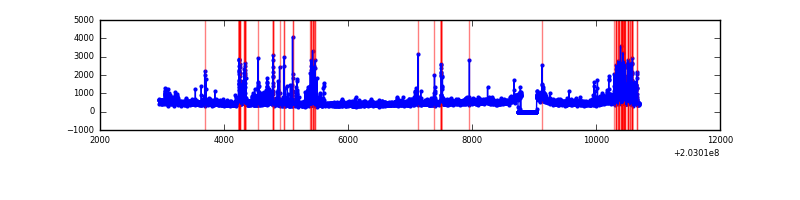 |
| B | 7739 | 7456 | 47 | 47 | 0.61% | 0.63% | 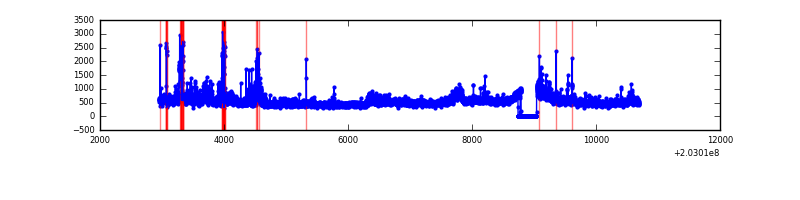 |
| C | 7739 | 7456 | 3 | 3 | 0.04% | 0.04% | 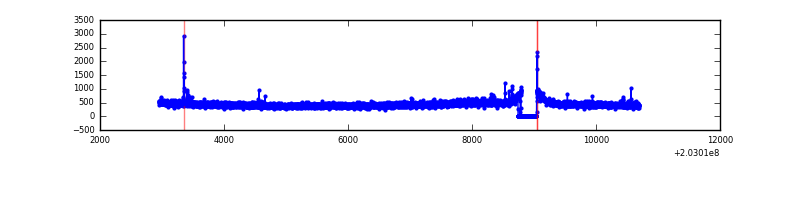 |
| D | 7739 | 7456 | 571 | 571 | 7.38% | 7.66% | 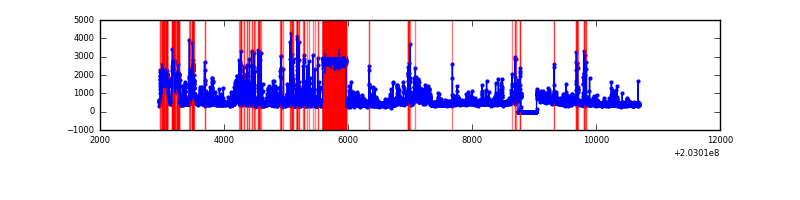 |
Top three noisy pixels from each quadrant. If the there are fewer than three noisy pixels in the level2.evt file, extra rows are filled as -1
| Pixel properties | Quadrant properties | ||||||
|---|---|---|---|---|---|---|---|
| Quadrant | DetID | PixID | Counts | Sigma | Mean | Median | Sigma |
| A | 13 | 251 | 347145 | 1996.7 | 841 | 820 | 173.4 |
| A | 0 | 118 | 285660 | 1642.21 | 841 | 820 | 173.4 |
| A | 8 | 15 | 131991 | 756.25 | 841 | 820 | 173.4 |
| B | 15 | 204 | 272707 | 1634.5 | 854 | 832 | 166.3 |
| B | 5 | 70 | 183580 | 1098.68 | 854 | 832 | 166.3 |
| B | 4 | 81 | 139673 | 834.71 | 854 | 832 | 166.3 |
| C | 12 | 4 | 15100 | 73.59 | 825 | 827 | 194.0 |
| C | 1 | 16 | 13970 | 67.76 | 825 | 827 | 194.0 |
| C | 9 | 144 | 11741 | 56.27 | 825 | 827 | 194.0 |
| D | 1 | 20 | 1586369 | 8275.72 | 792 | 769 | 191.6 |
| D | 8 | 112 | 523742 | 2729.55 | 792 | 769 | 191.6 |
| D | 10 | 85 | 181126 | 941.34 | 792 | 769 | 191.6 |
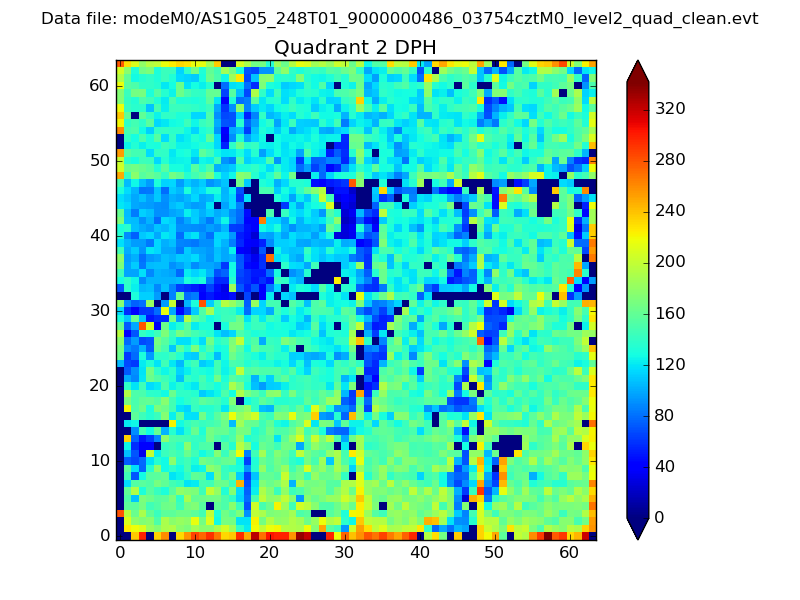
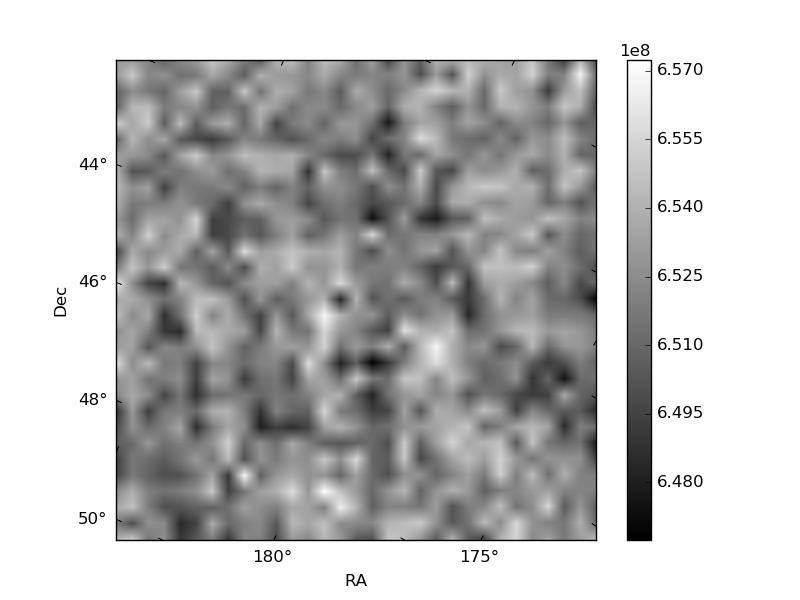
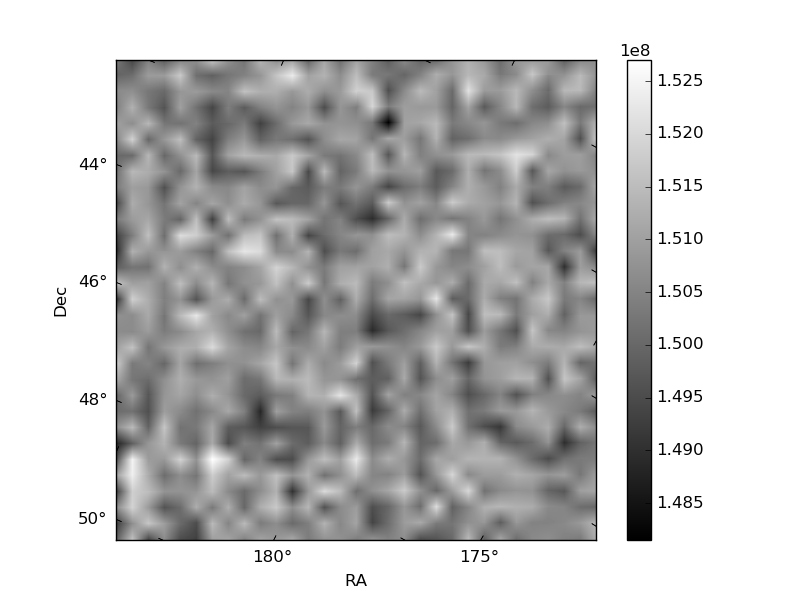
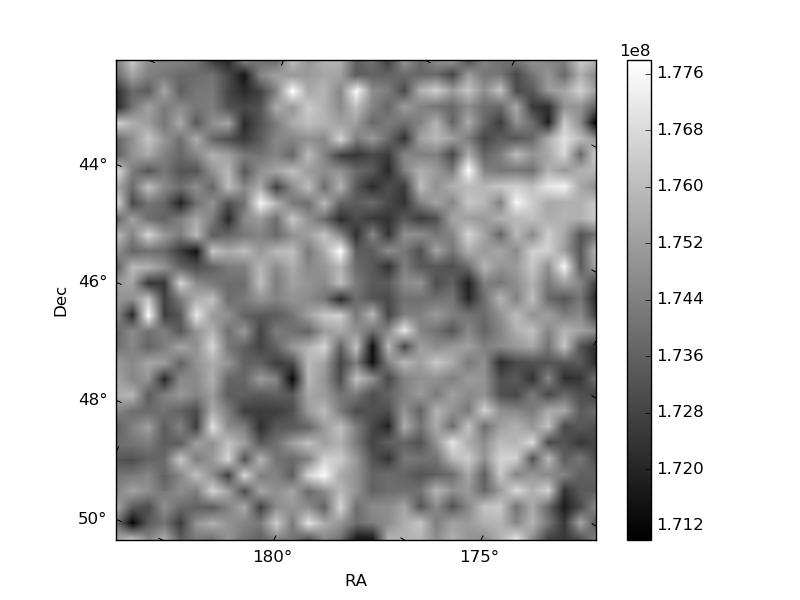
Histogram calculated using DETX and DETY for each event in the final _common_clean file
| Quadrant A | 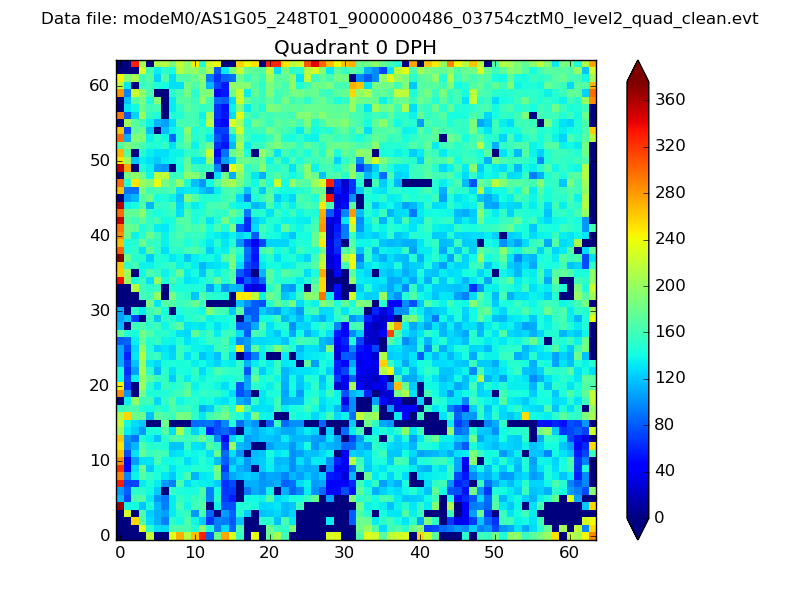 |
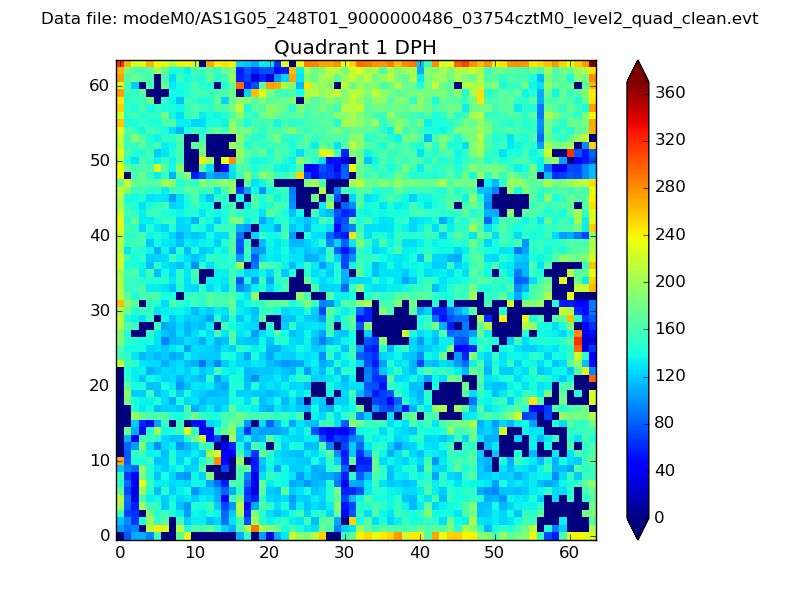 |
Quadrant B |
|---|---|---|---|
| Quadrant D | 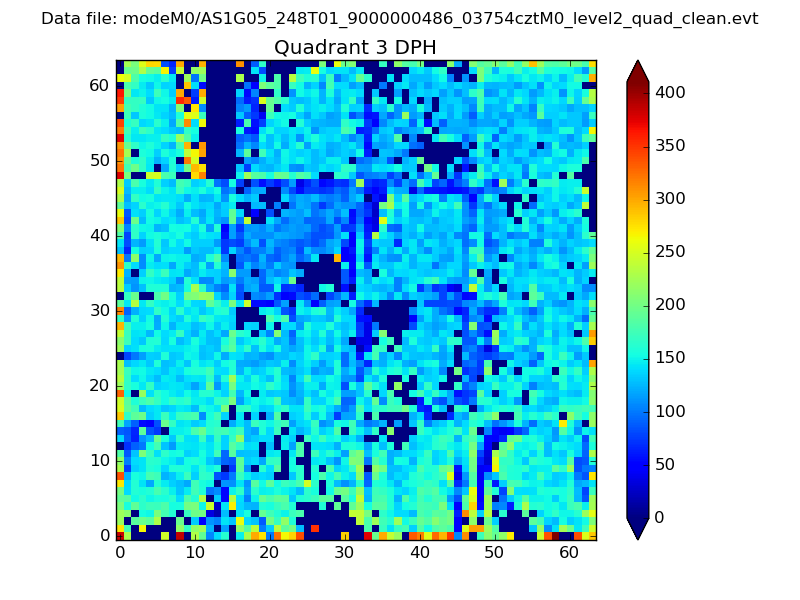 |
 |
Quadrant C |
| Plot type | Count rate plots | Images |
|---|---|---|
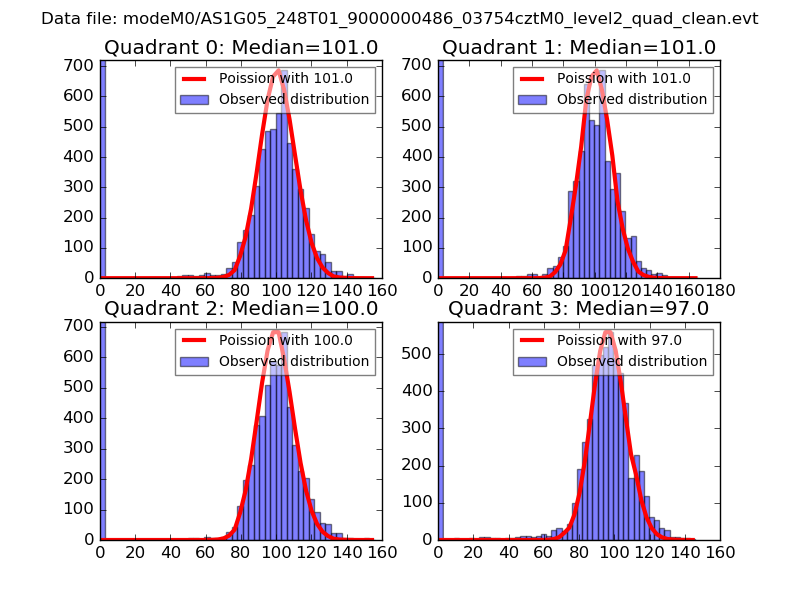
| Comparison with Poisson distribution Blue bars denote a histogram of data divided into 1 sec bins. Red curve is a Poisson curve with rate = median count rate of data. |
 |
 |
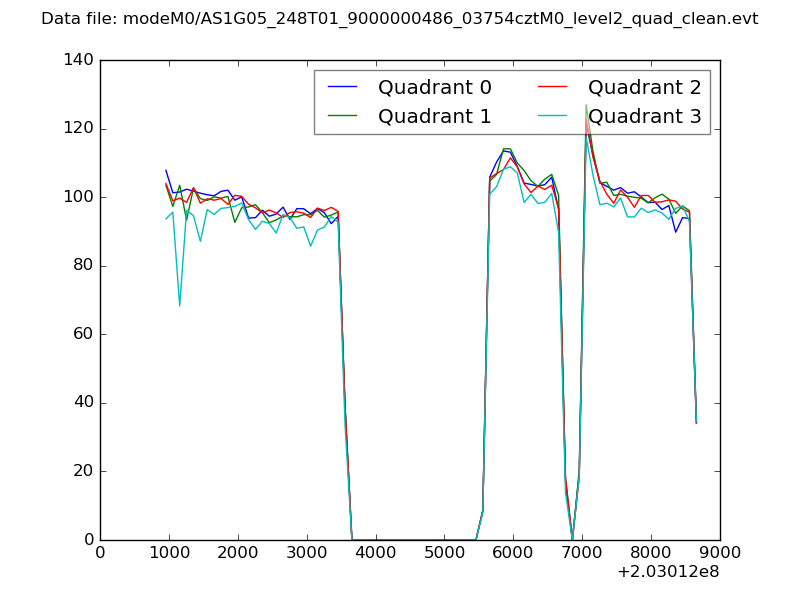
| Quadrant-wise count rates Data is divided into 100 sec bins |
 |
|
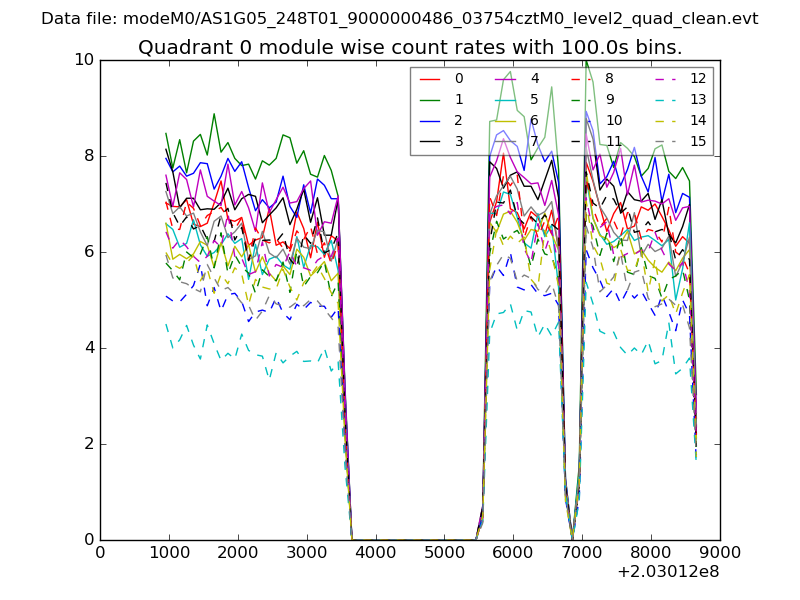
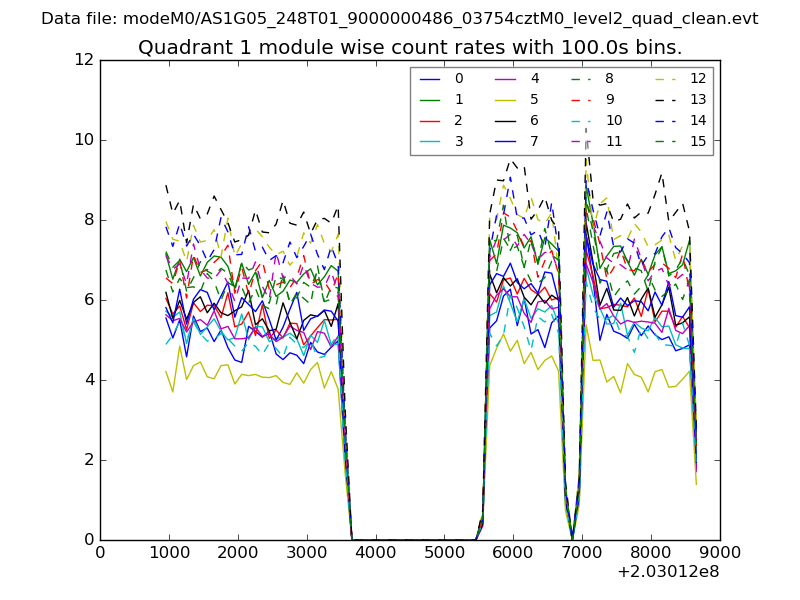
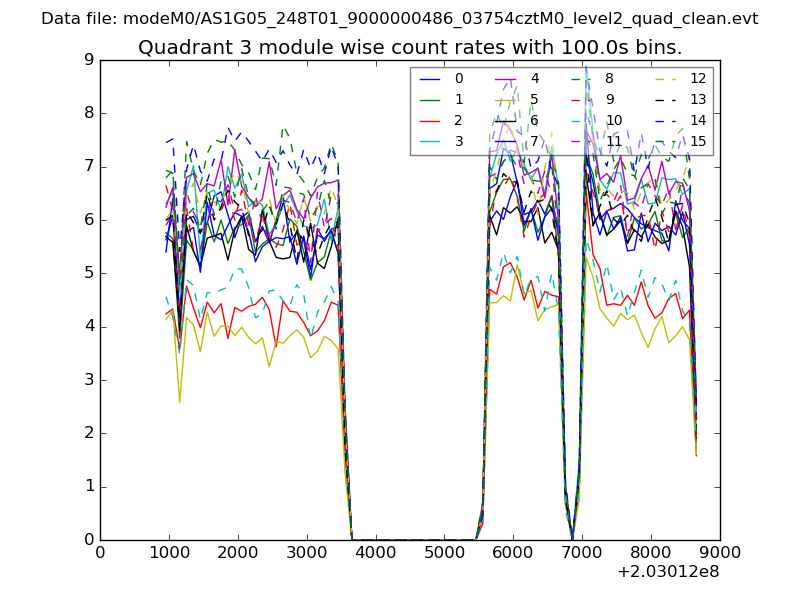
| Module-wise count rates for Quadrant A Data is divided into 100 sec bins |
 |
 |
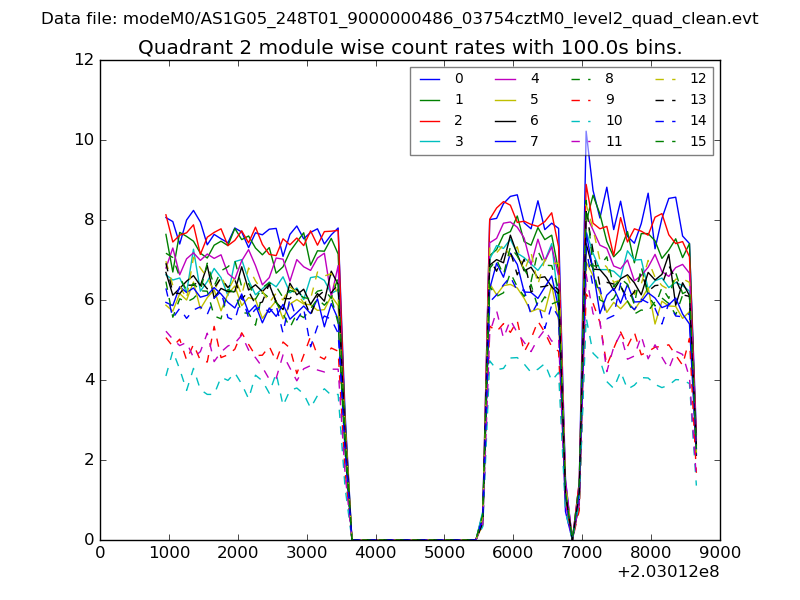
| Module-wise count rates for Quadrant B Data is divided into 100 sec bins |
 |
 |
| Module-wise count rates for Quadrant C Data is divided into 100 sec bins |
 |
 |
| Module-wise count rates for Quadrant D Data is divided into 100 sec bins |
 |
 |
| Parameter | Plot |
|---|---|
| CZT HV Monitor | 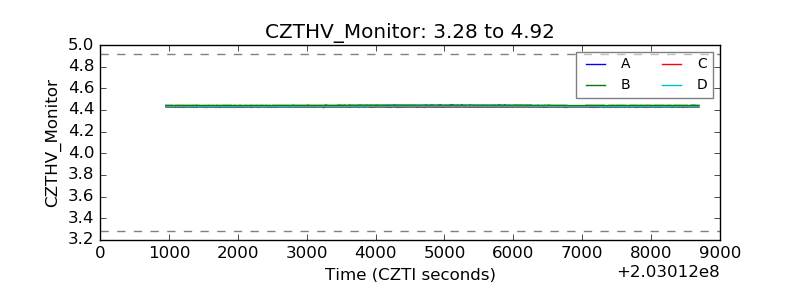 |
| D_VDD | 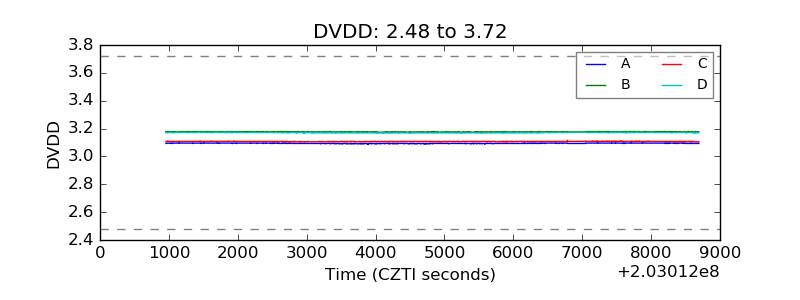 |
| Temperature 1 |  |
| Veto HV Monitor | 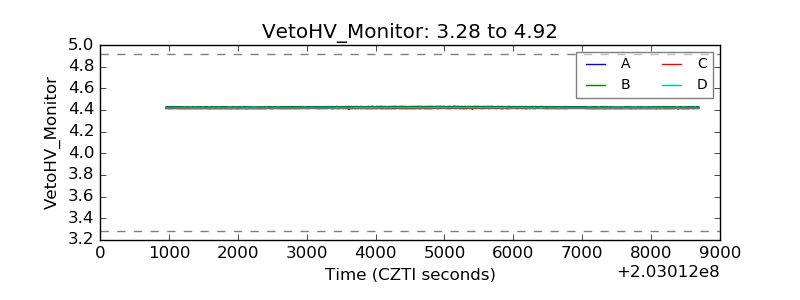 |
| Veto LLD | 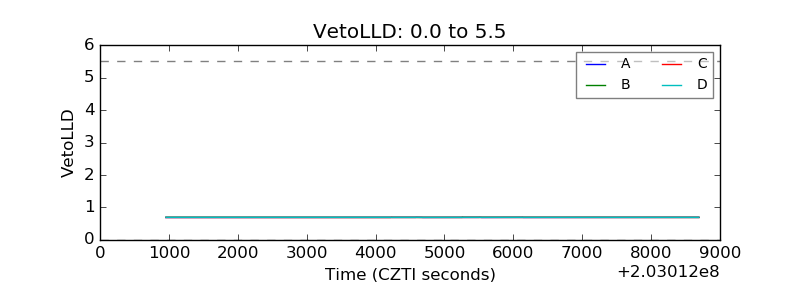 |
| Alpha Counter | 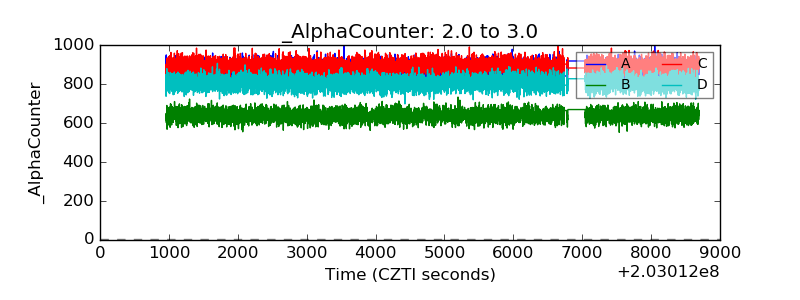 |
| _CPM_Rate |  |
| CZT Counter | 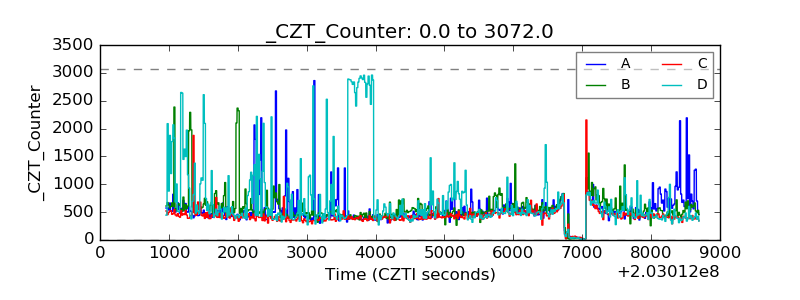 |
| +2.5 Volts monitor |  |
| +5 Volts monitor |  |
| Veto Counter | 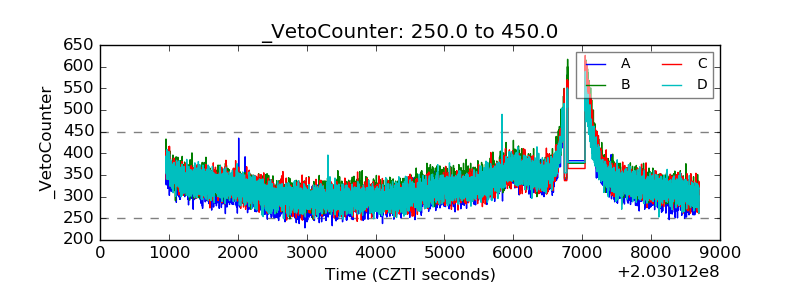 |