| Param | Original file | Final file |
|---|---|---|
| Filename | modeM0/AS1G05_248T01_9000000486_03757cztM0_level2.evt | modeM0/AS1G05_248T01_9000000486_03757cztM0_level2_quad_clean.evt |
| Size (bytes) | 1,417,037,760 | 195,998,400 |
| Size | 1.3 GB | 186.9 MB |
| Events in quadrant A | 10,993,506 | 1,181,164 |
| Events in quadrant B | 10,209,727 | 1,186,862 |
| Events in quadrant C | 7,999,425 | 1,178,105 |
| Events in quadrant D | 12,472,291 | 1,123,101 |
| Mode SS | |||
|---|---|---|---|
| Quadrant | BADHDUFLAG | Total packets | Discarded packets |
| A | 0 | 374 | 0 |
| B | 0 | 374 | 0 |
| C | 0 | 374 | 0 |
| D | 0 | 374 | 0 |
| Mode M9 | |||
|---|---|---|---|
| Quadrant | BADHDUFLAG | Total packets | Discarded packets |
| A | 0 | 20 | 0 |
| B | 0 | 20 | 0 |
| C | 0 | 20 | 0 |
| D | 0 | 20 | 0 |
| Mode M0 | |||
|---|---|---|---|
| Quadrant | BADHDUFLAG | Total packets | Discarded packets |
| A | 0 | 45195 | 4 |
| B | 0 | 42549 | 3 |
| C | 0 | 37427 | 3 |
| D | 0 | 50184 | 3 |
| Quadrant | Total seconds | Saturated seconds | Saturation percentage |
|---|---|---|---|
| A | 18374 | 506 | 2.753891% |
| B | 18374 | 127 | 0.691194% |
| C | 18374 | 39 | 0.212256% |
| D | 18374 | 637 | 3.466855% |
Noise dominated data is calculated using 1-second bins in cleaned event files. If a bin has >2000 counts, and if more than 50% of those come from <1% of pixels, then it is considered to be noise-dominated and hence unusable.
| Quadrant | # 1 sec bins | Bins with >0 counts | Bins with >2000 counts | High rate bins dominated by noise | Noise dominated (total time) | Noise dominated (detector-on time) | Marked lightcurve |
|---|---|---|---|---|---|---|---|
| A | 20379 | 18377 | 414 | 414 | 2.03% | 2.25% | 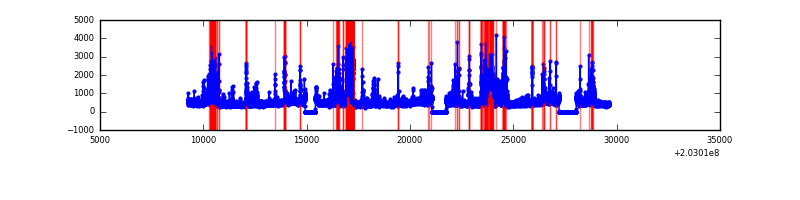 |
| B | 20379 | 18377 | 27 | 27 | 0.13% | 0.15% | 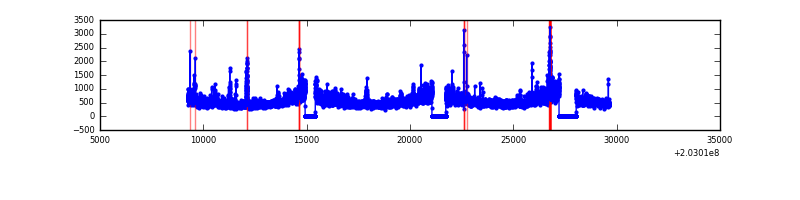 |
| C | 20379 | 18377 | 16 | 16 | 0.08% | 0.09% | 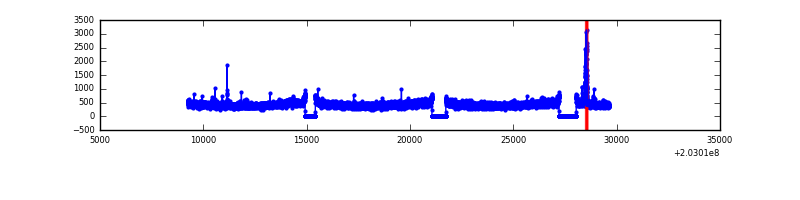 |
| D | 20379 | 18377 | 598 | 598 | 2.93% | 3.25% | 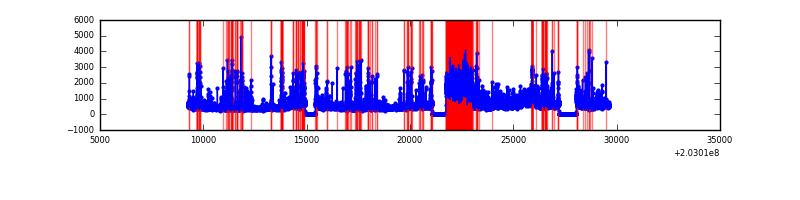 |
Top three noisy pixels from each quadrant. If the there are fewer than three noisy pixels in the level2.evt file, extra rows are filled as -1
| Pixel properties | Quadrant properties | ||||||
|---|---|---|---|---|---|---|---|
| Quadrant | DetID | PixID | Counts | Sigma | Mean | Median | Sigma |
| A | 13 | 251 | 2192017 | 5232.93 | 2043 | 1998 | 418.5 |
| A | 0 | 118 | 369115 | 877.21 | 2043 | 1998 | 418.5 |
| A | 8 | 15 | 220315 | 521.66 | 2043 | 1998 | 418.5 |
| B | 15 | 204 | 1081026 | 2689.88 | 2084 | 2032 | 401.1 |
| B | 14 | 167 | 640606 | 1591.93 | 2084 | 2032 | 401.1 |
| B | 15 | 54 | 86076 | 209.52 | 2084 | 2032 | 401.1 |
| C | 1 | 16 | 124732 | 262.34 | 2005 | 2014 | 467.8 |
| C | 13 | 61 | 16779 | 31.56 | 2005 | 2014 | 467.8 |
| C | 8 | 128 | 13401 | 24.34 | 2005 | 2014 | 467.8 |
| D | 1 | 20 | 3053375 | 6382.54 | 1979 | 1923 | 478.1 |
| D | 8 | 112 | 702457 | 1465.27 | 1979 | 1923 | 478.1 |
| D | 13 | 249 | 304088 | 632.02 | 1979 | 1923 | 478.1 |
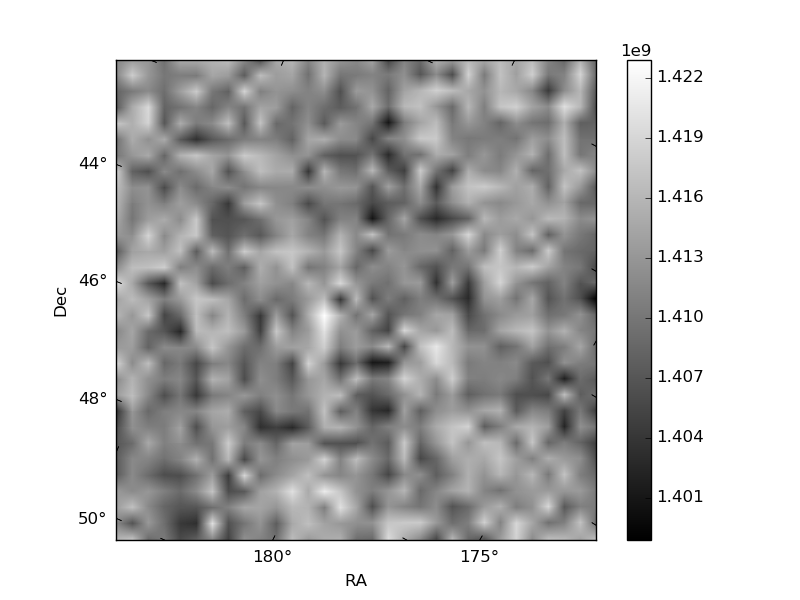
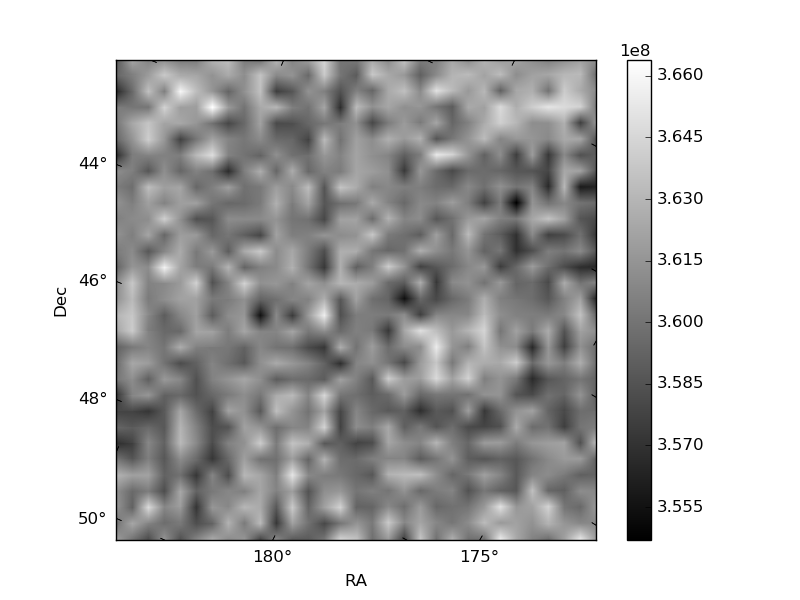
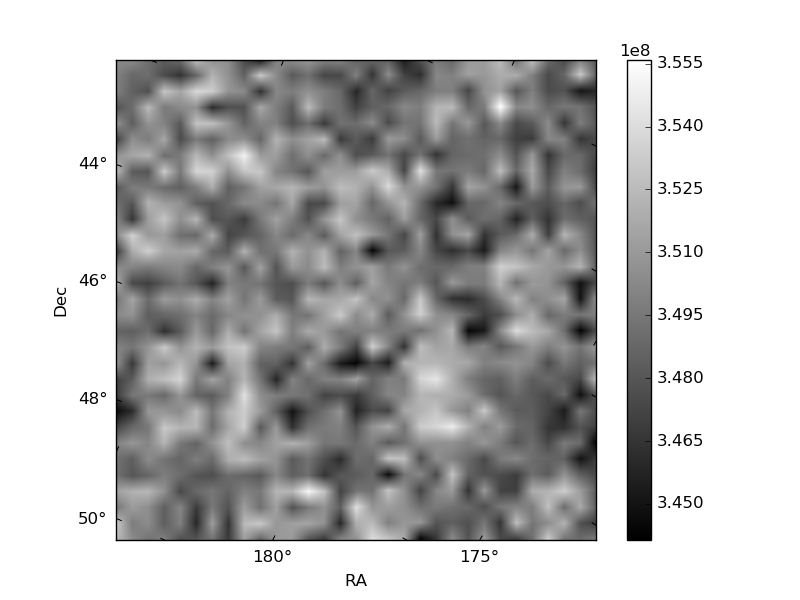
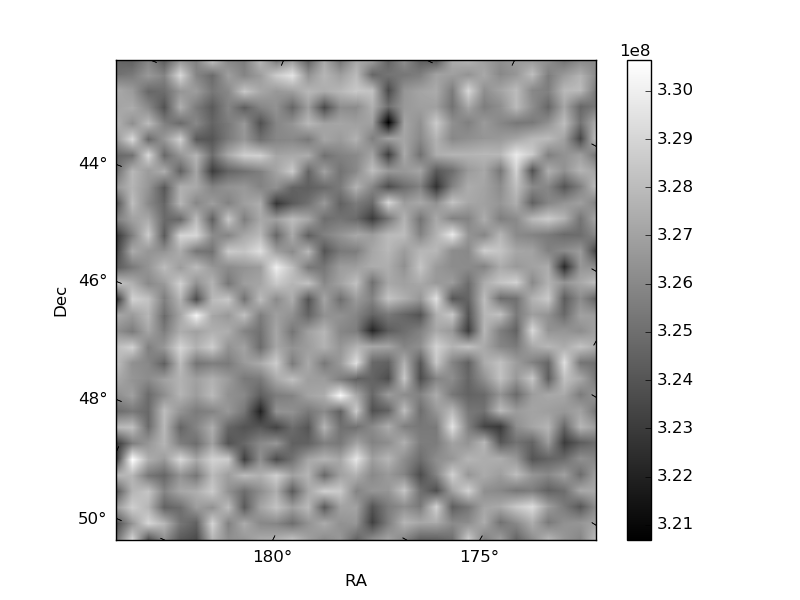
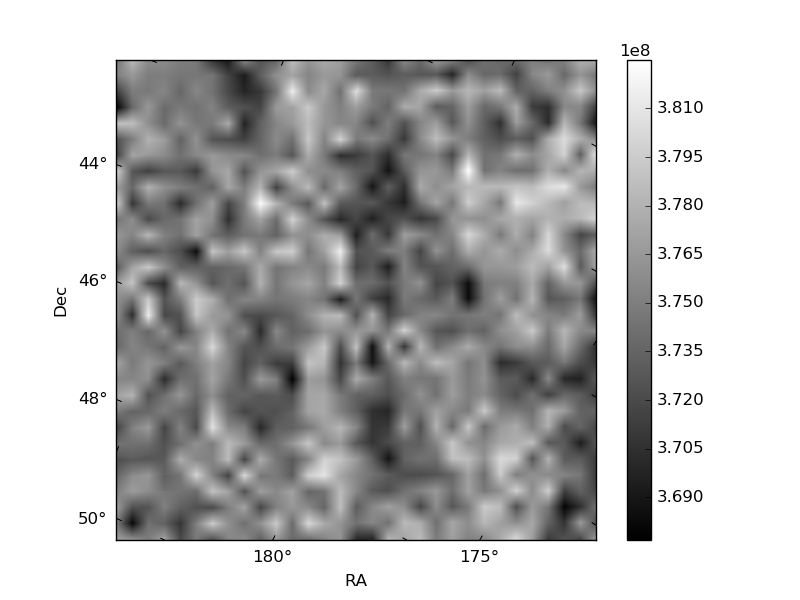
Histogram calculated using DETX and DETY for each event in the final _common_clean file
| Quadrant A | 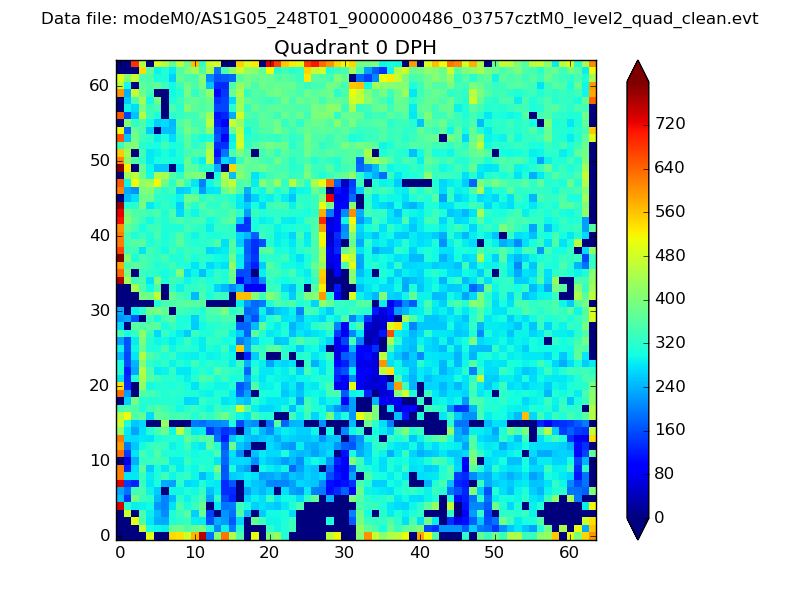 |
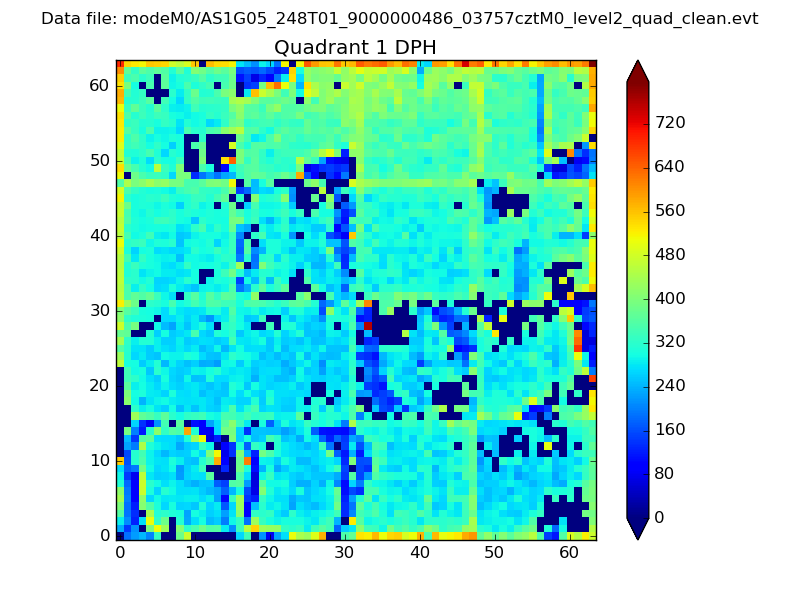 |
Quadrant B |
|---|---|---|---|
| Quadrant D | 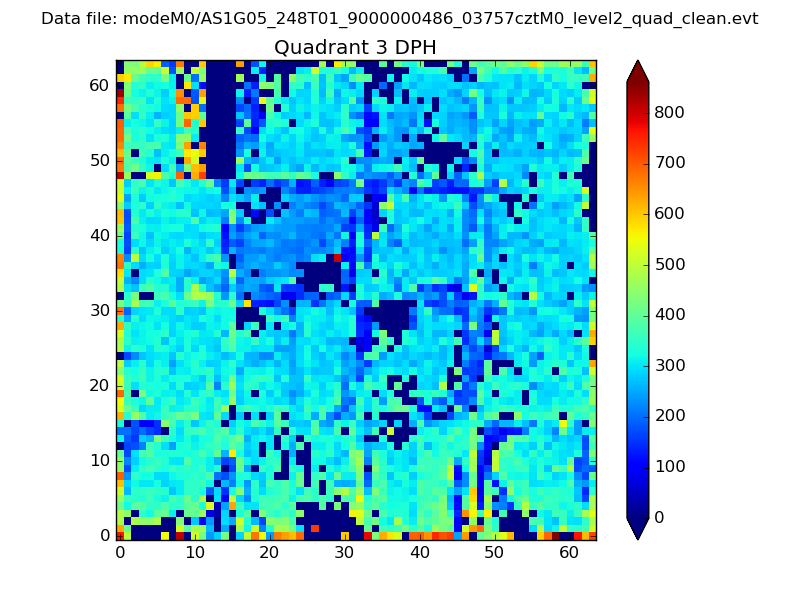 |
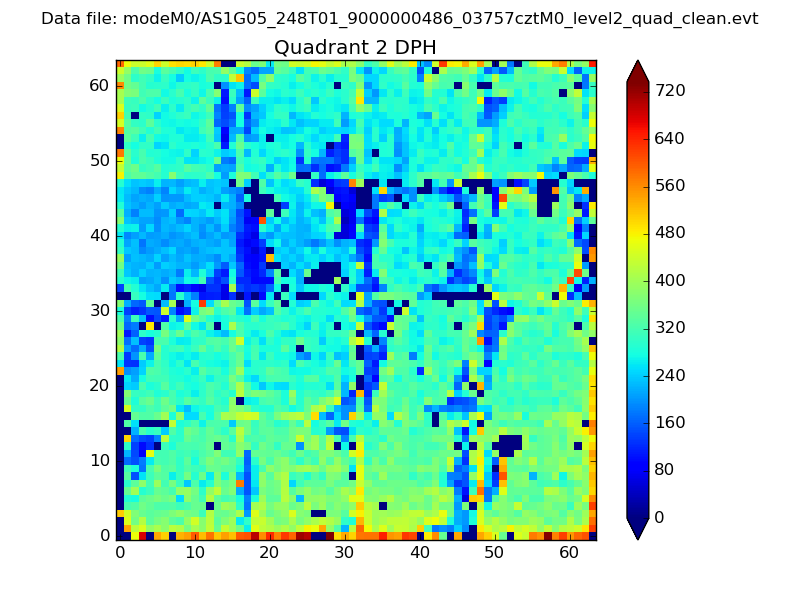 |
Quadrant C |
| Plot type | Count rate plots | Images |
|---|---|---|
| Comparison with Poisson distribution Blue bars denote a histogram of data divided into 1 sec bins. Red curve is a Poisson curve with rate = median count rate of data. |
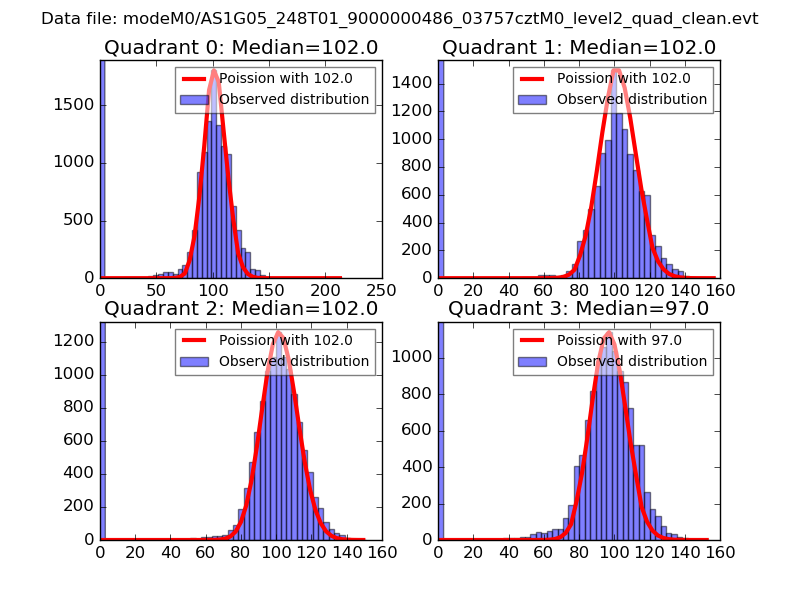 |
 |
| Quadrant-wise count rates Data is divided into 100 sec bins |
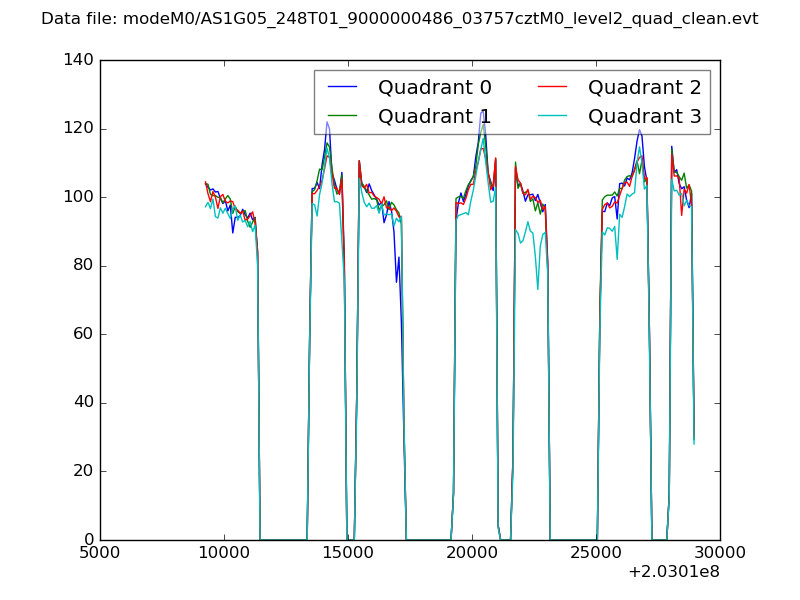 |
|
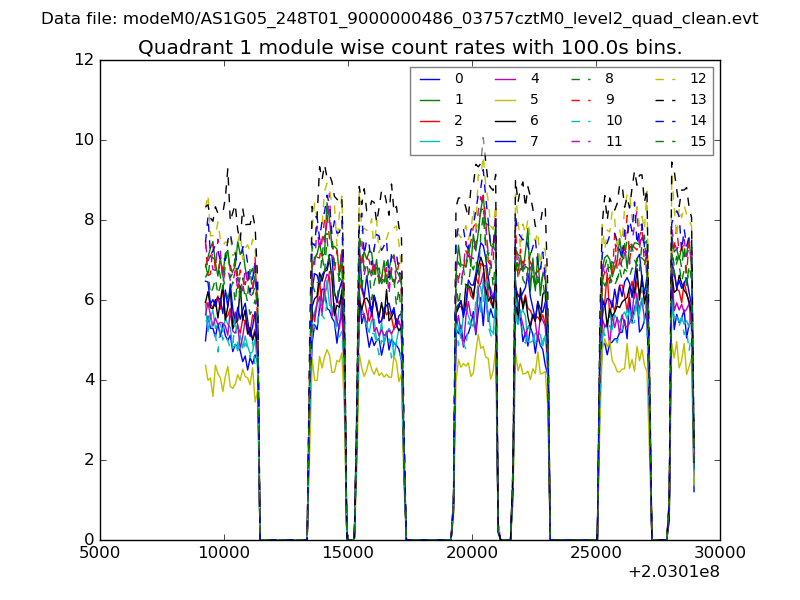
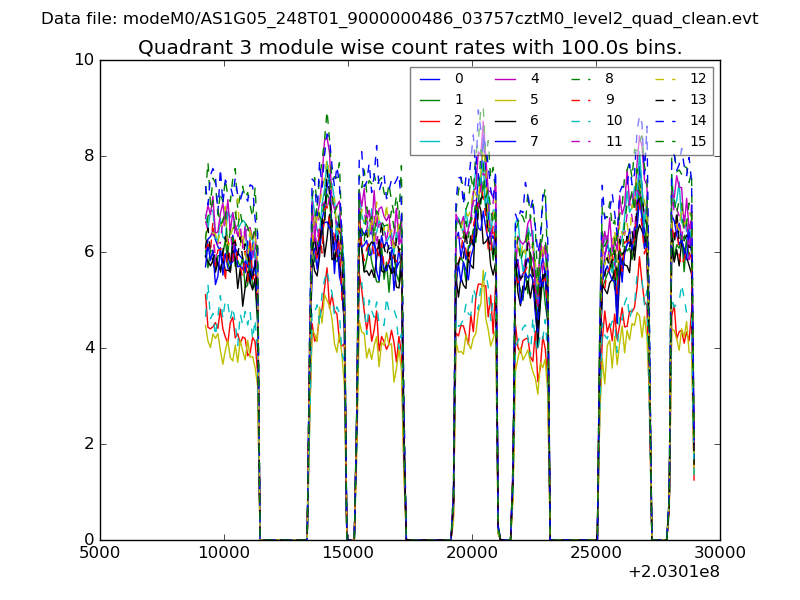
| Module-wise count rates for Quadrant A Data is divided into 100 sec bins |
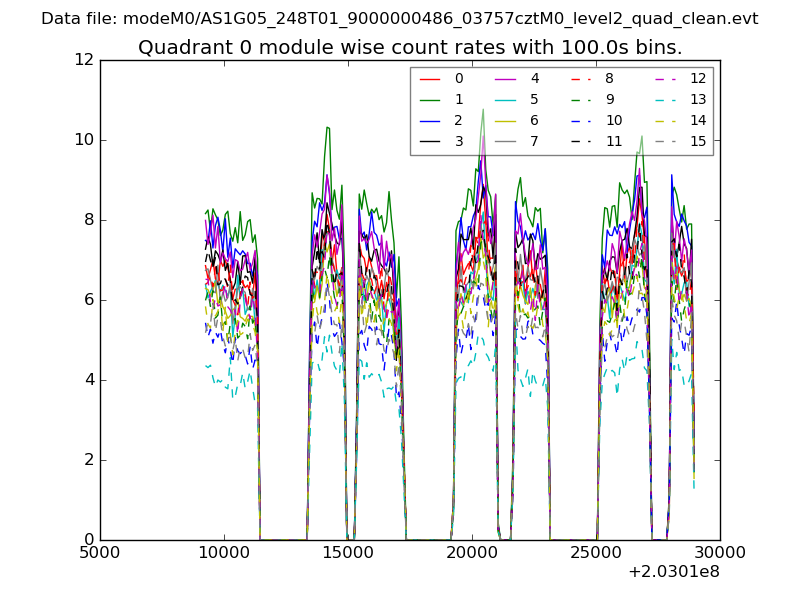 |
 |
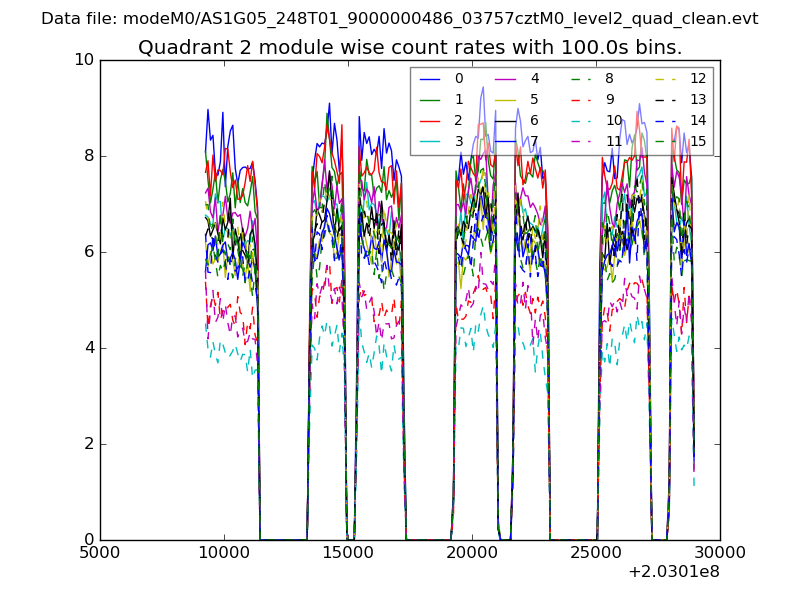
| Module-wise count rates for Quadrant B Data is divided into 100 sec bins |
 |
 |
| Module-wise count rates for Quadrant C Data is divided into 100 sec bins |
 |
 |
| Module-wise count rates for Quadrant D Data is divided into 100 sec bins |
 |
 |
| Parameter | Plot |
|---|---|
| CZT HV Monitor | 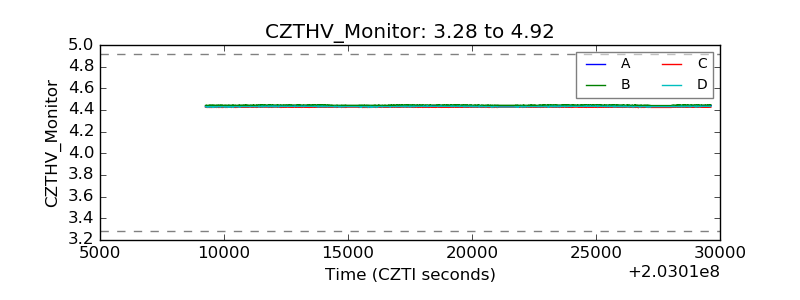 |
| D_VDD | 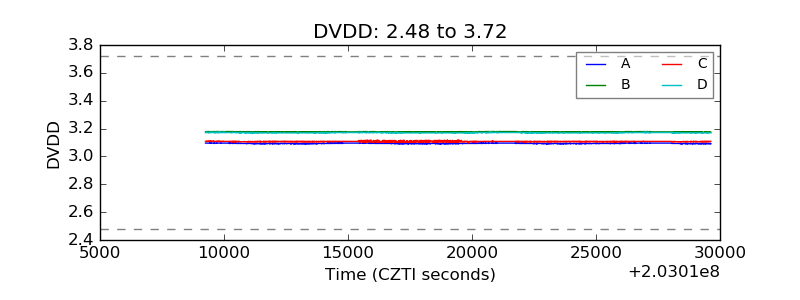 |
| Temperature 1 | 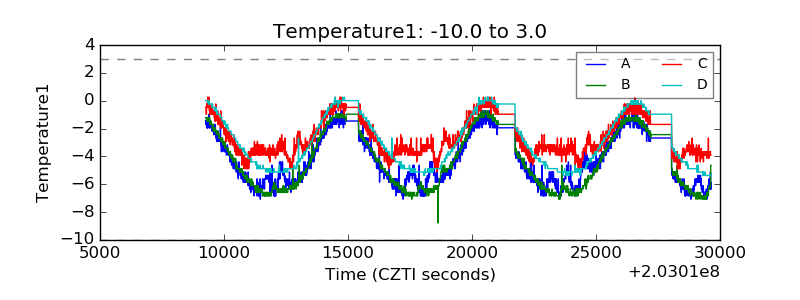 |
| Veto HV Monitor | 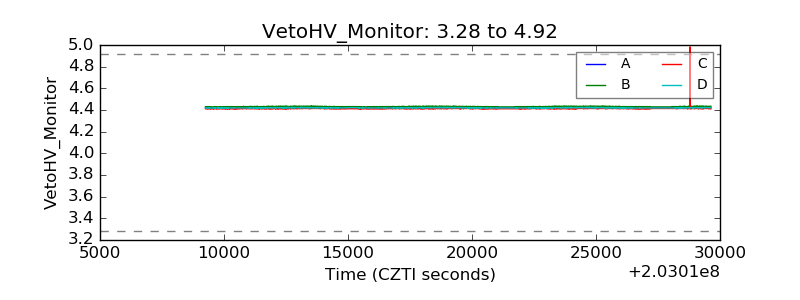 |
| Veto LLD | 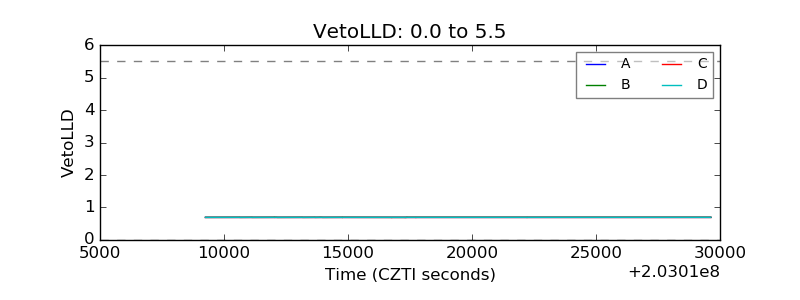 |
| Alpha Counter | 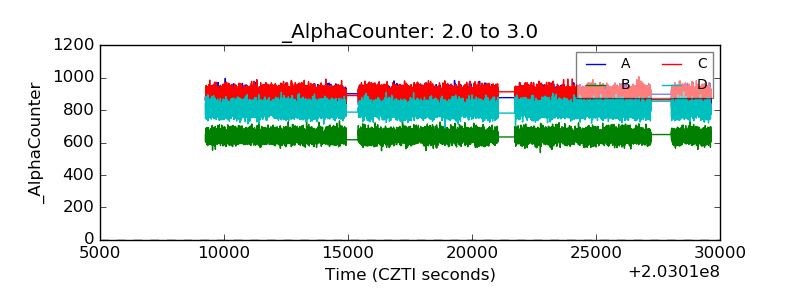 |
| _CPM_Rate | 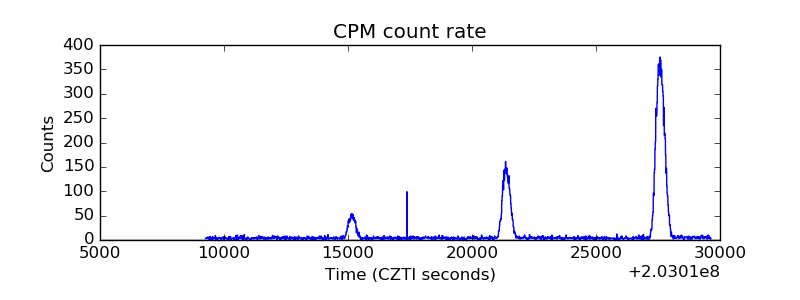 |
| CZT Counter | 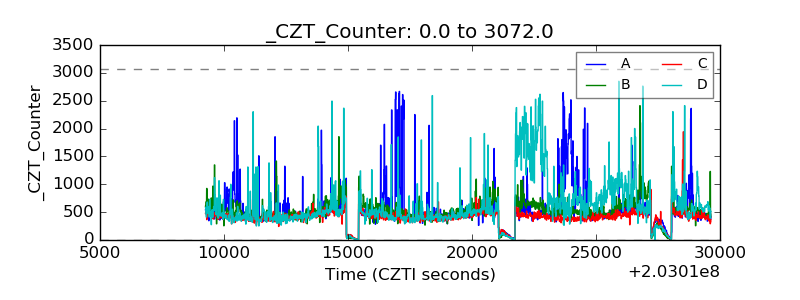 |
| +2.5 Volts monitor |  |
| +5 Volts monitor |  |
| Veto Counter | 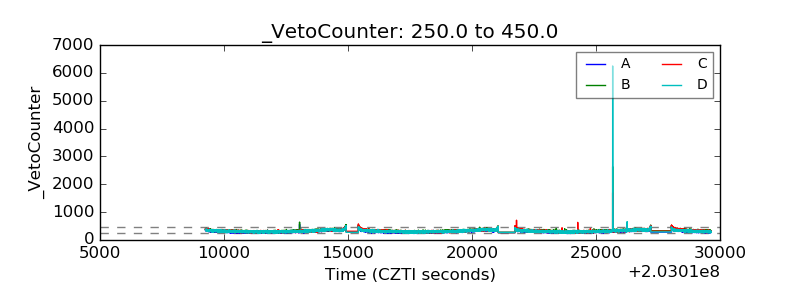 |