| Param | Original file | Final file |
|---|---|---|
| Filename | modeM0/AS1G05_248T01_9000000486_03760cztM0_level2.evt | modeM0/AS1G05_248T01_9000000486_03760cztM0_level2_quad_clean.evt |
| Size (bytes) | 610,303,680 | 53,323,200 |
| Size | 582.0 MB | 50.9 MB |
| Events in quadrant A | 3,112,970 | 301,122 |
| Events in quadrant B | 3,723,107 | 296,275 |
| Events in quadrant C | 2,863,673 | 296,369 |
| Events in quadrant D | 8,354,493 | 278,792 |
| Mode SS | |||
|---|---|---|---|
| Quadrant | BADHDUFLAG | Total packets | Discarded packets |
| A | 0 | 130 | 0 |
| B | 0 | 130 | 0 |
| C | 0 | 130 | 0 |
| D | 0 | 130 | 0 |
| Mode M9 | |||
|---|---|---|---|
| Quadrant | BADHDUFLAG | Total packets | Discarded packets |
| A | 0 | 11 | 0 |
| B | 0 | 11 | 0 |
| C | 0 | 11 | 0 |
| D | 0 | 11 | 0 |
| Mode M0 | |||
|---|---|---|---|
| Quadrant | BADHDUFLAG | Total packets | Discarded packets |
| A | 0 | 13495 | 2 |
| B | 0 | 15208 | 1 |
| C | 0 | 12933 | 1 |
| D | 0 | 29109 | 1 |
| Quadrant | Total seconds | Saturated seconds | Saturation percentage |
|---|---|---|---|
| A | 6322 | 77 | 1.217969% |
| B | 6322 | 89 | 1.407782% |
| C | 6322 | 23 | 0.363809% |
| D | 6322 | 2027 | 32.062638% |
Noise dominated data is calculated using 1-second bins in cleaned event files. If a bin has >2000 counts, and if more than 50% of those come from <1% of pixels, then it is considered to be noise-dominated and hence unusable.
| Quadrant | # 1 sec bins | Bins with >0 counts | Bins with >2000 counts | High rate bins dominated by noise | Noise dominated (total time) | Noise dominated (detector-on time) | Marked lightcurve |
|---|---|---|---|---|---|---|---|
| A | 7417 | 6323 | 23 | 23 | 0.31% | 0.36% | 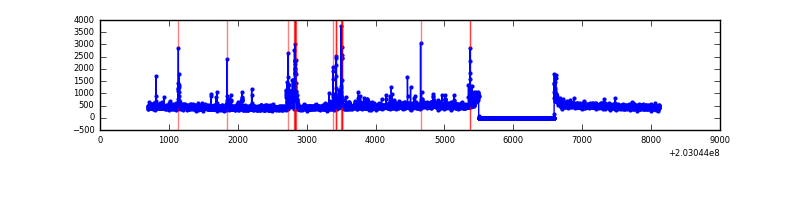 |
| B | 7417 | 6322 | 34 | 34 | 0.46% | 0.54% | 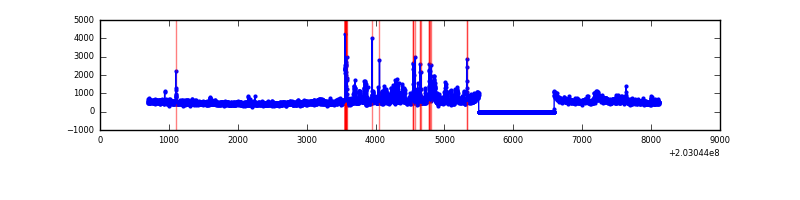 |
| C | 7417 | 6323 | 0 | 0 | 0.00% | 0.00% | 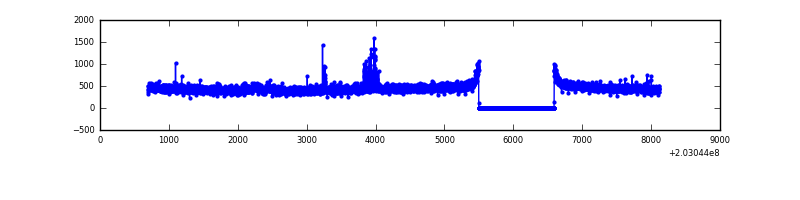 |
| D | 7417 | 6322 | 2001 | 2001 | 26.98% | 31.65% | 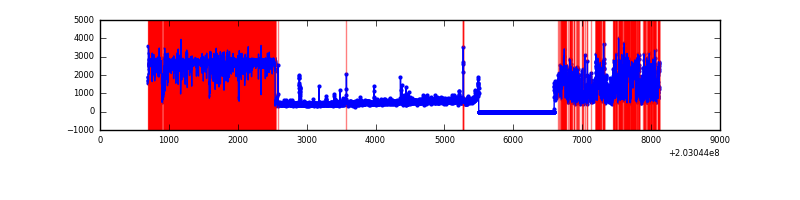 |
Top three noisy pixels from each quadrant. If the there are fewer than three noisy pixels in the level2.evt file, extra rows are filled as -1
| Pixel properties | Quadrant properties | ||||||
|---|---|---|---|---|---|---|---|
| Quadrant | DetID | PixID | Counts | Sigma | Mean | Median | Sigma |
| A | 0 | 50 | 95935 | 627.0 | 734 | 718 | 151.9 |
| A | 13 | 251 | 86996 | 568.13 | 734 | 718 | 151.9 |
| A | 0 | 118 | 78904 | 514.85 | 734 | 718 | 151.9 |
| B | 15 | 204 | 488121 | 3407.44 | 740 | 722 | 143.0 |
| B | 5 | 200 | 106590 | 740.13 | 740 | 722 | 143.0 |
| B | 4 | 81 | 98255 | 681.86 | 740 | 722 | 143.0 |
| C | 8 | 208 | 36236 | 213.96 | 710 | 713 | 166.0 |
| C | 10 | 34 | 32739 | 192.9 | 710 | 713 | 166.0 |
| C | 12 | 4 | 17145 | 98.97 | 710 | 713 | 166.0 |
| D | 12 | 79 | 5357034 | 35111.61 | 620 | 601 | 152.6 |
| D | 1 | 20 | 291474 | 1906.68 | 620 | 601 | 152.6 |
| D | 13 | 239 | 139075 | 907.7 | 620 | 601 | 152.6 |
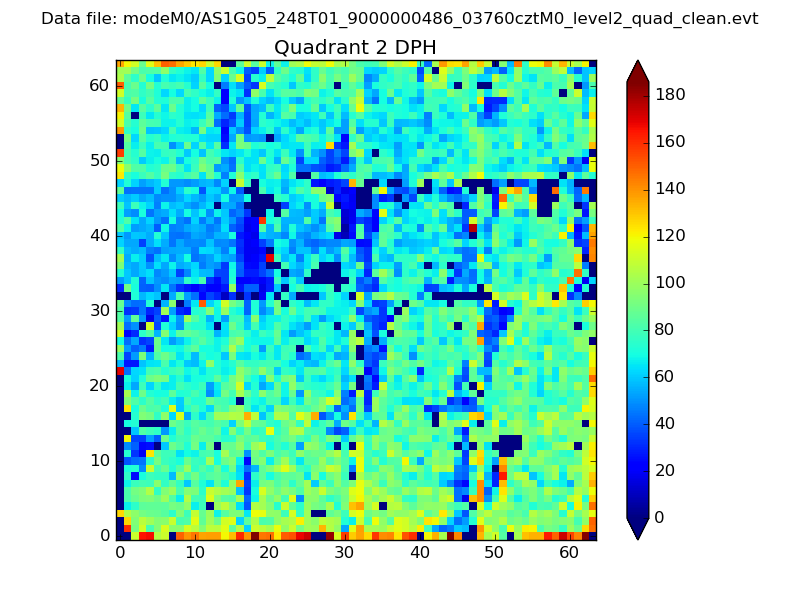
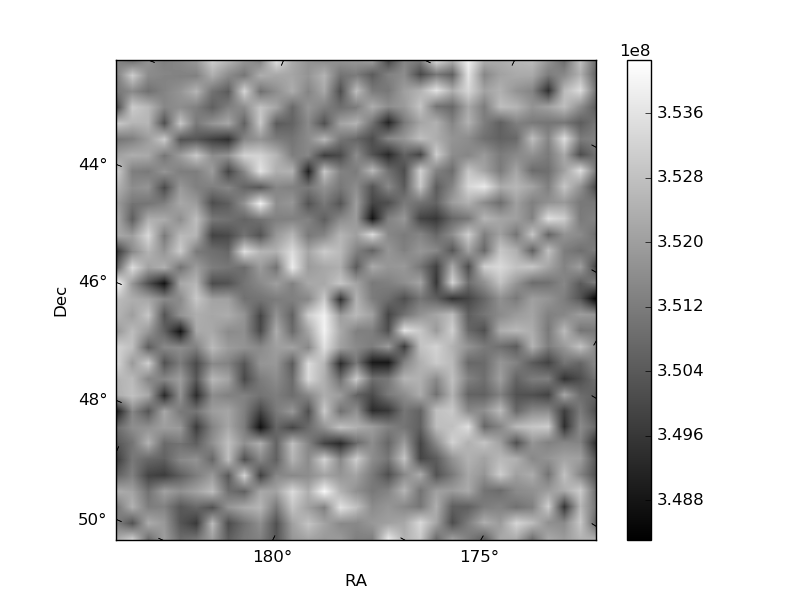
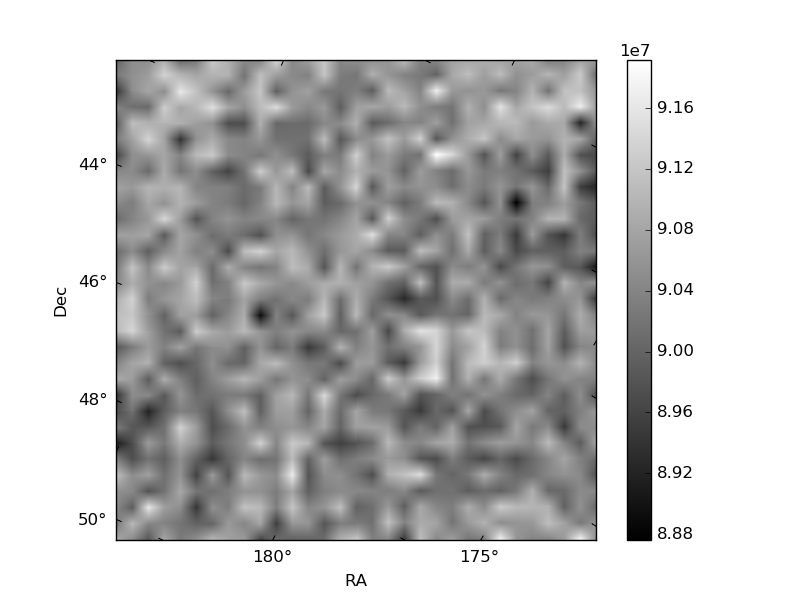
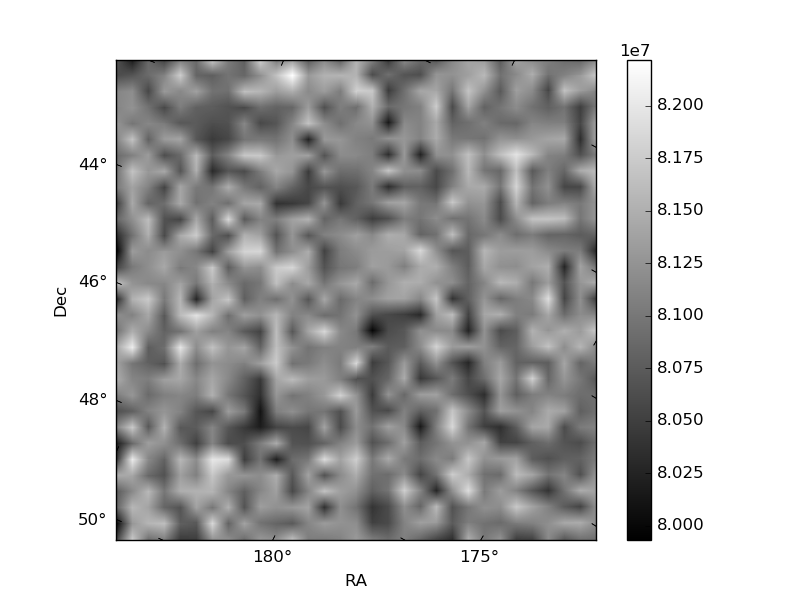
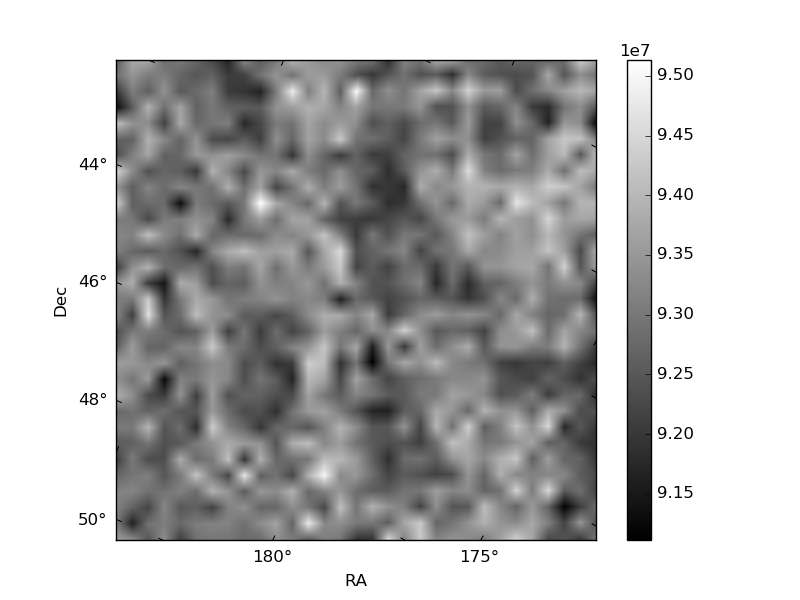
Histogram calculated using DETX and DETY for each event in the final _common_clean file
| Quadrant A | 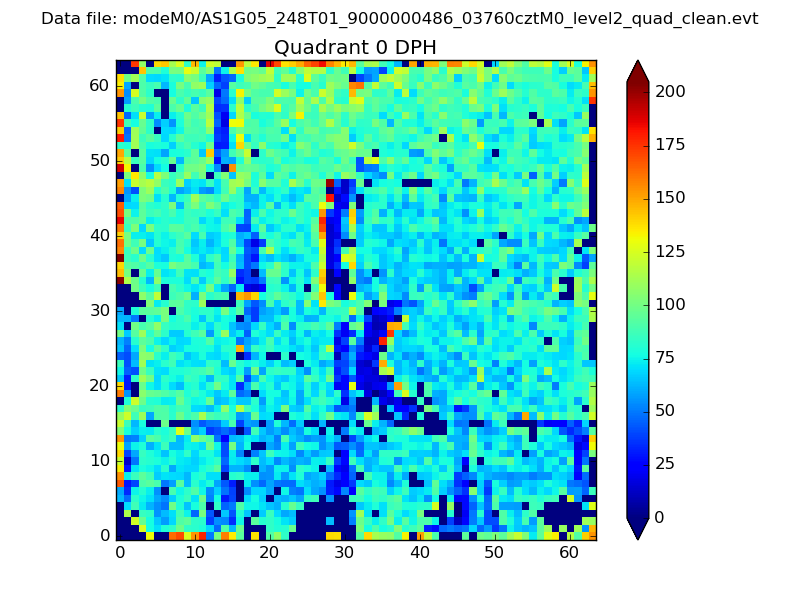 |
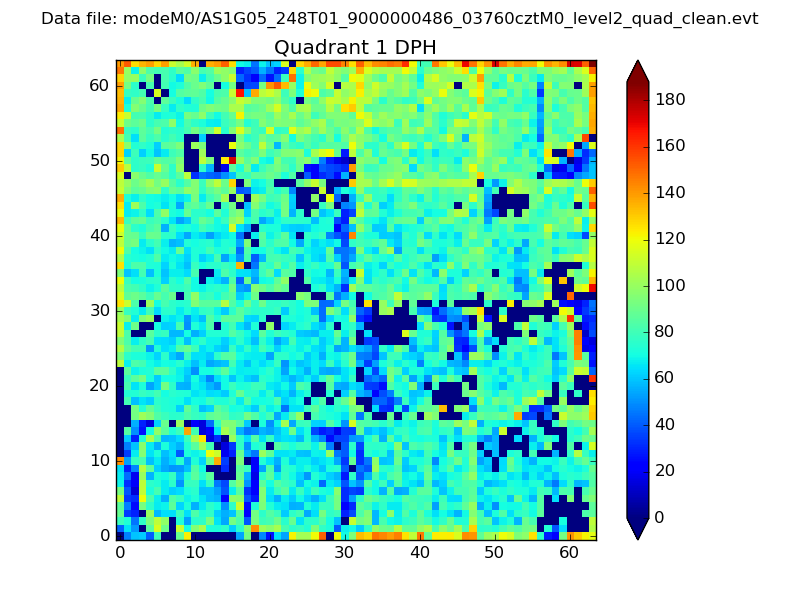 |
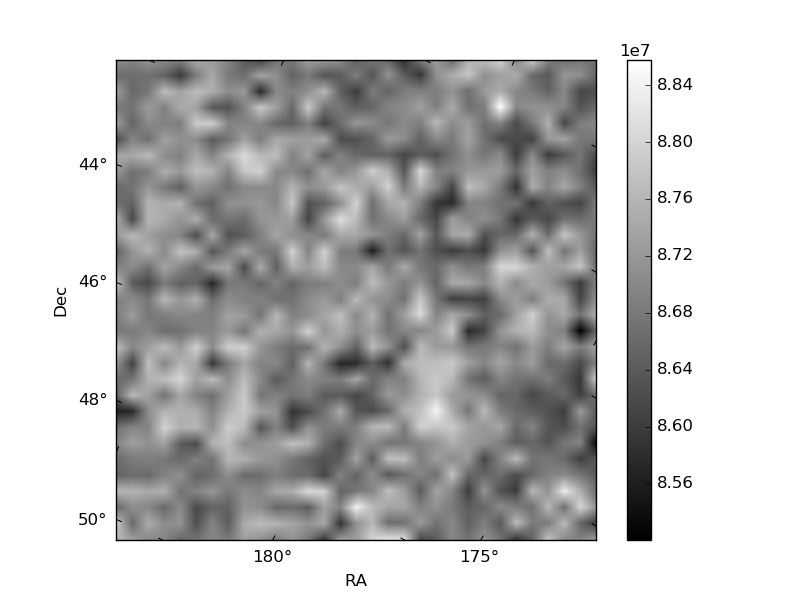
Quadrant B |
|---|---|---|---|
| Quadrant D | 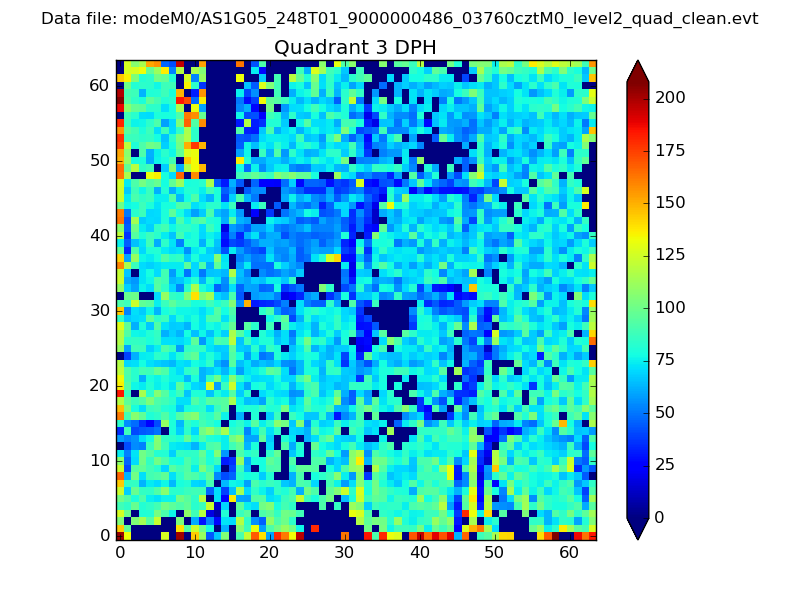 |
 |
Quadrant C |
| Plot type | Count rate plots | Images |
|---|---|---|
| Comparison with Poisson distribution Blue bars denote a histogram of data divided into 1 sec bins. Red curve is a Poisson curve with rate = median count rate of data. |
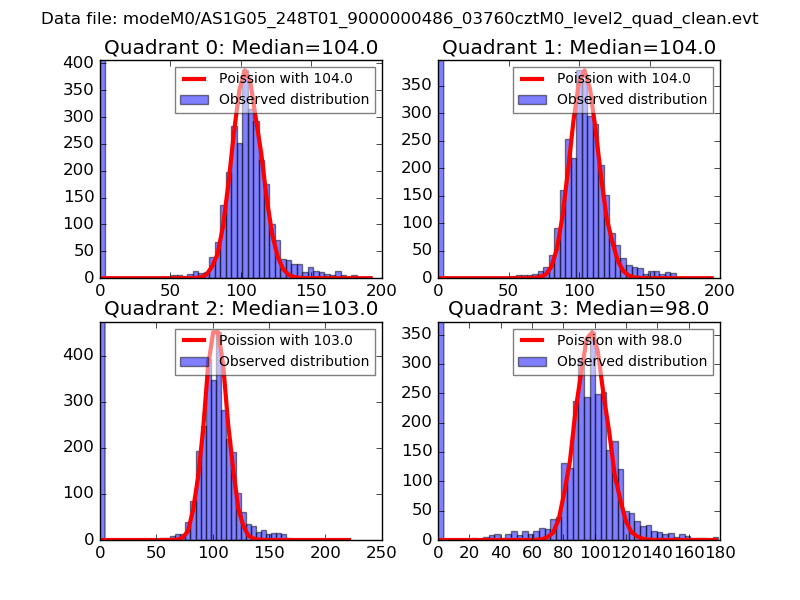 |
 |
| Quadrant-wise count rates Data is divided into 100 sec bins |
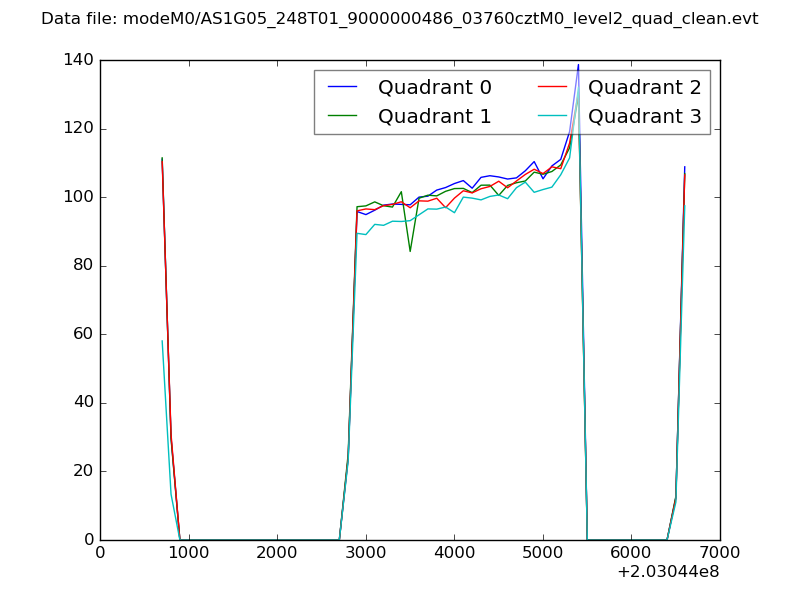 |
|
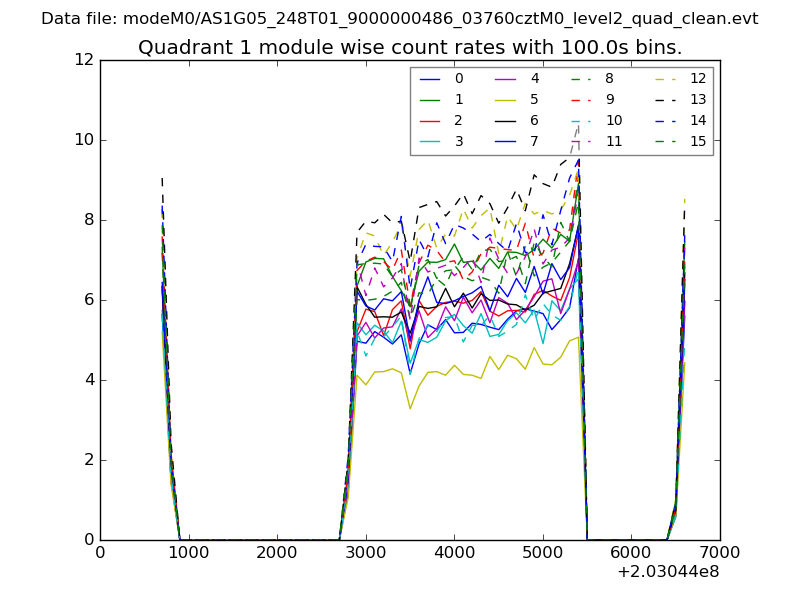
| Module-wise count rates for Quadrant A Data is divided into 100 sec bins |
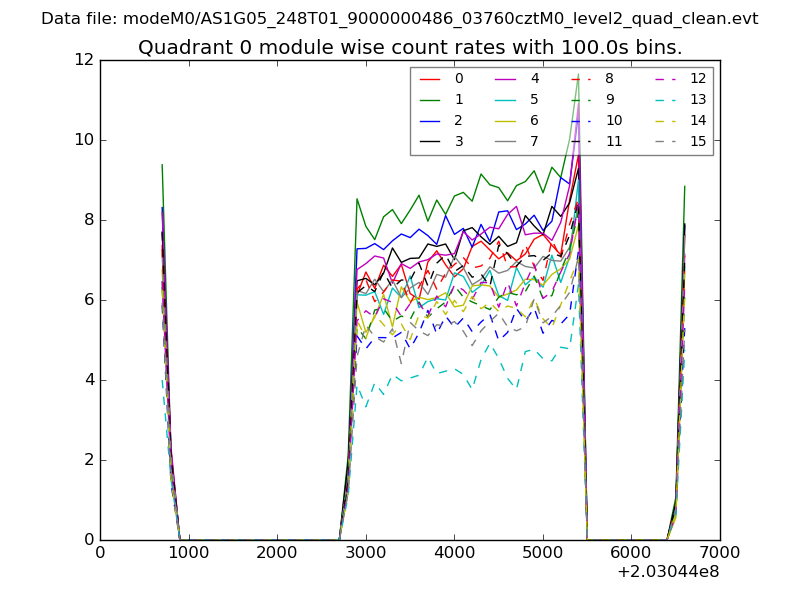 |
 |
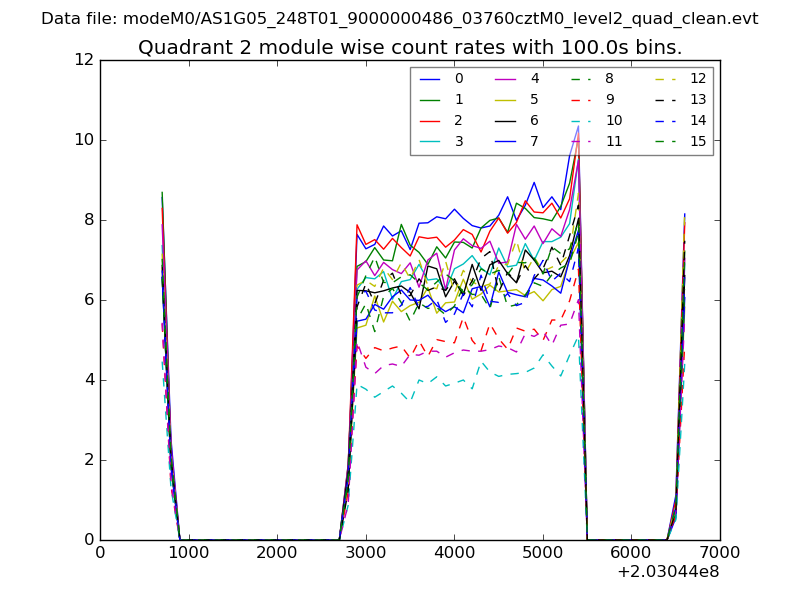
| Module-wise count rates for Quadrant B Data is divided into 100 sec bins |
 |
 |
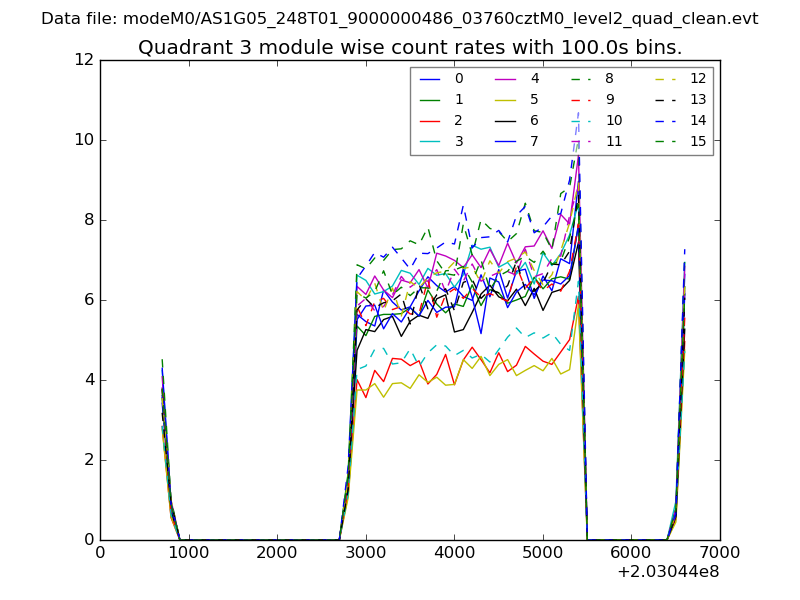
| Module-wise count rates for Quadrant C Data is divided into 100 sec bins |
 |
 |
| Module-wise count rates for Quadrant D Data is divided into 100 sec bins |
 |
 |
| Parameter | Plot |
|---|---|
| CZT HV Monitor | 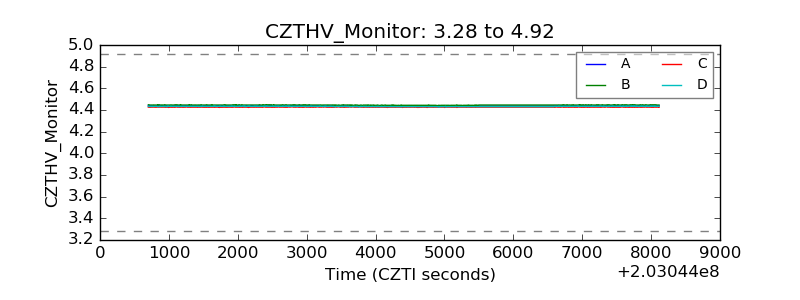 |
| D_VDD | 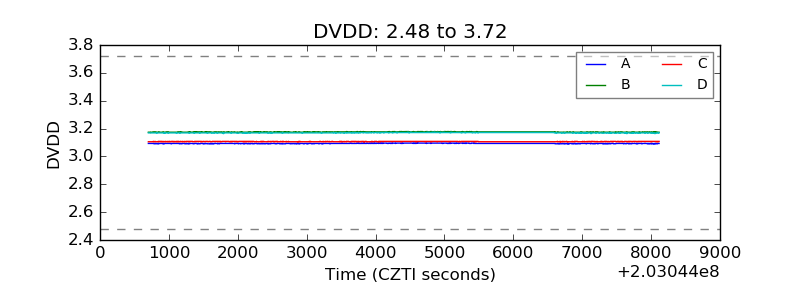 |
| Temperature 1 | 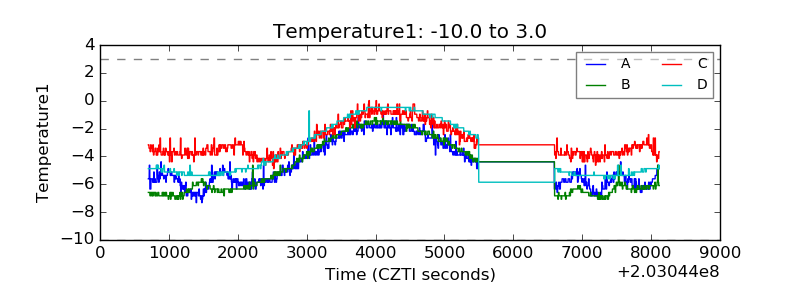 |
| Veto HV Monitor | 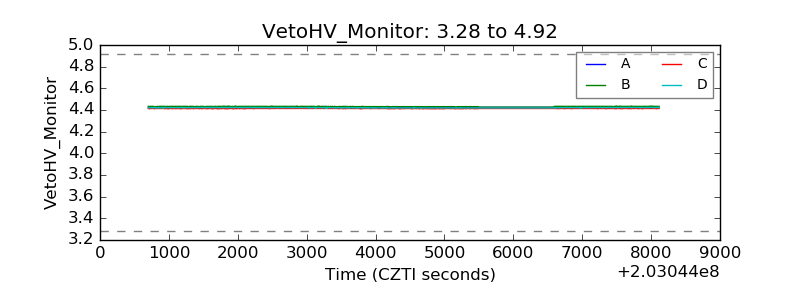 |
| Veto LLD | 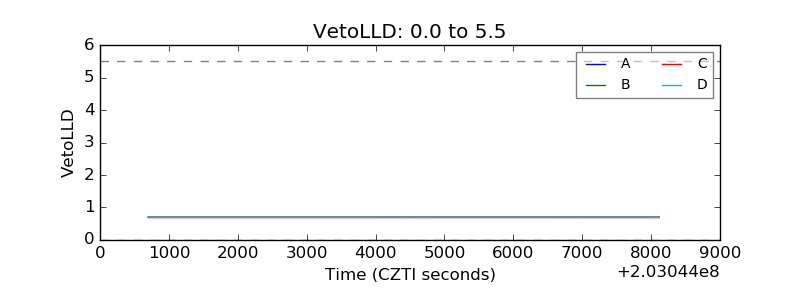 |
| Alpha Counter |  |
| _CPM_Rate |  |
| CZT Counter | 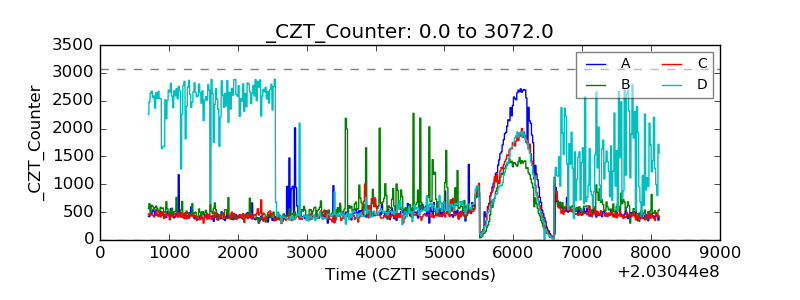 |
| +2.5 Volts monitor | 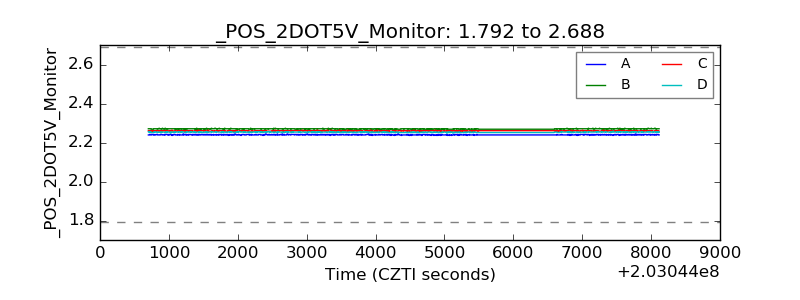 |
| +5 Volts monitor |  |
| Veto Counter | 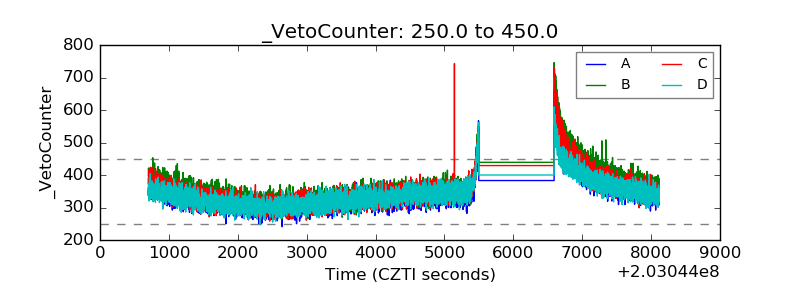 |