| Param | Original file | Final file |
|---|---|---|
| Filename | modeM0/AS1G05_248T01_9000000486_03761cztM0_level2.evt | modeM0/AS1G05_248T01_9000000486_03761cztM0_level2_quad_clean.evt |
| Size (bytes) | 679,550,400 | 53,709,120 |
| Size | 648.1 MB | 51.2 MB |
| Events in quadrant A | 3,581,575 | 322,858 |
| Events in quadrant B | 4,072,861 | 322,262 |
| Events in quadrant C | 3,007,372 | 319,919 |
| Events in quadrant D | 9,474,142 | 201,860 |
| Mode SS | |||
|---|---|---|---|
| Quadrant | BADHDUFLAG | Total packets | Discarded packets |
| A | 0 | 134 | 0 |
| B | 0 | 134 | 0 |
| C | 0 | 134 | 0 |
| D | 0 | 134 | 0 |
| Mode M9 | |||
|---|---|---|---|
| Quadrant | BADHDUFLAG | Total packets | Discarded packets |
| A | 0 | 12 | 0 |
| B | 0 | 12 | 0 |
| C | 0 | 12 | 0 |
| D | 0 | 12 | 0 |
| Mode M0 | |||
|---|---|---|---|
| Quadrant | BADHDUFLAG | Total packets | Discarded packets |
| A | 0 | 14936 | 3 |
| B | 0 | 16491 | 2 |
| C | 0 | 13429 | 2 |
| D | 0 | 32582 | 2 |
| Quadrant | Total seconds | Saturated seconds | Saturation percentage |
|---|---|---|---|
| A | 6567 | 109 | 1.659814% |
| B | 6567 | 109 | 1.659814% |
| C | 6567 | 32 | 0.487285% |
| D | 6568 | 2106 | 32.064555% |
Noise dominated data is calculated using 1-second bins in cleaned event files. If a bin has >2000 counts, and if more than 50% of those come from <1% of pixels, then it is considered to be noise-dominated and hence unusable.
| Quadrant | # 1 sec bins | Bins with >0 counts | Bins with >2000 counts | High rate bins dominated by noise | Noise dominated (total time) | Noise dominated (detector-on time) | Marked lightcurve |
|---|---|---|---|---|---|---|---|
| A | 7757 | 6567 | 35 | 35 | 0.45% | 0.53% | 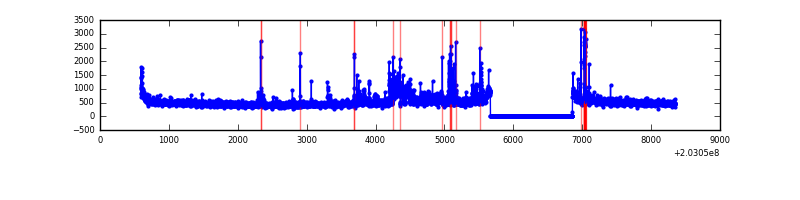 |
| B | 7757 | 6567 | 14 | 14 | 0.18% | 0.21% | 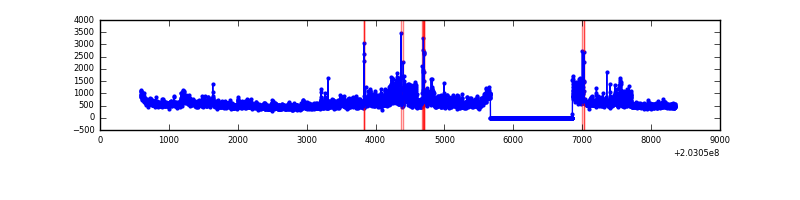 |
| C | 7757 | 6568 | 0 | 0 | 0.00% | 0.00% | 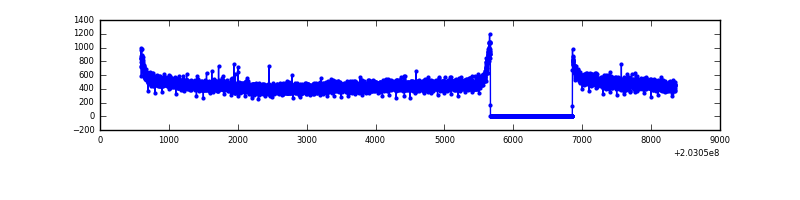 |
| D | 7758 | 6568 | 2068 | 2068 | 26.66% | 31.49% | 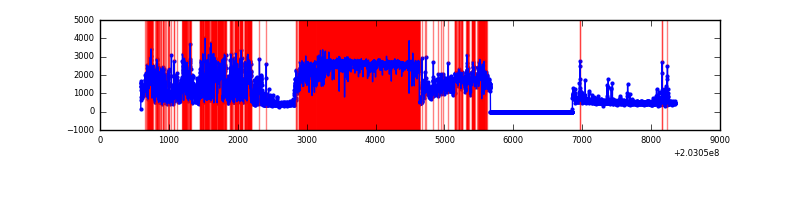 |
Top three noisy pixels from each quadrant. If the there are fewer than three noisy pixels in the level2.evt file, extra rows are filled as -1
| Pixel properties | Quadrant properties | ||||||
|---|---|---|---|---|---|---|---|
| Quadrant | DetID | PixID | Counts | Sigma | Mean | Median | Sigma |
| A | 0 | 118 | 228470 | 1396.39 | 796 | 779 | 163.1 |
| A | 13 | 251 | 123786 | 754.38 | 796 | 779 | 163.1 |
| A | 3 | 1 | 71307 | 432.54 | 796 | 779 | 163.1 |
| B | 15 | 204 | 652173 | 4218.65 | 808 | 788 | 154.4 |
| B | 5 | 70 | 146288 | 942.32 | 808 | 788 | 154.4 |
| B | 5 | 200 | 36433 | 230.85 | 808 | 788 | 154.4 |
| C | 13 | 61 | 6775 | 33.62 | 768 | 772 | 178.5 |
| C | 2 | 53 | 4005 | 18.11 | 768 | 772 | 178.5 |
| C | 14 | 67 | 2446 | 9.38 | 768 | 772 | 178.5 |
| D | 12 | 79 | 5544783 | 33469.39 | 653 | 636 | 165.6 |
| D | 1 | 20 | 1206551 | 7279.97 | 653 | 636 | 165.6 |
| D | 13 | 239 | 104490 | 626.95 | 653 | 636 | 165.6 |
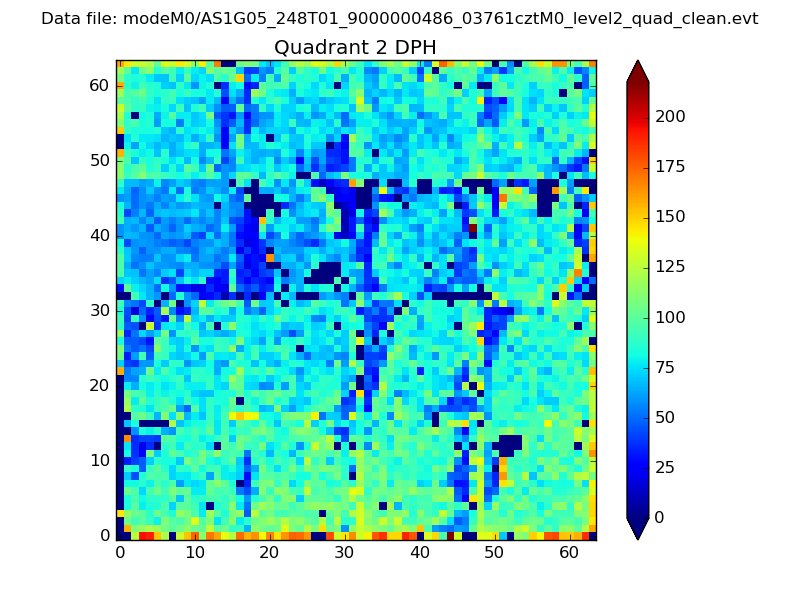
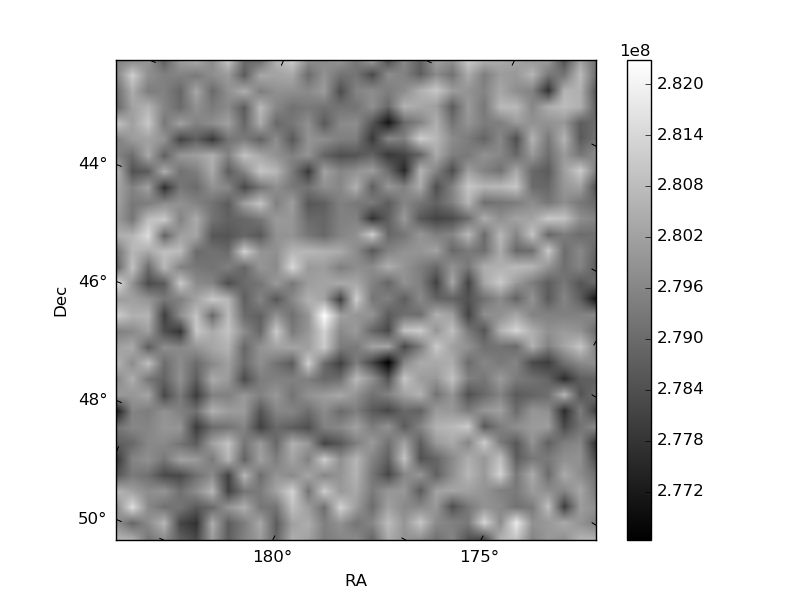
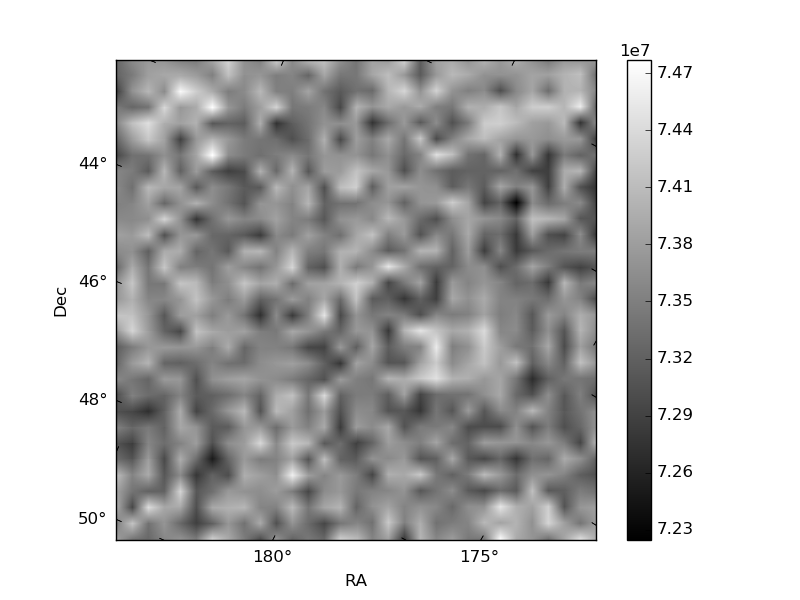
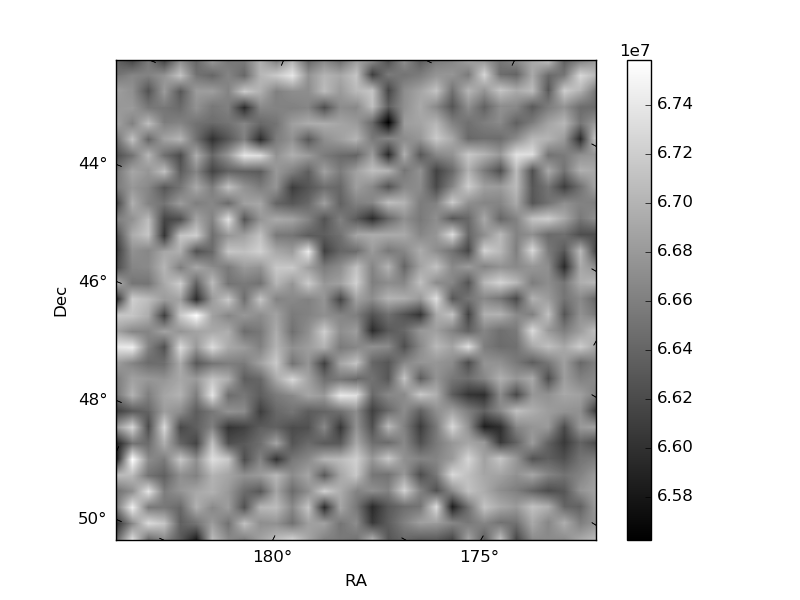
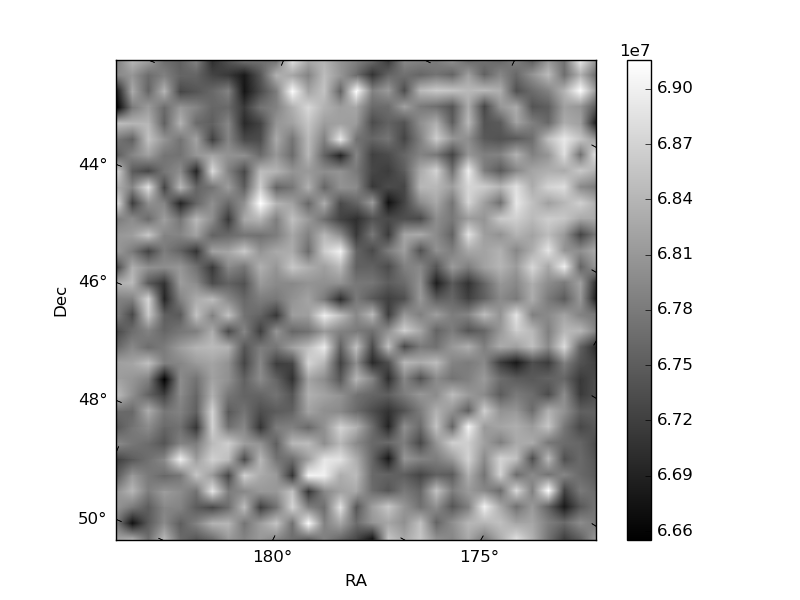
Histogram calculated using DETX and DETY for each event in the final _common_clean file
| Quadrant A | 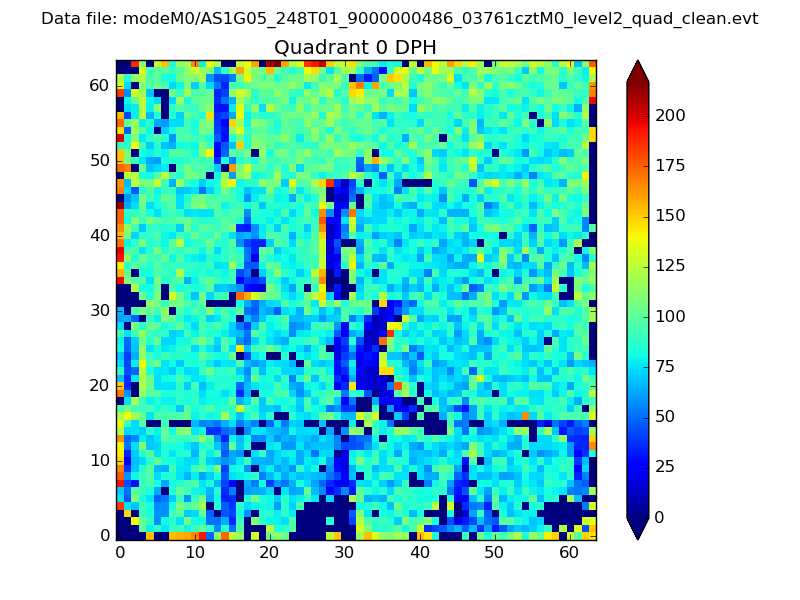 |
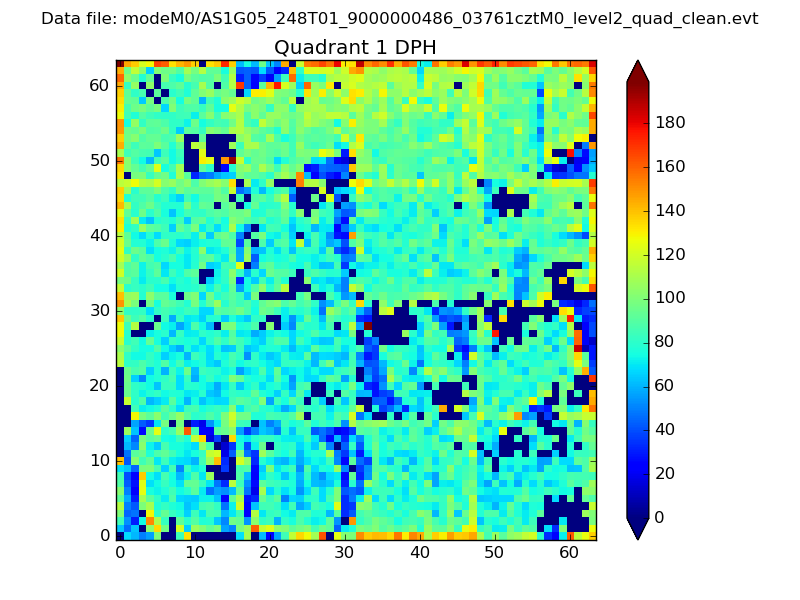 |
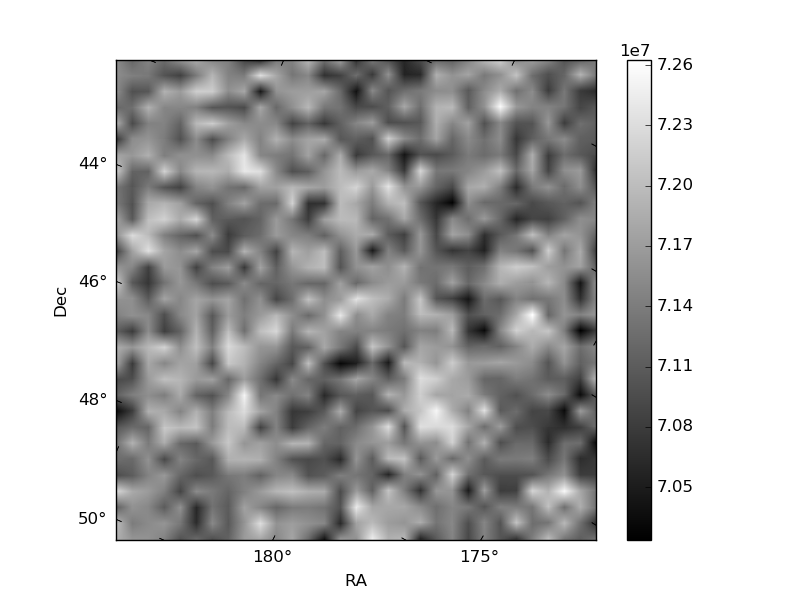
Quadrant B |
|---|---|---|---|
| Quadrant D | 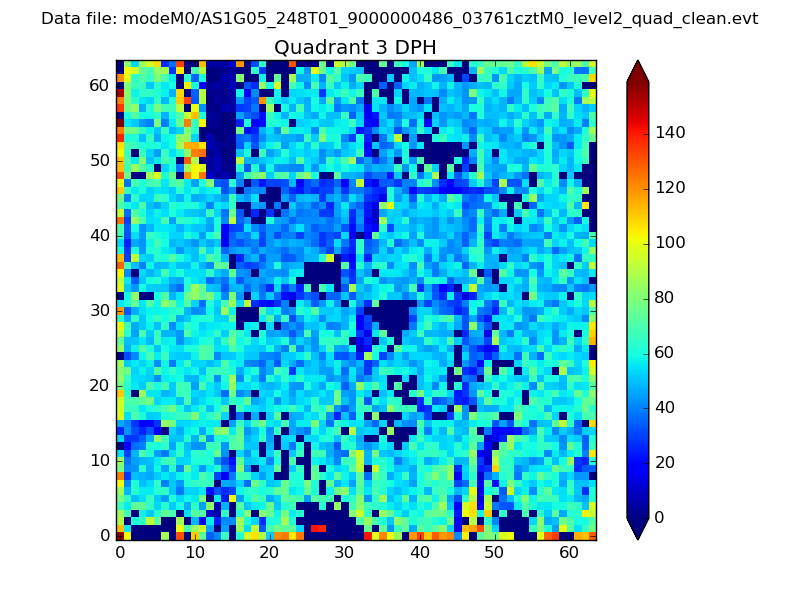 |
 |
Quadrant C |
| Plot type | Count rate plots | Images |
|---|---|---|
| Comparison with Poisson distribution Blue bars denote a histogram of data divided into 1 sec bins. Red curve is a Poisson curve with rate = median count rate of data. |
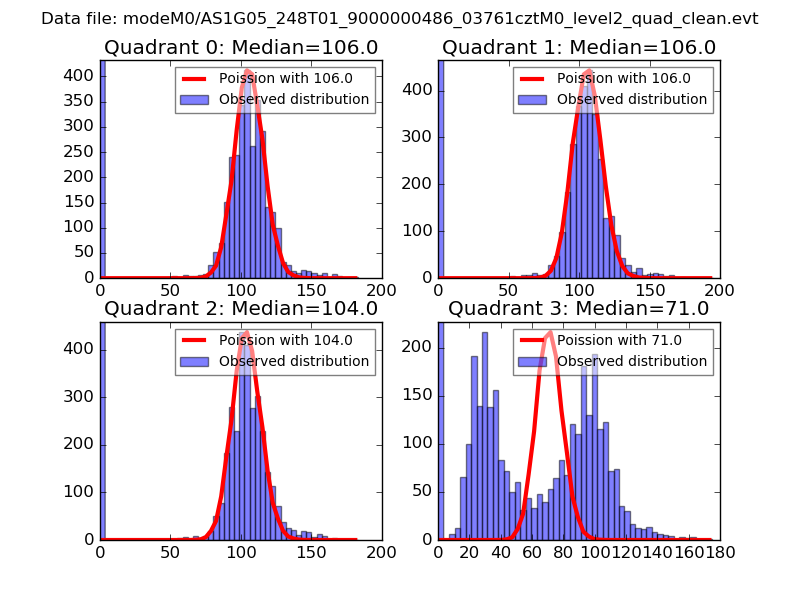 |
 |
| Quadrant-wise count rates Data is divided into 100 sec bins |
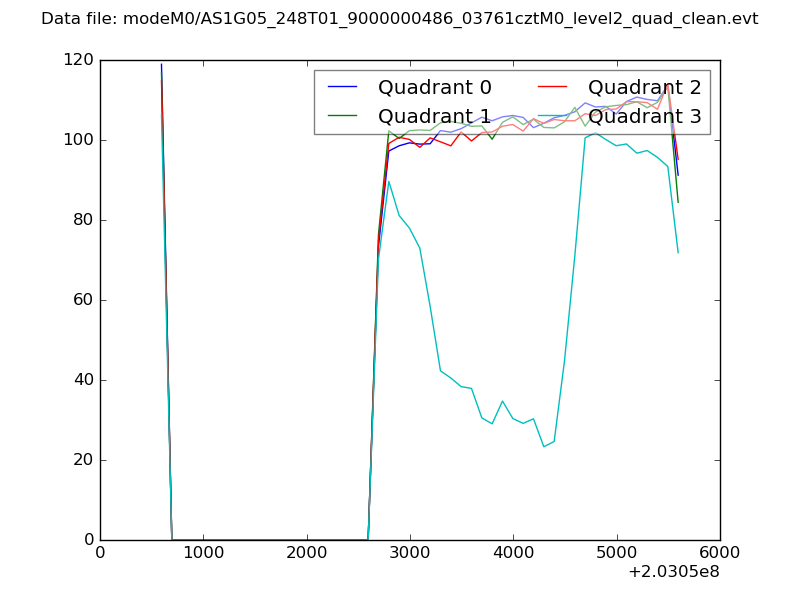 |
|
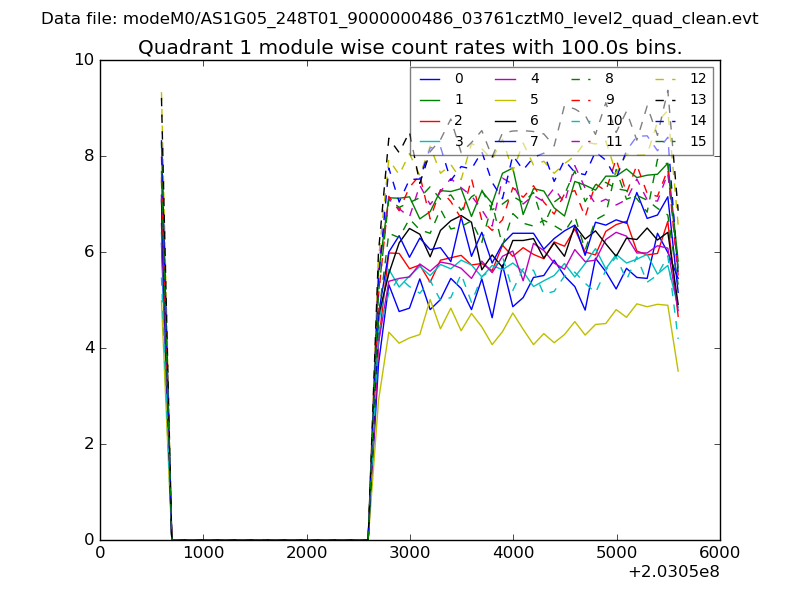
| Module-wise count rates for Quadrant A Data is divided into 100 sec bins |
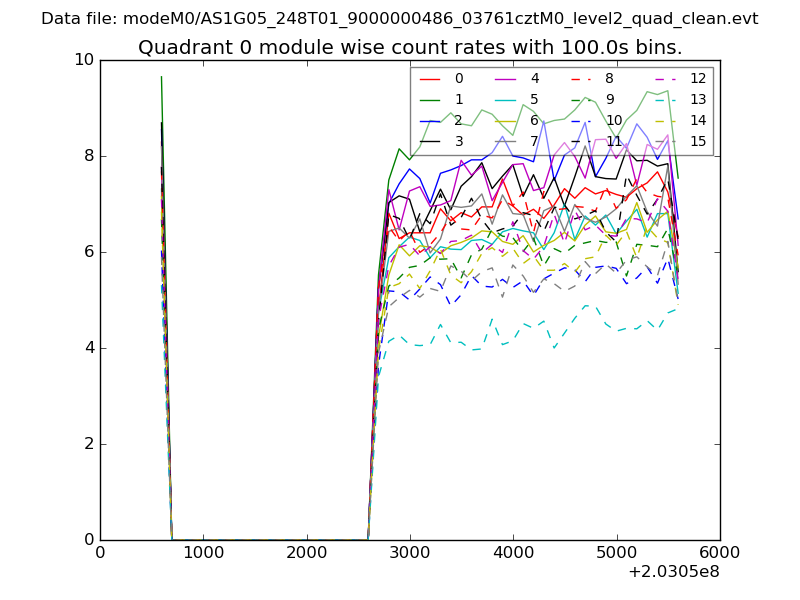 |
 |
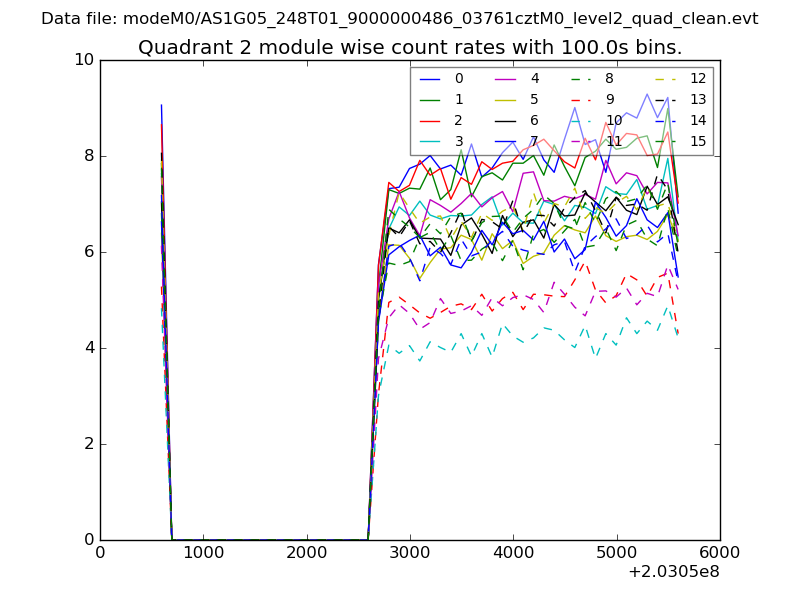
| Module-wise count rates for Quadrant B Data is divided into 100 sec bins |
 |
 |
| Module-wise count rates for Quadrant C Data is divided into 100 sec bins |
 |
 |
| Module-wise count rates for Quadrant D Data is divided into 100 sec bins |
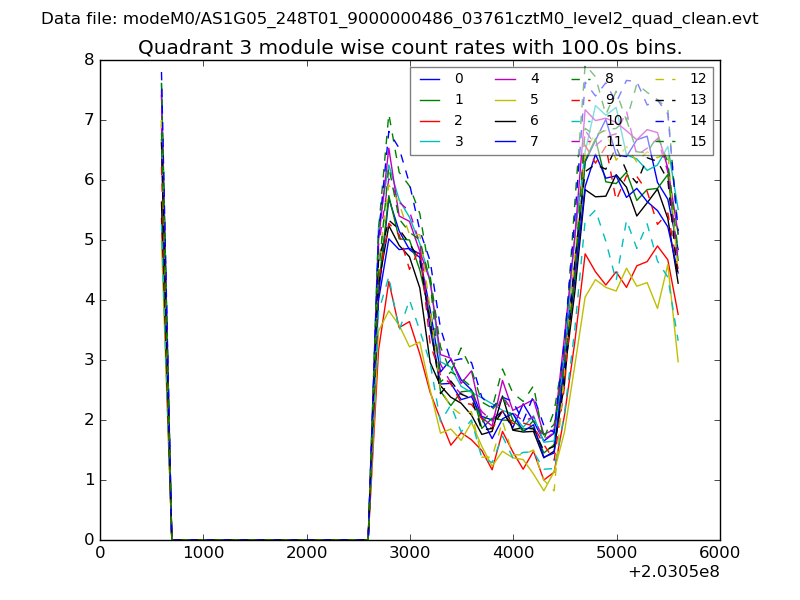 |
 |
| Parameter | Plot |
|---|---|
| CZT HV Monitor | 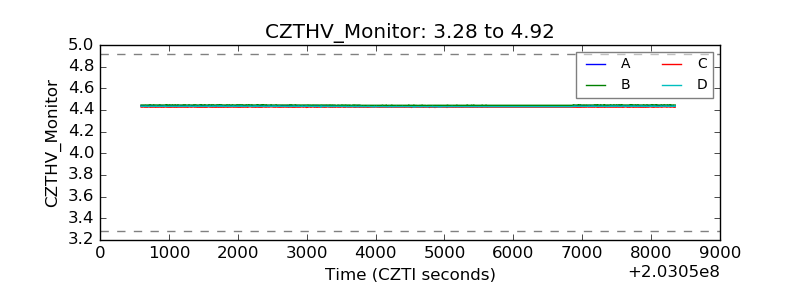 |
| D_VDD | 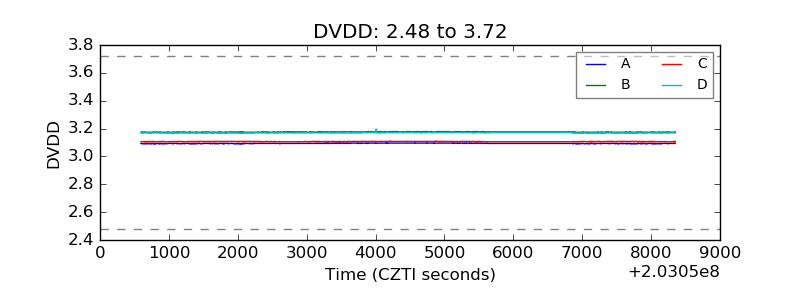 |
| Temperature 1 | 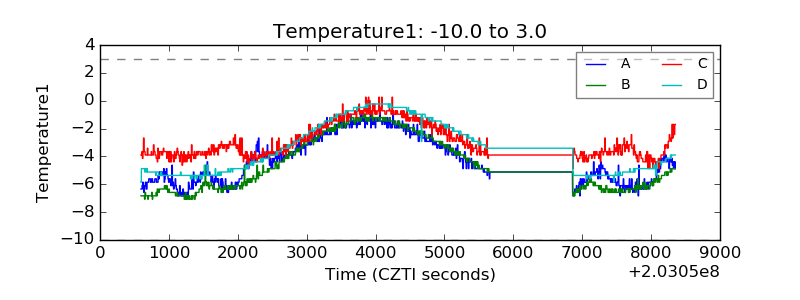 |
| Veto HV Monitor | 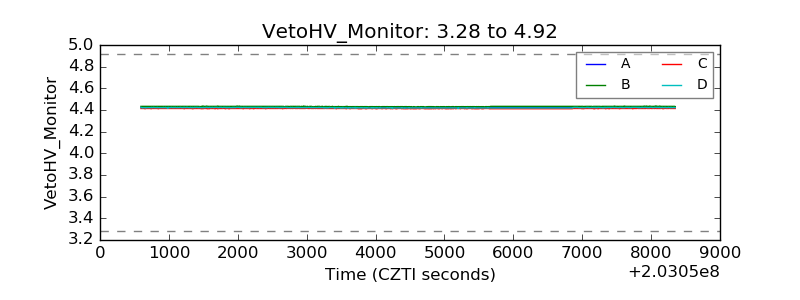 |
| Veto LLD | 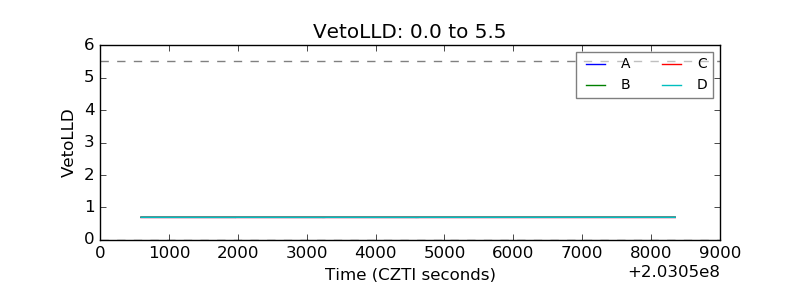 |
| Alpha Counter | 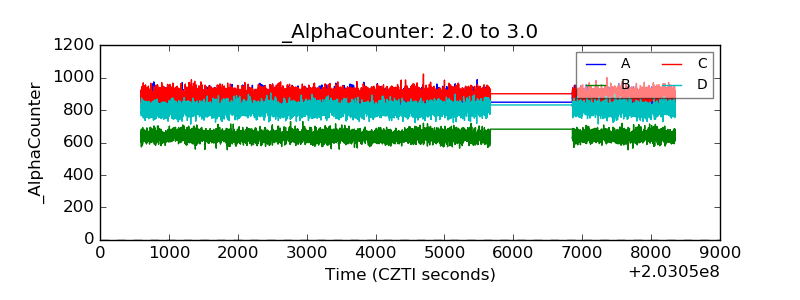 |
| _CPM_Rate | 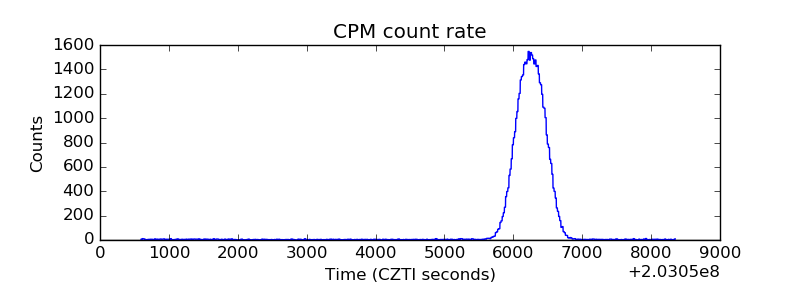 |
| CZT Counter | 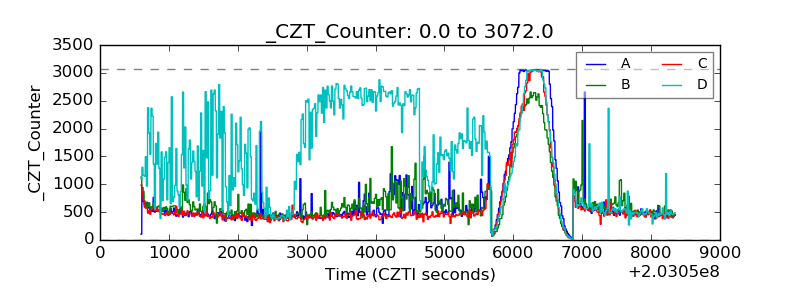 |
| +2.5 Volts monitor |  |
| +5 Volts monitor | 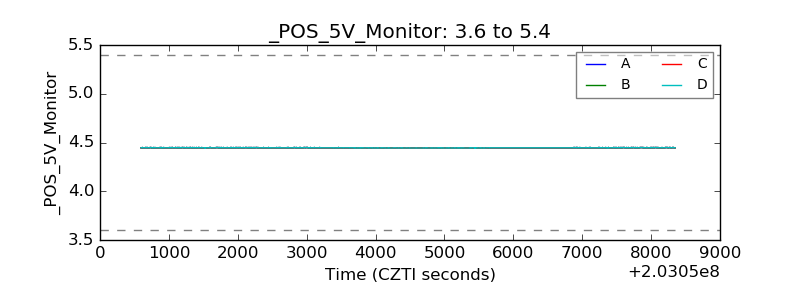 |
| Veto Counter | 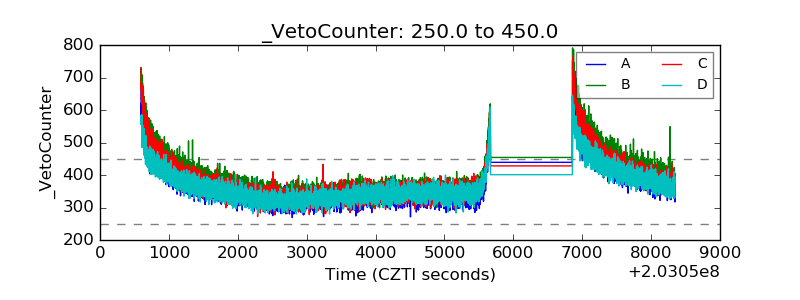 |