| Param | Original file | Final file |
|---|---|---|
| Filename | modeM0/AS1G05_248T01_9000000486_03762cztM0_level2.evt | modeM0/AS1G05_248T01_9000000486_03762cztM0_level2_quad_clean.evt |
| Size (bytes) | 535,440,960 | 61,637,760 |
| Size | 510.6 MB | 58.8 MB |
| Events in quadrant A | 3,788,399 | 359,624 |
| Events in quadrant B | 4,159,706 | 364,574 |
| Events in quadrant C | 3,003,659 | 359,228 |
| Events in quadrant D | 4,832,635 | 338,237 |
| Mode SS | |||
|---|---|---|---|
| Quadrant | BADHDUFLAG | Total packets | Discarded packets |
| A | 0 | 130 | 0 |
| B | 0 | 130 | 0 |
| C | 0 | 130 | 0 |
| D | 0 | 130 | 0 |
| Mode M9 | |||
|---|---|---|---|
| Quadrant | BADHDUFLAG | Total packets | Discarded packets |
| A | 0 | 20 | 0 |
| B | 0 | 20 | 0 |
| C | 0 | 20 | 0 |
| D | 0 | 21 | 0 |
| Mode M0 | |||
|---|---|---|---|
| Quadrant | BADHDUFLAG | Total packets | Discarded packets |
| A | 0 | 15141 | 3 |
| B | 0 | 16528 | 2 |
| C | 0 | 13112 | 2 |
| D | 0 | 18454 | 2 |
| Quadrant | Total seconds | Saturated seconds | Saturation percentage |
|---|---|---|---|
| A | 6365 | 214 | 3.362137% |
| B | 6365 | 211 | 3.315004% |
| C | 6365 | 45 | 0.706991% |
| D | 6365 | 180 | 2.827965% |
Noise dominated data is calculated using 1-second bins in cleaned event files. If a bin has >2000 counts, and if more than 50% of those come from <1% of pixels, then it is considered to be noise-dominated and hence unusable.
| Quadrant | # 1 sec bins | Bins with >0 counts | Bins with >2000 counts | High rate bins dominated by noise | Noise dominated (total time) | Noise dominated (detector-on time) | Marked lightcurve |
|---|---|---|---|---|---|---|---|
| A | 7610 | 6365 | 104 | 104 | 1.37% | 1.63% | 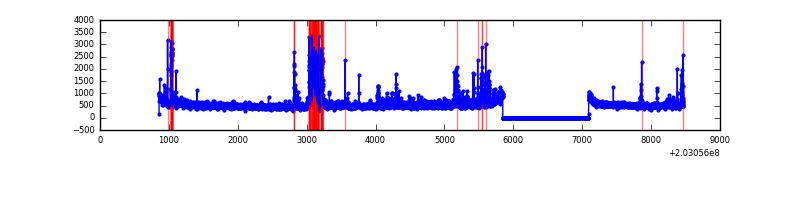 |
| B | 7610 | 6365 | 86 | 86 | 1.13% | 1.35% | 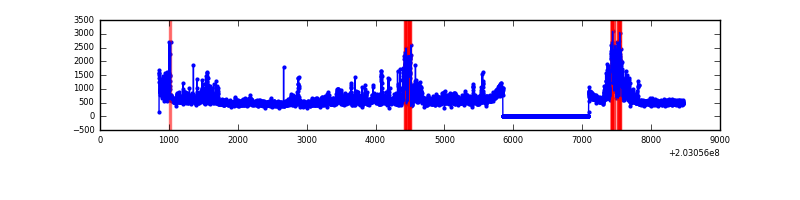 |
| C | 7610 | 6366 | 0 | 0 | 0.00% | 0.00% | 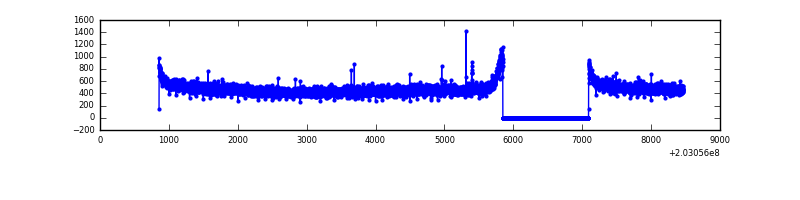 |
| D | 7610 | 6365 | 102 | 102 | 1.34% | 1.60% | 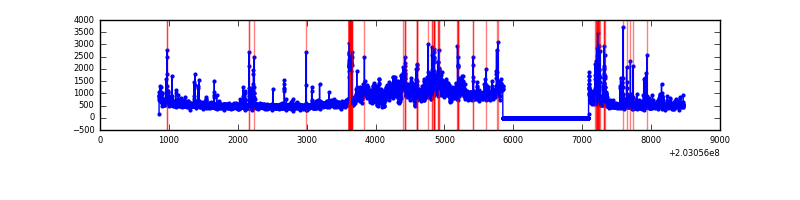 |
Top three noisy pixels from each quadrant. If the there are fewer than three noisy pixels in the level2.evt file, extra rows are filled as -1
| Pixel properties | Quadrant properties | ||||||
|---|---|---|---|---|---|---|---|
| Quadrant | DetID | PixID | Counts | Sigma | Mean | Median | Sigma |
| A | 0 | 118 | 352818 | 2192.94 | 794 | 778 | 160.5 |
| A | 3 | 1 | 191080 | 1185.43 | 794 | 778 | 160.5 |
| A | 13 | 251 | 112059 | 693.19 | 794 | 778 | 160.5 |
| B | 5 | 70 | 413560 | 2713.71 | 804 | 787 | 152.1 |
| B | 15 | 204 | 381792 | 2504.86 | 804 | 787 | 152.1 |
| B | 0 | 244 | 138248 | 903.72 | 804 | 787 | 152.1 |
| C | 13 | 61 | 6579 | 32.52 | 766 | 770 | 178.6 |
| C | 7 | 221 | 3855 | 17.27 | 766 | 770 | 178.6 |
| C | 1 | 16 | 2261 | 8.35 | 766 | 770 | 178.6 |
| D | 1 | 20 | 1485503 | 7746.89 | 757 | 739 | 191.7 |
| D | 8 | 112 | 124652 | 646.53 | 757 | 739 | 191.7 |
| D | 13 | 239 | 107982 | 559.55 | 757 | 739 | 191.7 |
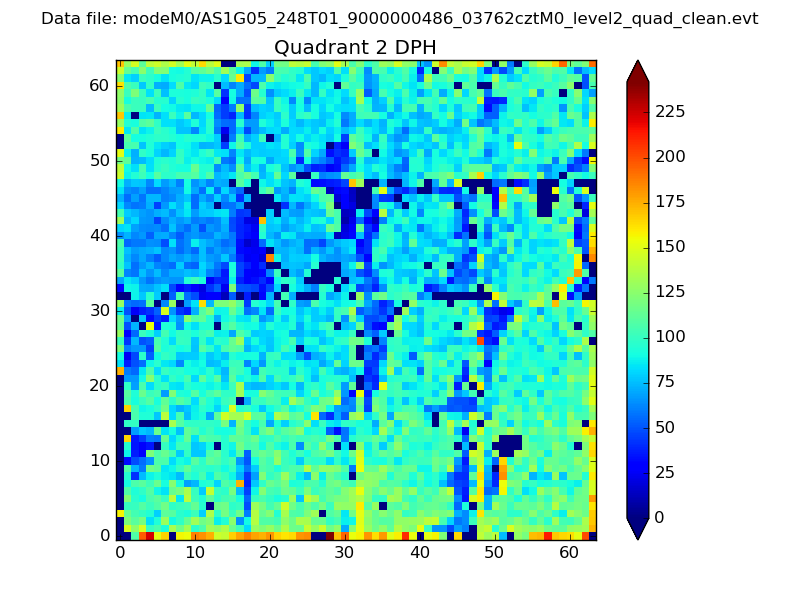
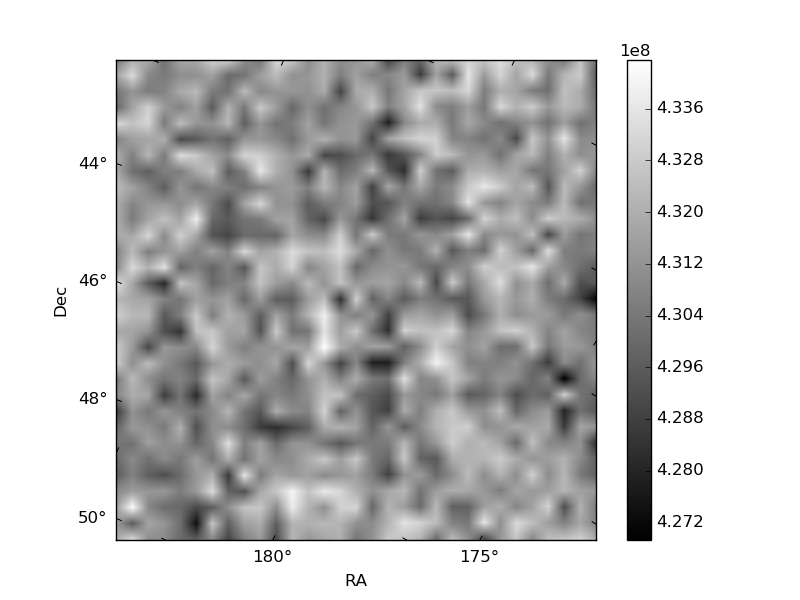
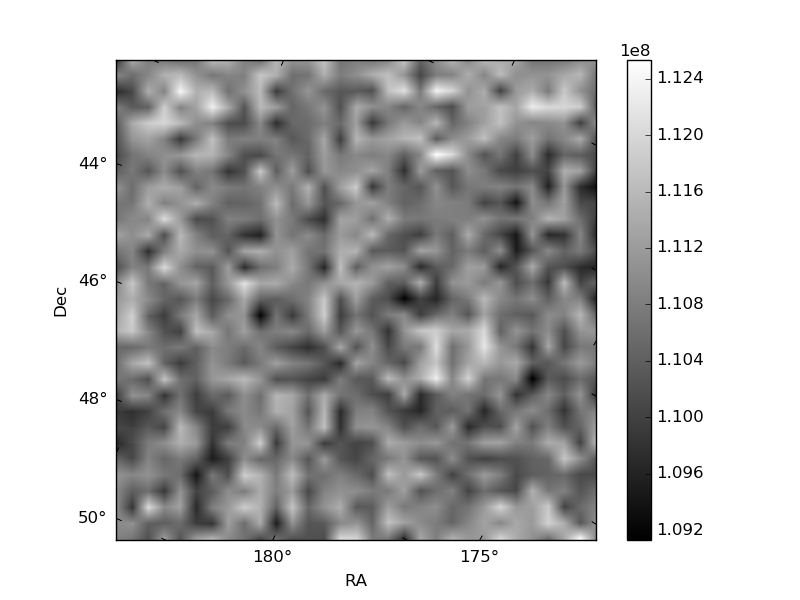
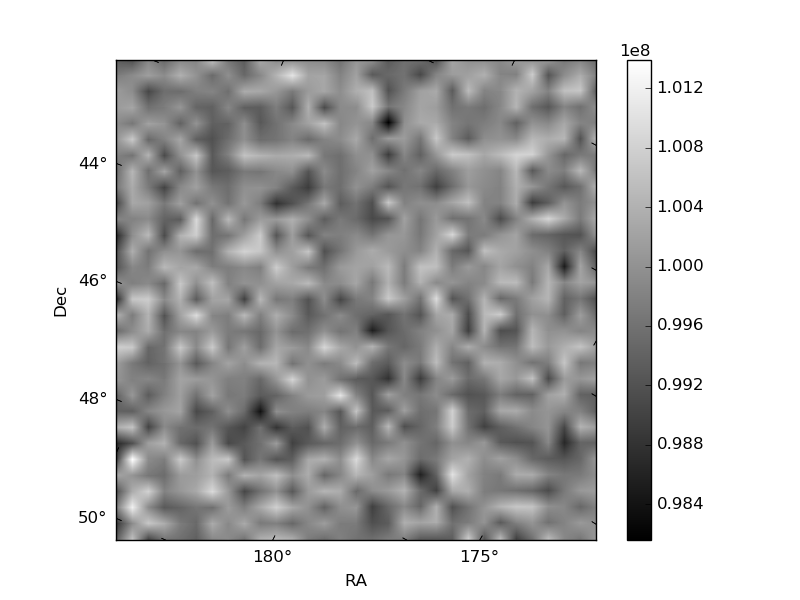
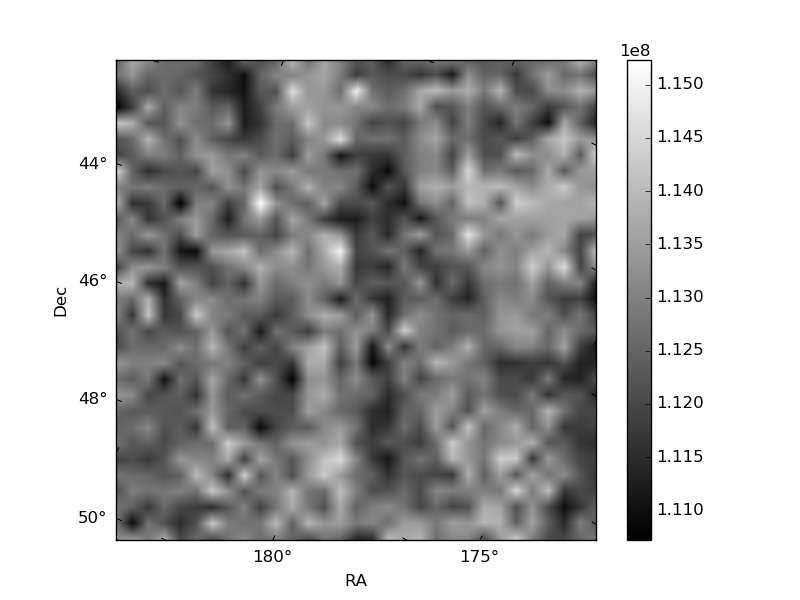
Histogram calculated using DETX and DETY for each event in the final _common_clean file
| Quadrant A | 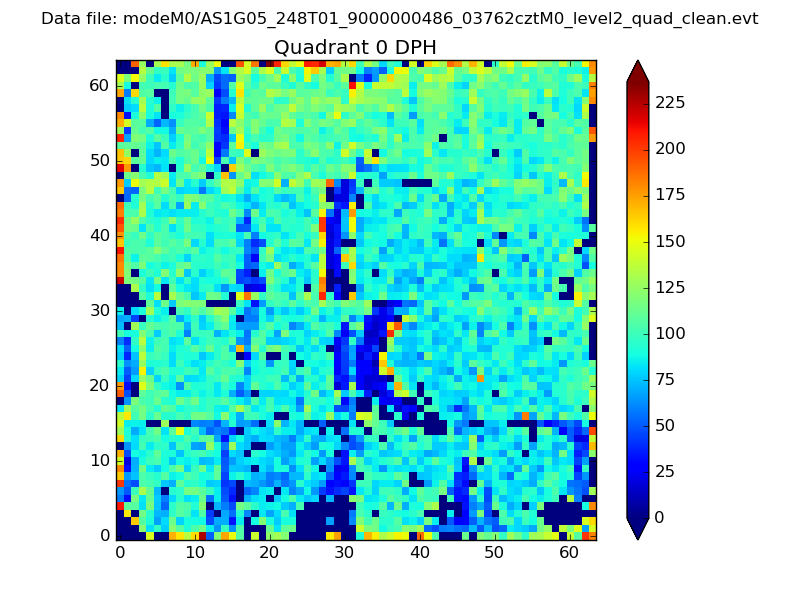 |
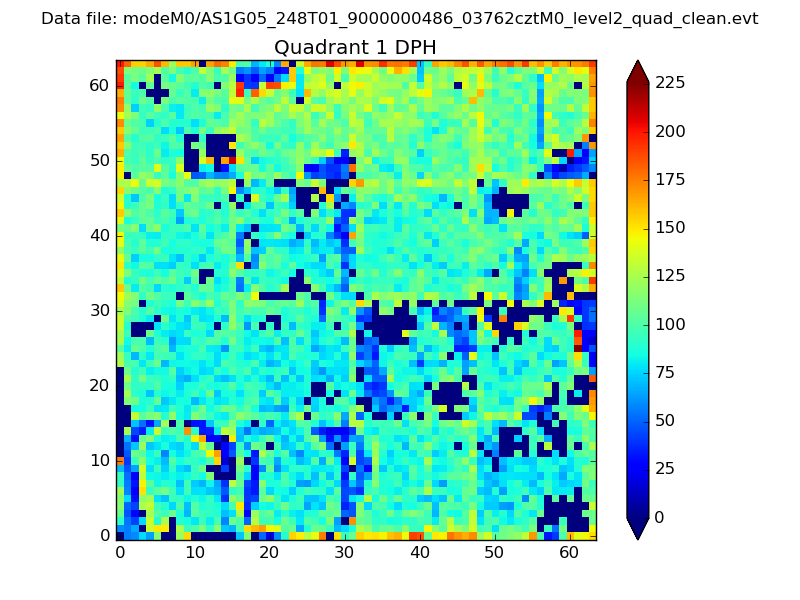 |
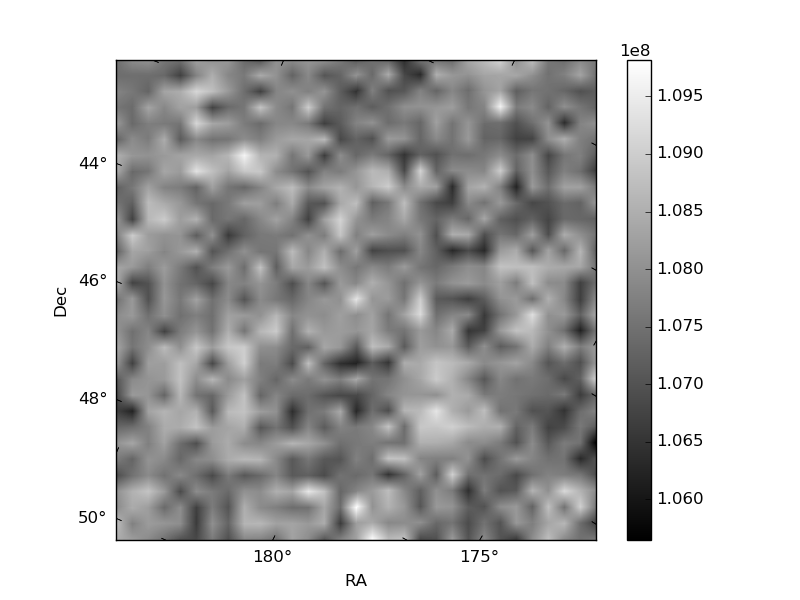
Quadrant B |
|---|---|---|---|
| Quadrant D | 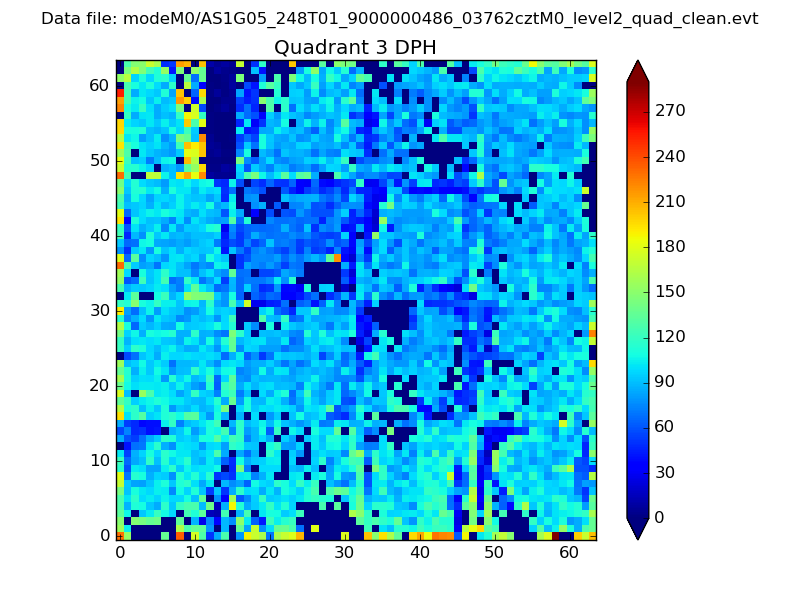 |
 |
Quadrant C |
| Plot type | Count rate plots | Images |
|---|---|---|
| Comparison with Poisson distribution Blue bars denote a histogram of data divided into 1 sec bins. Red curve is a Poisson curve with rate = median count rate of data. |
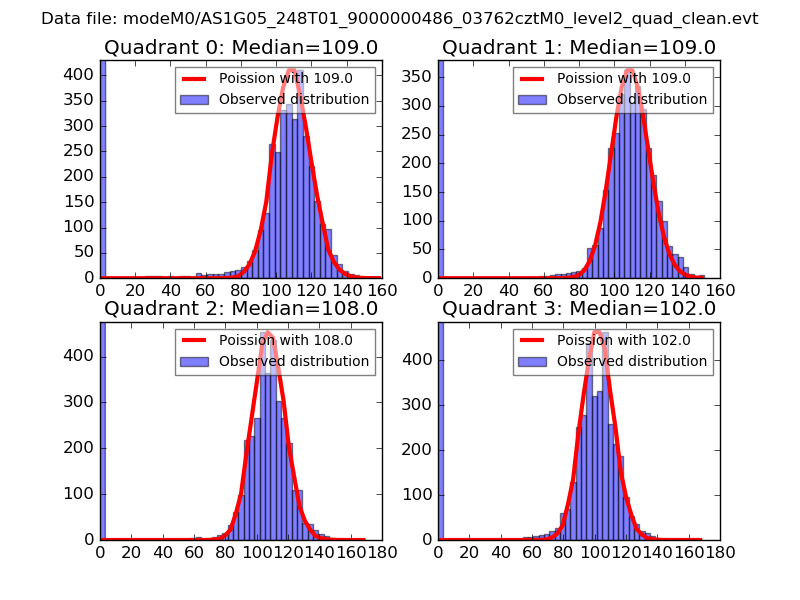 |
 |
| Quadrant-wise count rates Data is divided into 100 sec bins |
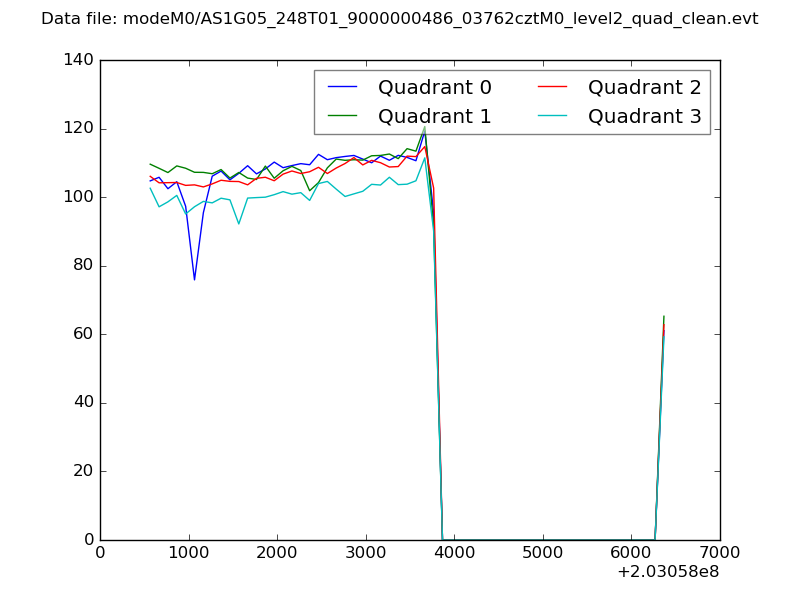 |
|
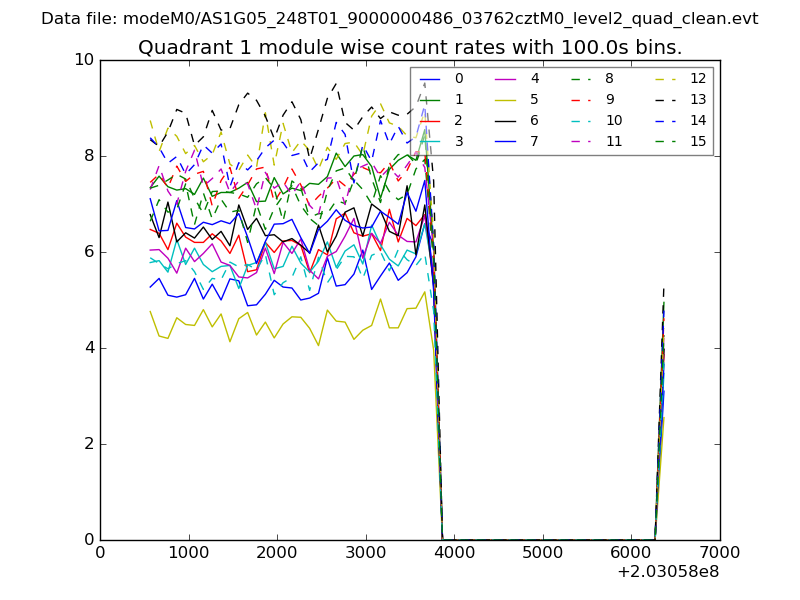
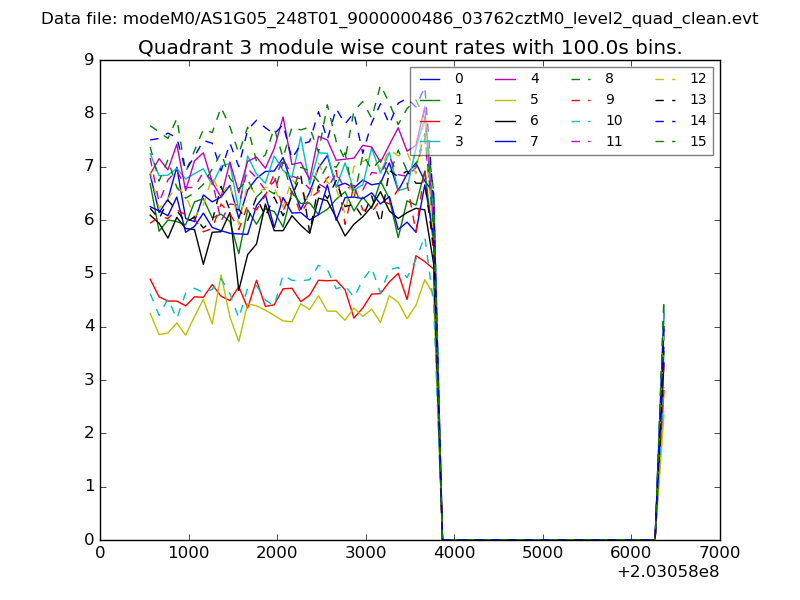
| Module-wise count rates for Quadrant A Data is divided into 100 sec bins |
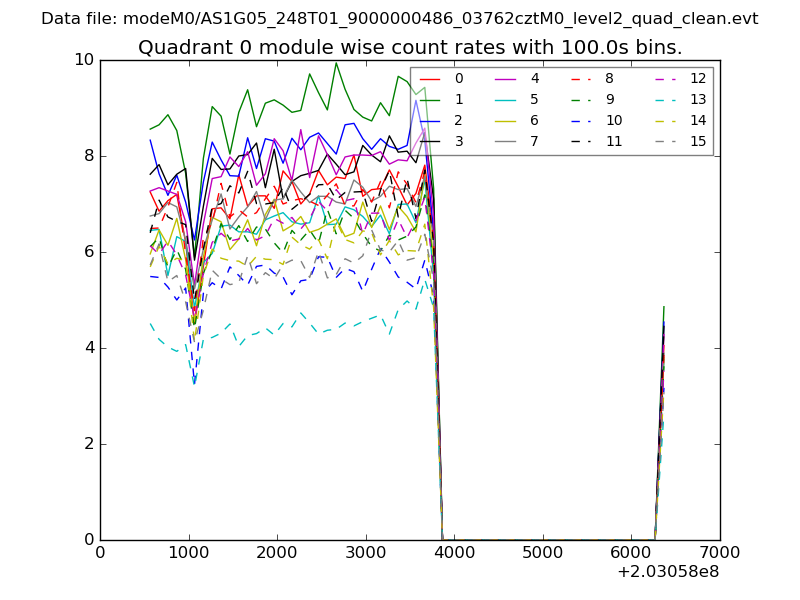 |
 |
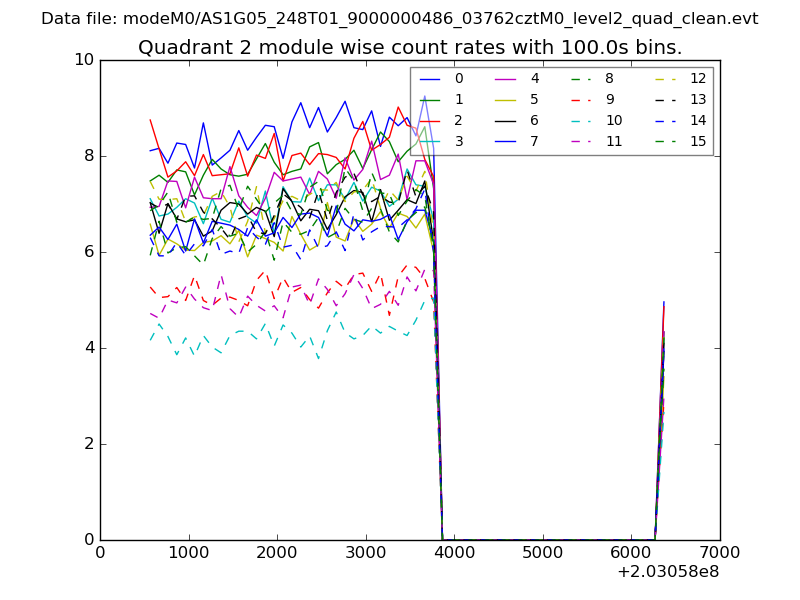
| Module-wise count rates for Quadrant B Data is divided into 100 sec bins |
 |
 |
| Module-wise count rates for Quadrant C Data is divided into 100 sec bins |
 |
 |
| Module-wise count rates for Quadrant D Data is divided into 100 sec bins |
 |
 |
| Parameter | Plot |
|---|---|
| CZT HV Monitor | 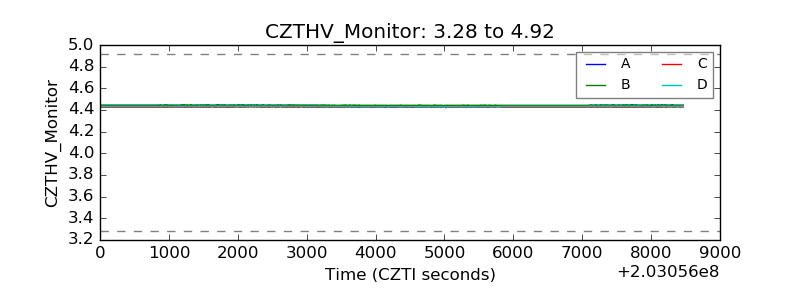 |
| D_VDD | 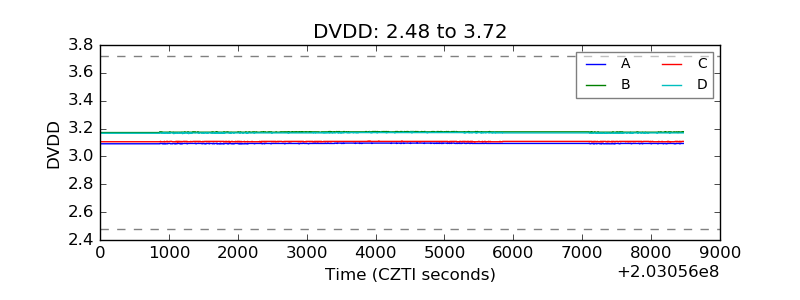 |
| Temperature 1 | 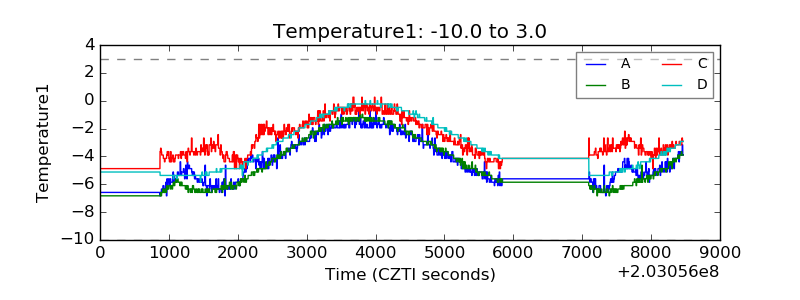 |
| Veto HV Monitor | 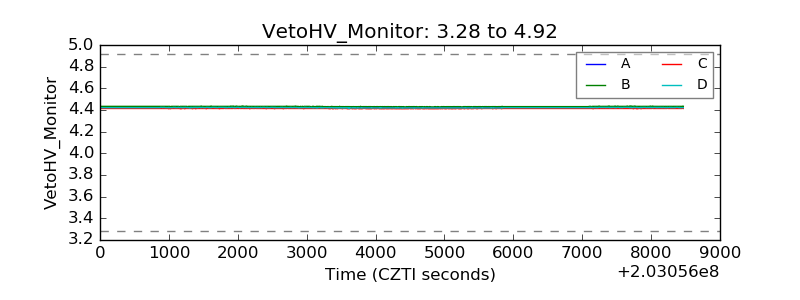 |
| Veto LLD | 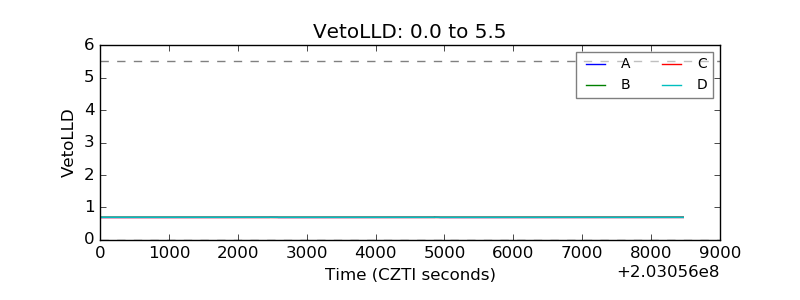 |
| Alpha Counter |  |
| _CPM_Rate | 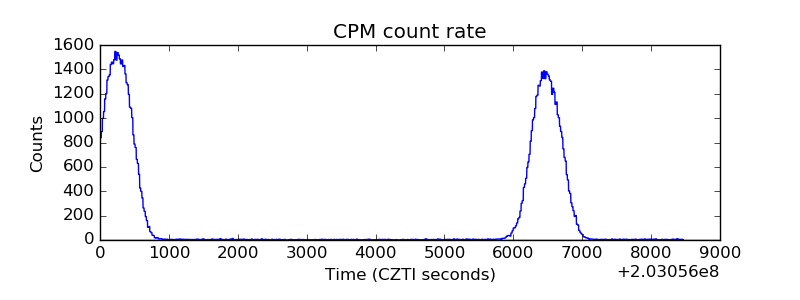 |
| CZT Counter | 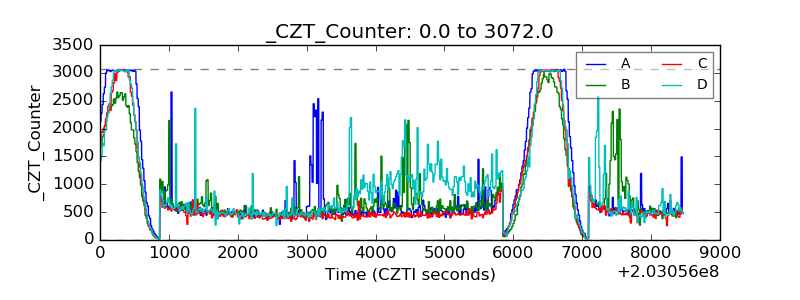 |
| +2.5 Volts monitor | 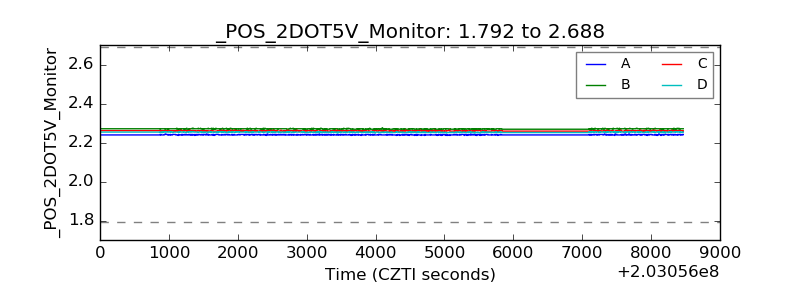 |
| +5 Volts monitor |  |
| Veto Counter | 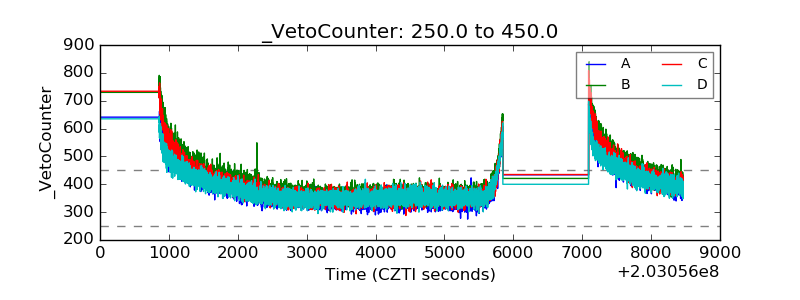 |