| Param | Original file | Final file |
|---|---|---|
| Filename | modeM0/AS1G05_248T01_9000000486_03763cztM0_level2.evt | modeM0/AS1G05_248T01_9000000486_03763cztM0_level2_quad_clean.evt |
| Size (bytes) | 479,255,040 | 75,369,600 |
| Size | 457.1 MB | 71.9 MB |
| Events in quadrant A | 3,406,251 | 466,373 |
| Events in quadrant B | 4,009,383 | 469,544 |
| Events in quadrant C | 3,059,144 | 456,635 |
| Events in quadrant D | 3,604,043 | 442,224 |
| Mode SS | |||
|---|---|---|---|
| Quadrant | BADHDUFLAG | Total packets | Discarded packets |
| A | 0 | 132 | 0 |
| B | 0 | 132 | 0 |
| C | 0 | 132 | 0 |
| D | 0 | 132 | 0 |
| Mode M9 | |||
|---|---|---|---|
| Quadrant | BADHDUFLAG | Total packets | Discarded packets |
| A | 0 | 17 | 0 |
| B | 0 | 17 | 0 |
| C | 0 | 17 | 0 |
| D | 0 | 18 | 0 |
| Mode M0 | |||
|---|---|---|---|
| Quadrant | BADHDUFLAG | Total packets | Discarded packets |
| A | 0 | 13949 | 3 |
| B | 0 | 15913 | 2 |
| C | 0 | 13252 | 2 |
| D | 0 | 14836 | 2 |
| Quadrant | Total seconds | Saturated seconds | Saturation percentage |
|---|---|---|---|
| A | 6406 | 164 | 2.560100% |
| B | 6406 | 214 | 3.340618% |
| C | 6406 | 91 | 1.420543% |
| D | 6406 | 168 | 2.622541% |
Noise dominated data is calculated using 1-second bins in cleaned event files. If a bin has >2000 counts, and if more than 50% of those come from <1% of pixels, then it is considered to be noise-dominated and hence unusable.
| Quadrant | # 1 sec bins | Bins with >0 counts | Bins with >2000 counts | High rate bins dominated by noise | Noise dominated (total time) | Noise dominated (detector-on time) | Marked lightcurve |
|---|---|---|---|---|---|---|---|
| A | 7646 | 6406 | 18 | 18 | 0.24% | 0.28% |  |
| B | 7646 | 6406 | 51 | 51 | 0.67% | 0.80% | 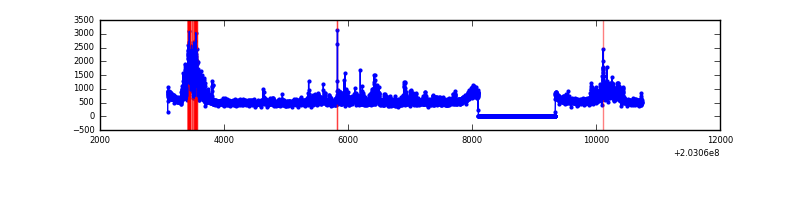 |
| C | 7646 | 6406 | 0 | 0 | 0.00% | 0.00% | 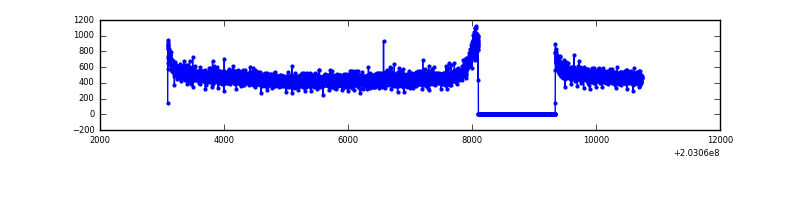 |
| D | 7646 | 6406 | 57 | 57 | 0.75% | 0.89% | 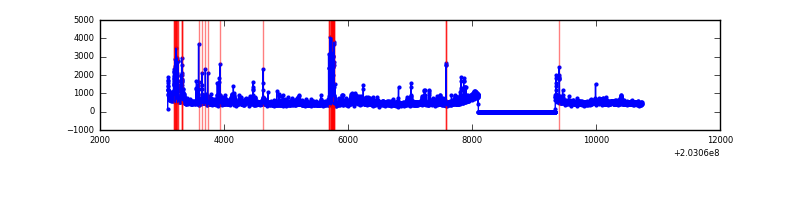 |
Top three noisy pixels from each quadrant. If the there are fewer than three noisy pixels in the level2.evt file, extra rows are filled as -1
| Pixel properties | Quadrant properties | ||||||
|---|---|---|---|---|---|---|---|
| Quadrant | DetID | PixID | Counts | Sigma | Mean | Median | Sigma |
| A | 0 | 118 | 125622 | 758.77 | 813 | 797 | 164.5 |
| A | 13 | 251 | 51298 | 306.98 | 813 | 797 | 164.5 |
| A | 3 | 1 | 30282 | 179.23 | 813 | 797 | 164.5 |
| B | 5 | 70 | 465311 | 3017.58 | 817 | 799 | 153.9 |
| B | 15 | 204 | 281087 | 1820.82 | 817 | 799 | 153.9 |
| B | 7 | 252 | 27957 | 176.42 | 817 | 799 | 153.9 |
| C | 8 | 128 | 6771 | 33.37 | 778 | 782 | 179.4 |
| C | 13 | 61 | 6474 | 31.72 | 778 | 782 | 179.4 |
| C | 8 | 112 | 3581 | 15.6 | 778 | 782 | 179.4 |
| D | 8 | 112 | 239838 | 1174.12 | 770 | 754 | 203.6 |
| D | 1 | 20 | 86571 | 421.44 | 770 | 754 | 203.6 |
| D | 13 | 239 | 60692 | 294.35 | 770 | 754 | 203.6 |
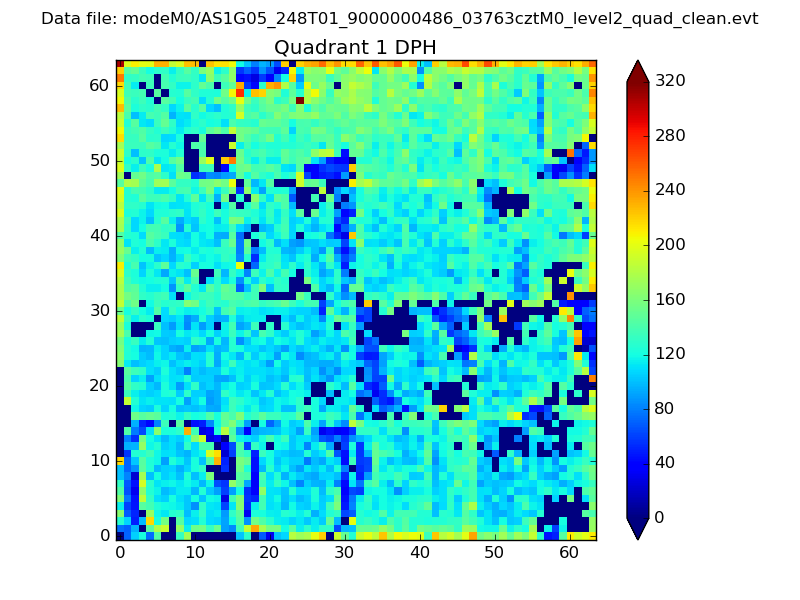
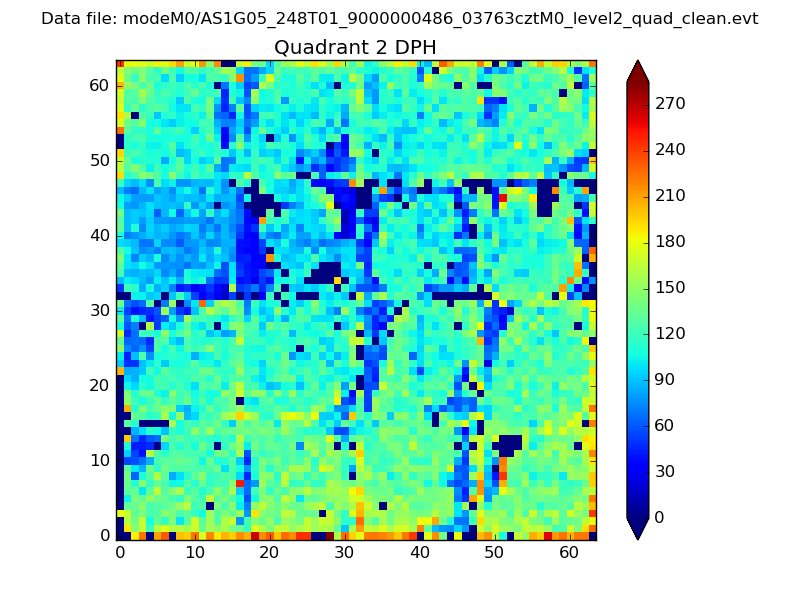
Histogram calculated using DETX and DETY for each event in the final _common_clean file
| Quadrant A | 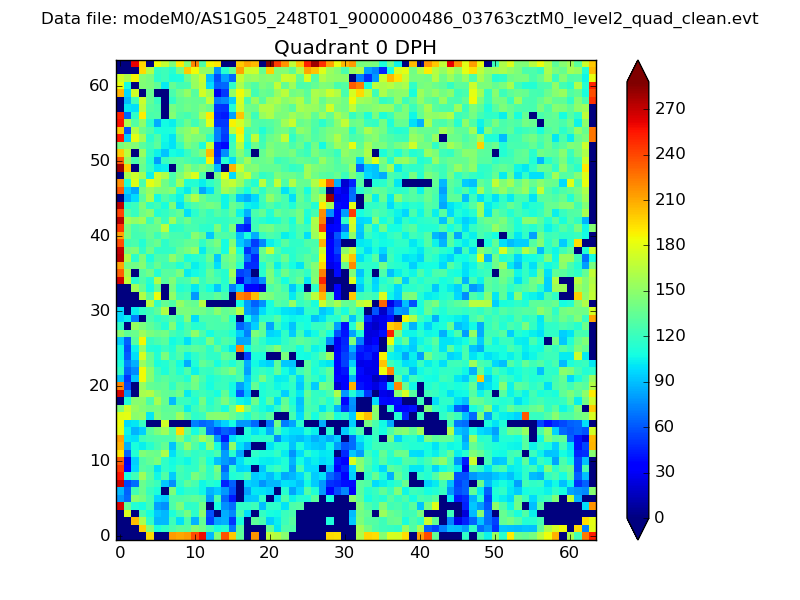 |
 |
Quadrant B |
|---|---|---|---|
| Quadrant D | 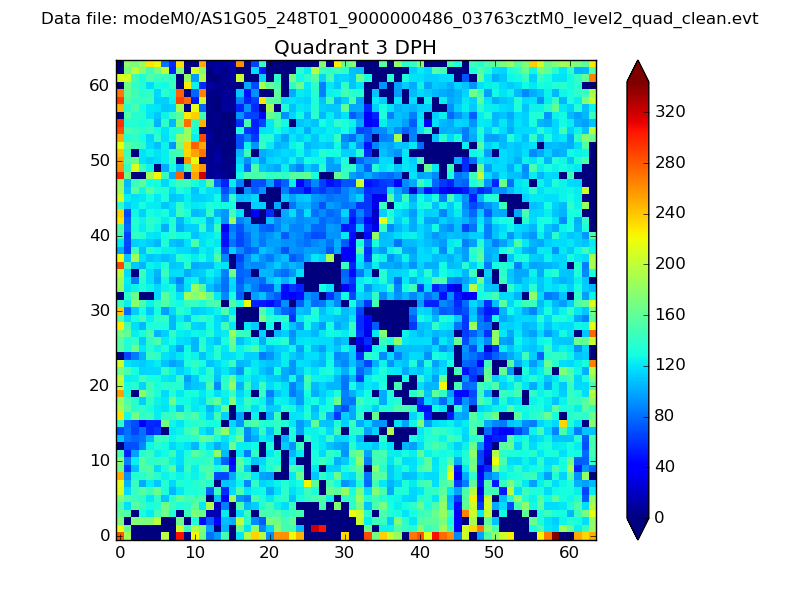 |
 |
Quadrant C |
| Plot type | Count rate plots | Images |
|---|---|---|
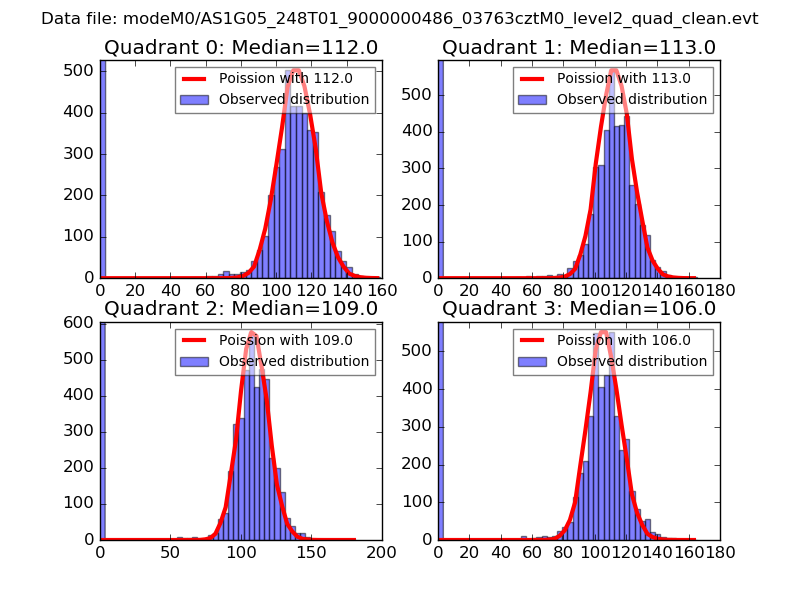
| Comparison with Poisson distribution Blue bars denote a histogram of data divided into 1 sec bins. Red curve is a Poisson curve with rate = median count rate of data. |
 |
 |
| Quadrant-wise count rates Data is divided into 100 sec bins |
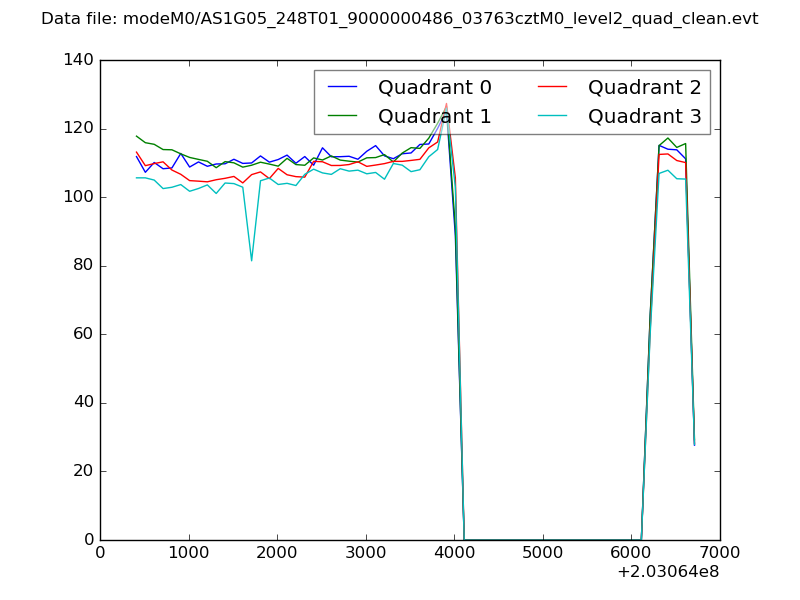 |
|
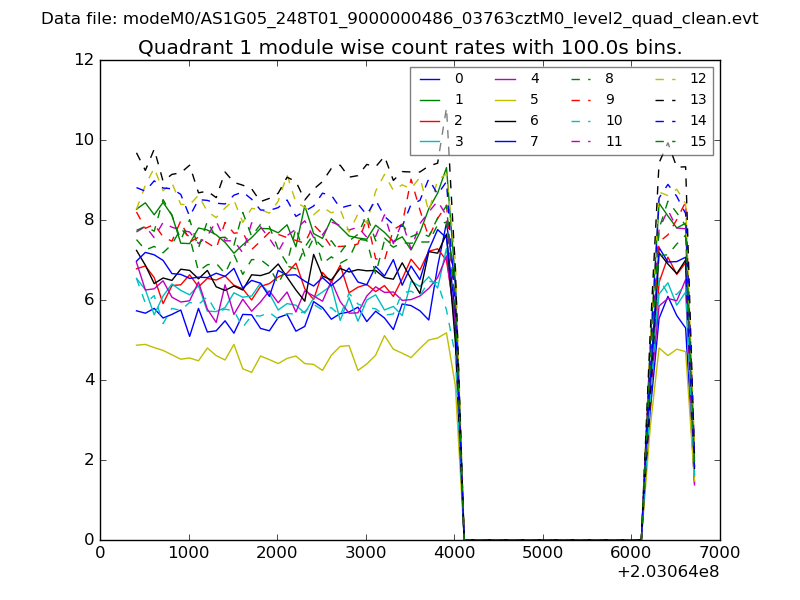
| Module-wise count rates for Quadrant A Data is divided into 100 sec bins |
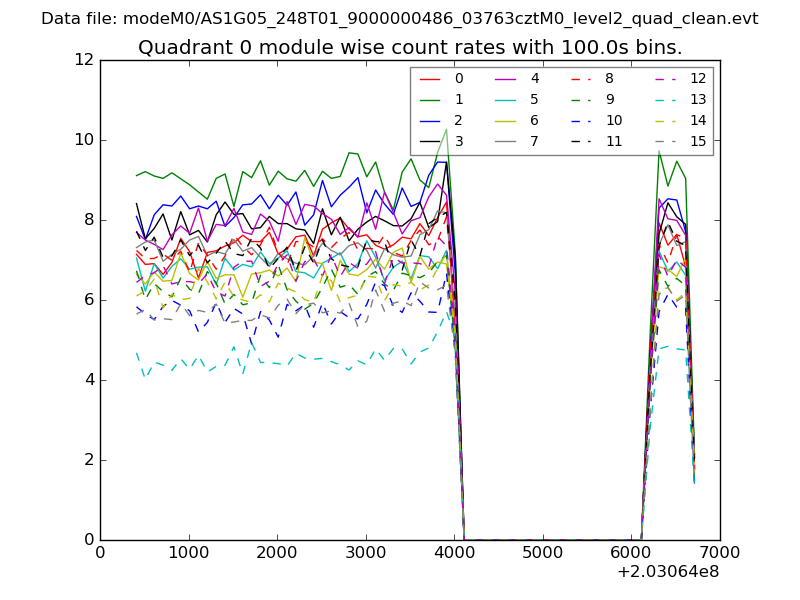 |
 |
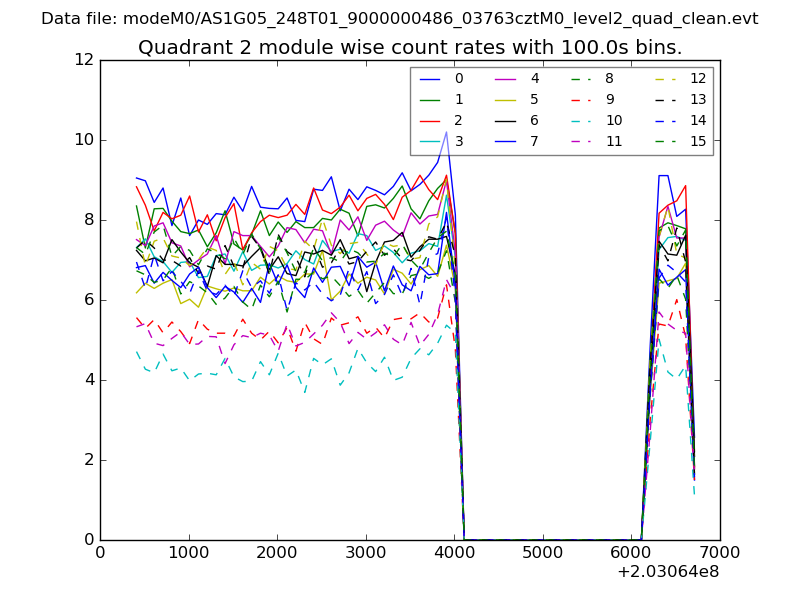
| Module-wise count rates for Quadrant B Data is divided into 100 sec bins |
 |
 |
| Module-wise count rates for Quadrant C Data is divided into 100 sec bins |
 |
 |
| Module-wise count rates for Quadrant D Data is divided into 100 sec bins |
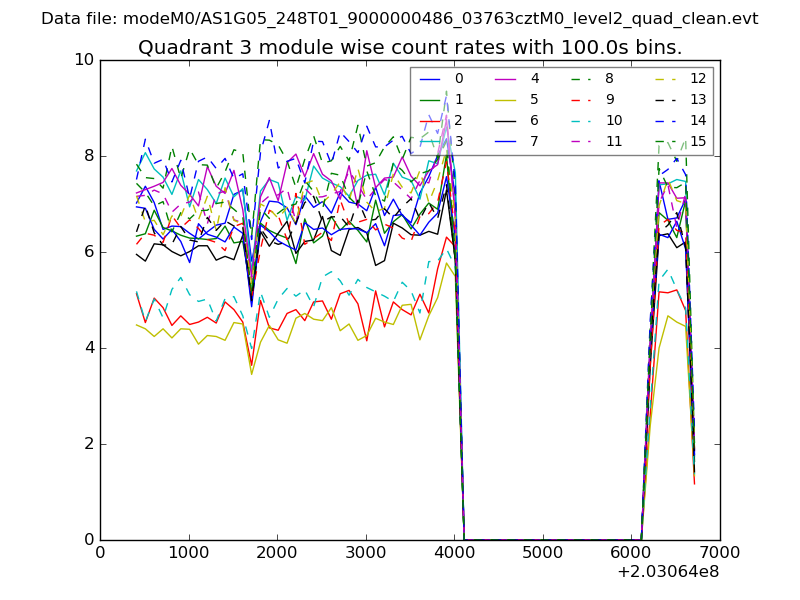 |
 |
| Parameter | Plot |
|---|---|
| CZT HV Monitor | 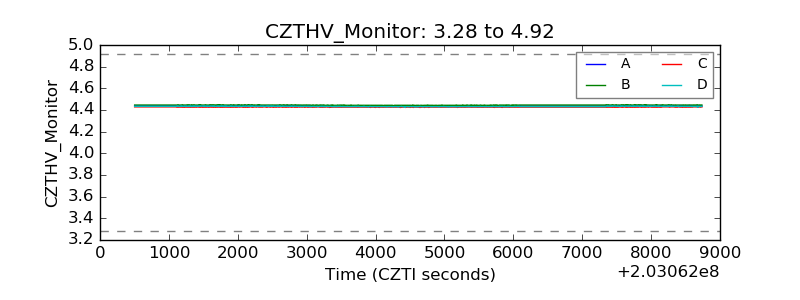 |
| D_VDD | 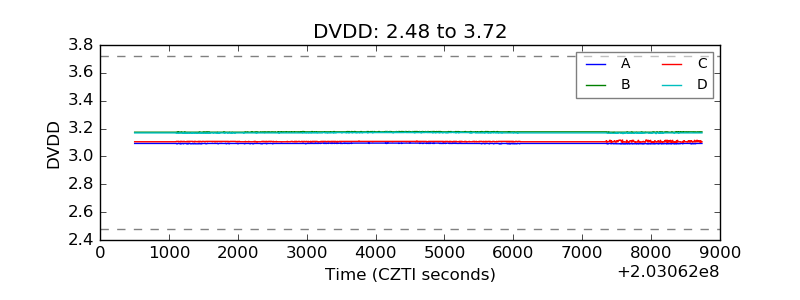 |
| Temperature 1 | 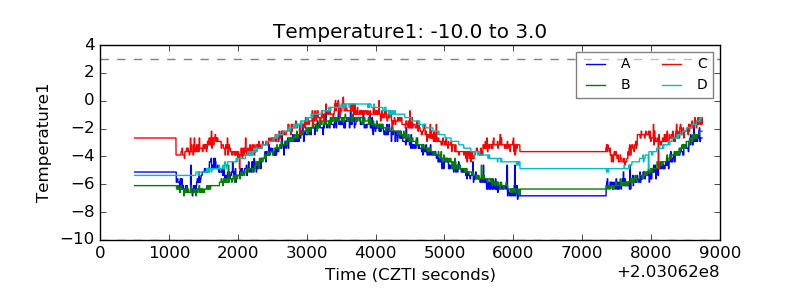 |
| Veto HV Monitor | 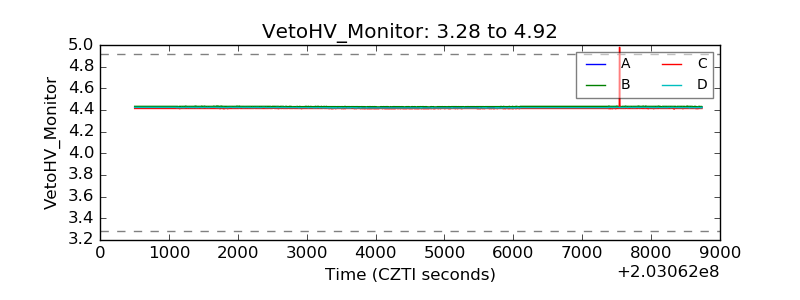 |
| Veto LLD | 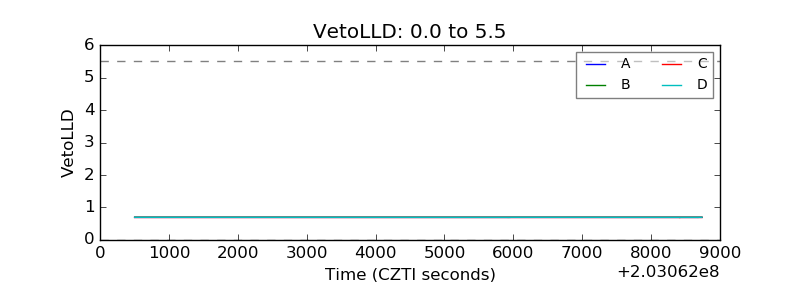 |
| Alpha Counter | 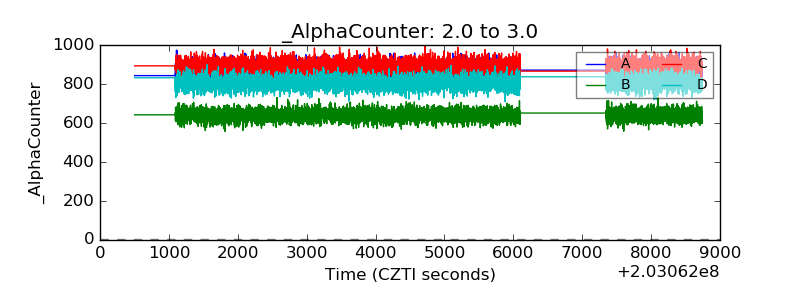 |
| _CPM_Rate | 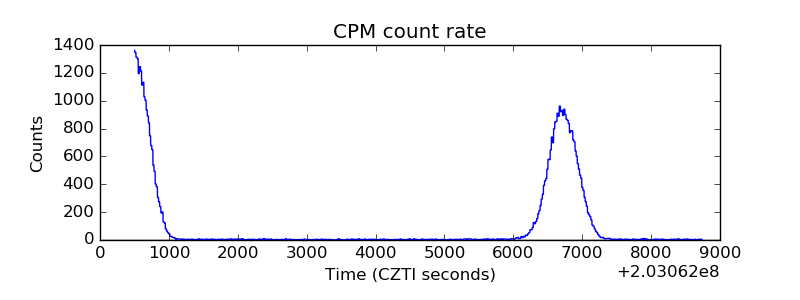 |
| CZT Counter | 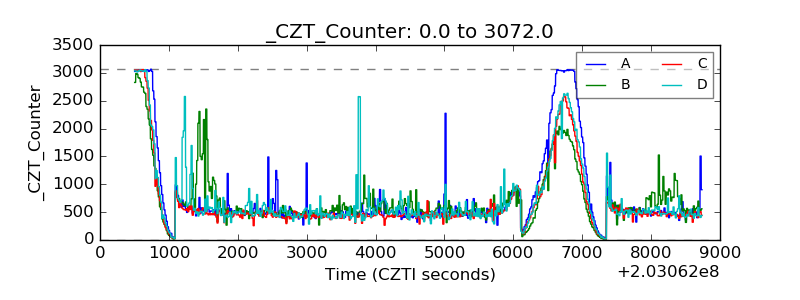 |
| +2.5 Volts monitor |  |
| +5 Volts monitor | 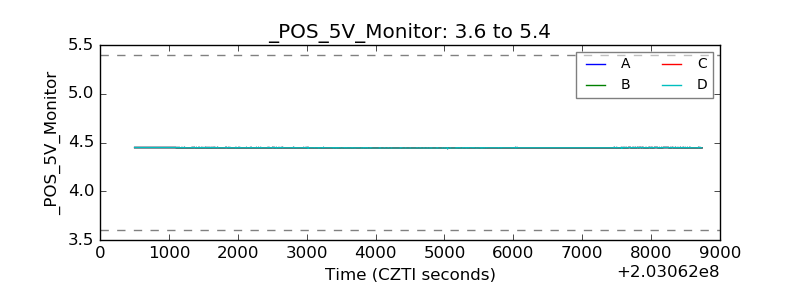 |
| Veto Counter | 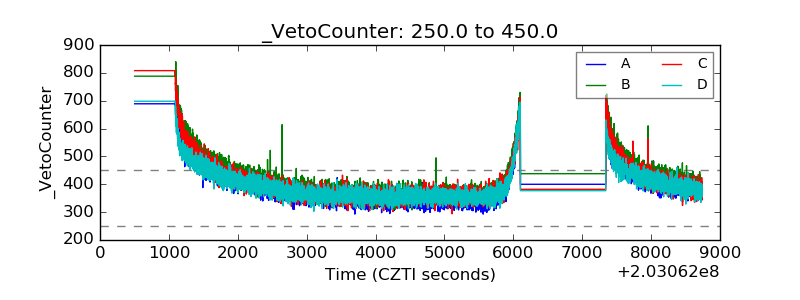 |