| Param | Original file | Final file |
|---|---|---|
| Filename | modeM0/AS1G05_248T01_9000000486_03764cztM0_level2.evt | modeM0/AS1G05_248T01_9000000486_03764cztM0_level2_quad_clean.evt |
| Size (bytes) | 471,859,200 | 82,131,840 |
| Size | 450.0 MB | 78.3 MB |
| Events in quadrant A | 3,616,466 | 517,316 |
| Events in quadrant B | 3,739,725 | 519,066 |
| Events in quadrant C | 3,106,844 | 505,212 |
| Events in quadrant D | 3,385,752 | 492,407 |
| Mode SS | |||
|---|---|---|---|
| Quadrant | BADHDUFLAG | Total packets | Discarded packets |
| A | 0 | 132 | 0 |
| B | 0 | 132 | 0 |
| C | 0 | 132 | 0 |
| D | 0 | 132 | 0 |
| Mode M9 | |||
|---|---|---|---|
| Quadrant | BADHDUFLAG | Total packets | Discarded packets |
| A | 0 | 13 | 0 |
| B | 0 | 13 | 0 |
| C | 0 | 13 | 0 |
| D | 0 | 14 | 0 |
| Mode M0 | |||
|---|---|---|---|
| Quadrant | BADHDUFLAG | Total packets | Discarded packets |
| A | 0 | 14761 | 3 |
| B | 0 | 15122 | 2 |
| C | 0 | 13599 | 2 |
| D | 0 | 14428 | 2 |
| Quadrant | Total seconds | Saturated seconds | Saturation percentage |
|---|---|---|---|
| A | 6496 | 225 | 3.463670% |
| B | 6496 | 142 | 2.185961% |
| C | 6496 | 89 | 1.370074% |
| D | 6496 | 134 | 2.062808% |
Noise dominated data is calculated using 1-second bins in cleaned event files. If a bin has >2000 counts, and if more than 50% of those come from <1% of pixels, then it is considered to be noise-dominated and hence unusable.
| Quadrant | # 1 sec bins | Bins with >0 counts | Bins with >2000 counts | High rate bins dominated by noise | Noise dominated (total time) | Noise dominated (detector-on time) | Marked lightcurve |
|---|---|---|---|---|---|---|---|
| A | 7666 | 6496 | 51 | 51 | 0.67% | 0.79% | 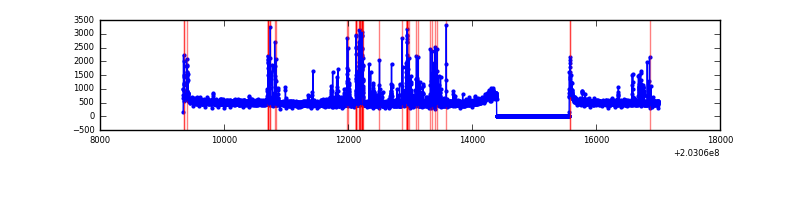 |
| B | 7666 | 6496 | 3 | 3 | 0.04% | 0.05% | 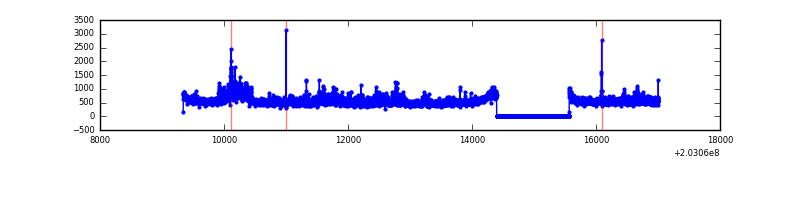 |
| C | 7666 | 6497 | 0 | 0 | 0.00% | 0.00% | 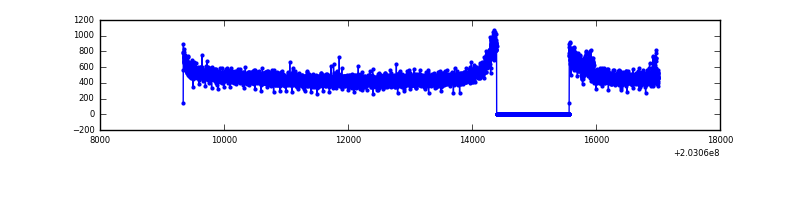 |
| D | 7666 | 6496 | 33 | 33 | 0.43% | 0.51% | 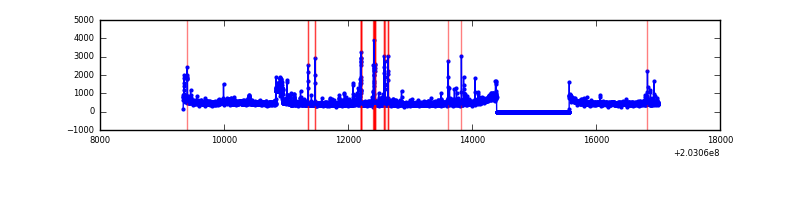 |
Top three noisy pixels from each quadrant. If the there are fewer than three noisy pixels in the level2.evt file, extra rows are filled as -1
| Pixel properties | Quadrant properties | ||||||
|---|---|---|---|---|---|---|---|
| Quadrant | DetID | PixID | Counts | Sigma | Mean | Median | Sigma |
| A | 0 | 118 | 305532 | 1851.25 | 805 | 789 | 164.6 |
| A | 13 | 251 | 118950 | 717.8 | 805 | 789 | 164.6 |
| A | 0 | 226 | 36100 | 214.5 | 805 | 789 | 164.6 |
| B | 15 | 204 | 366847 | 2341.36 | 814 | 796 | 156.3 |
| B | 5 | 70 | 168631 | 1073.52 | 814 | 796 | 156.3 |
| B | 15 | 54 | 21376 | 131.63 | 814 | 796 | 156.3 |
| C | 2 | 53 | 49651 | 273.09 | 773 | 775 | 179.0 |
| C | 8 | 128 | 14745 | 78.06 | 773 | 775 | 179.0 |
| C | 8 | 112 | 8265 | 41.85 | 773 | 775 | 179.0 |
| D | 2 | 37 | 223275 | 1080.04 | 768 | 753 | 206.0 |
| D | 8 | 112 | 29914 | 141.54 | 768 | 753 | 206.0 |
| D | 13 | 239 | 29316 | 138.63 | 768 | 753 | 206.0 |
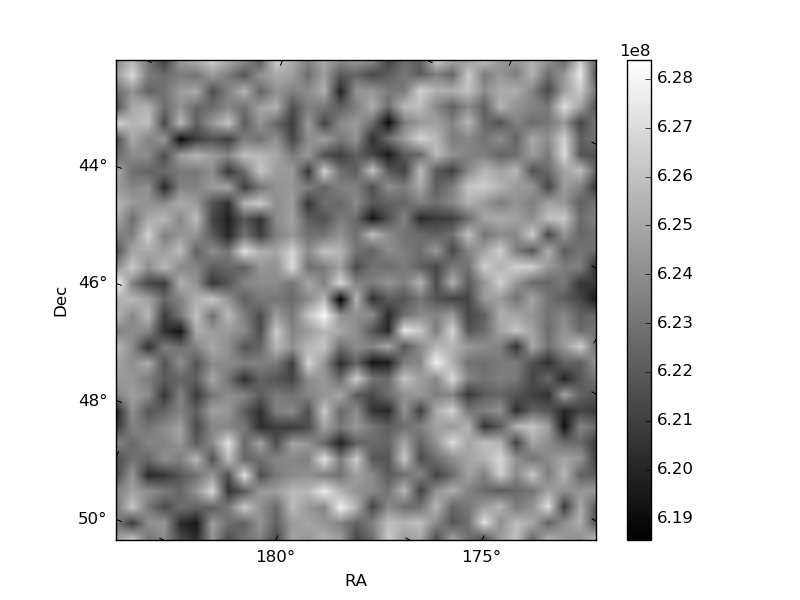
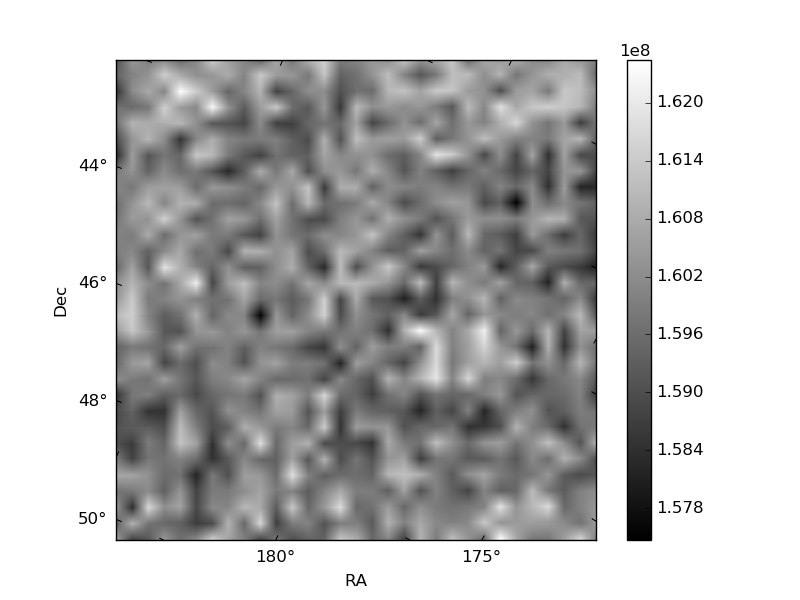
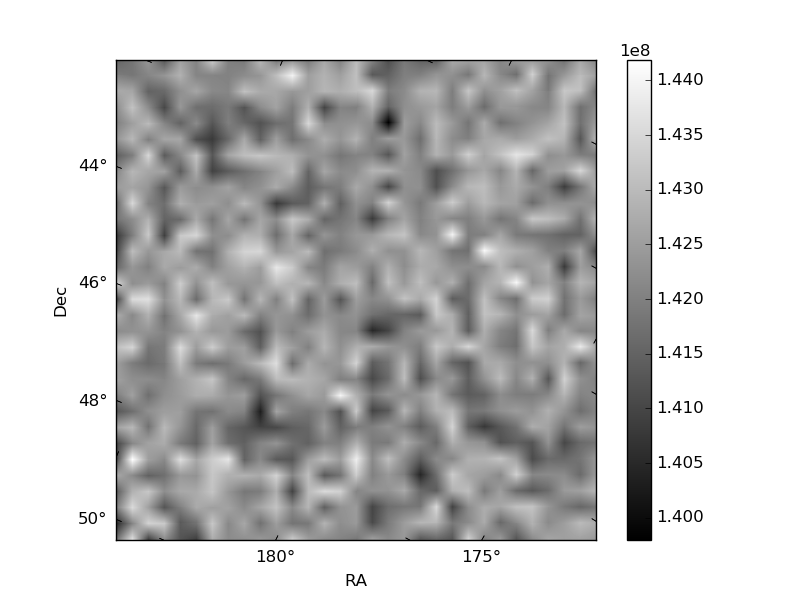
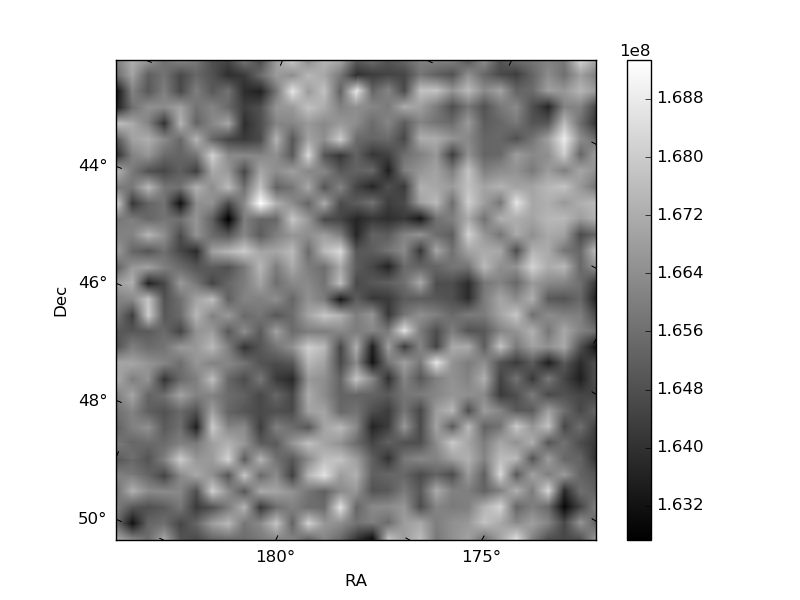
Histogram calculated using DETX and DETY for each event in the final _common_clean file
| Quadrant A | 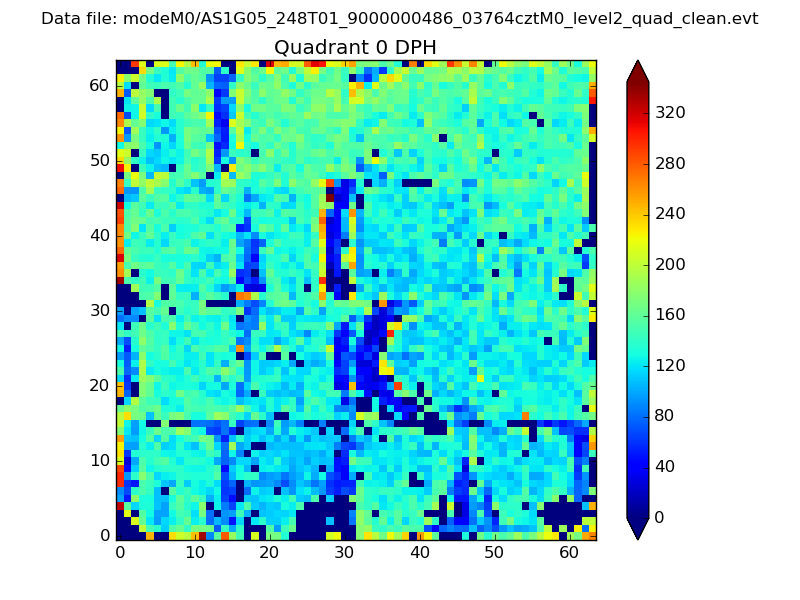 |
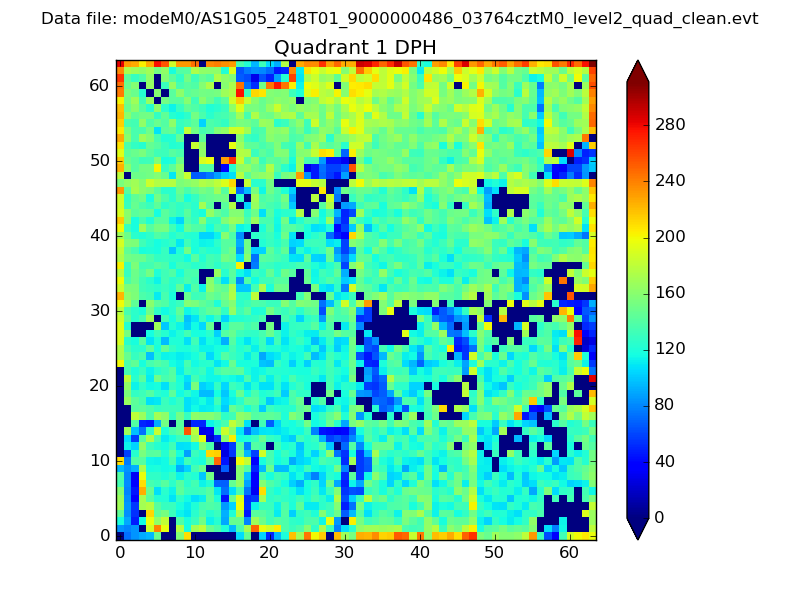 |
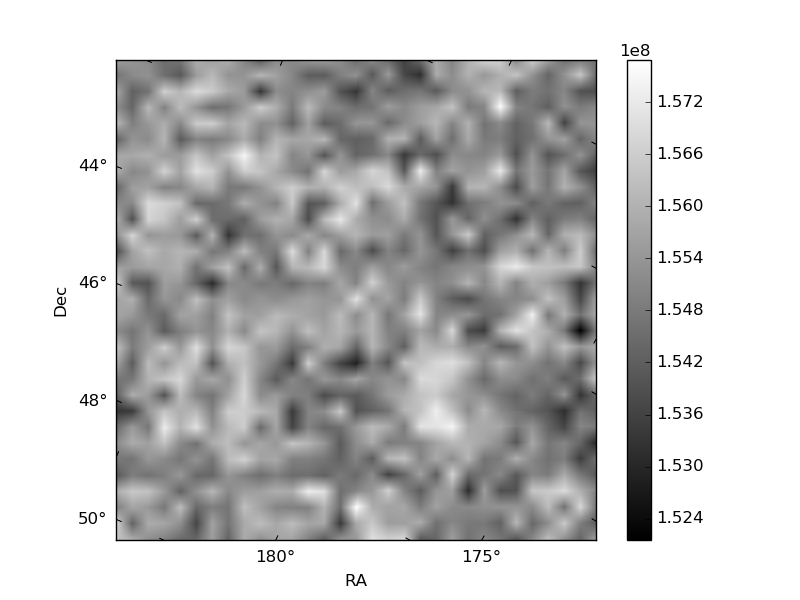
Quadrant B |
|---|---|---|---|
| Quadrant D | 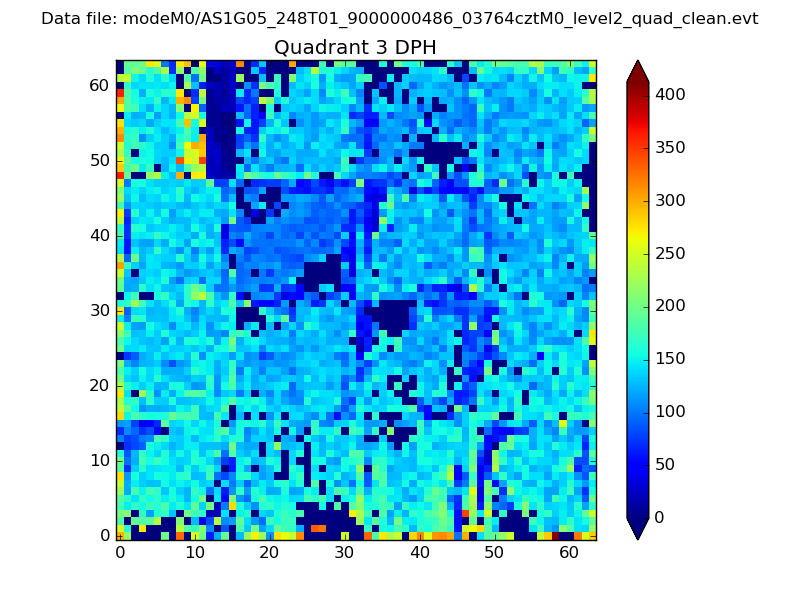 |
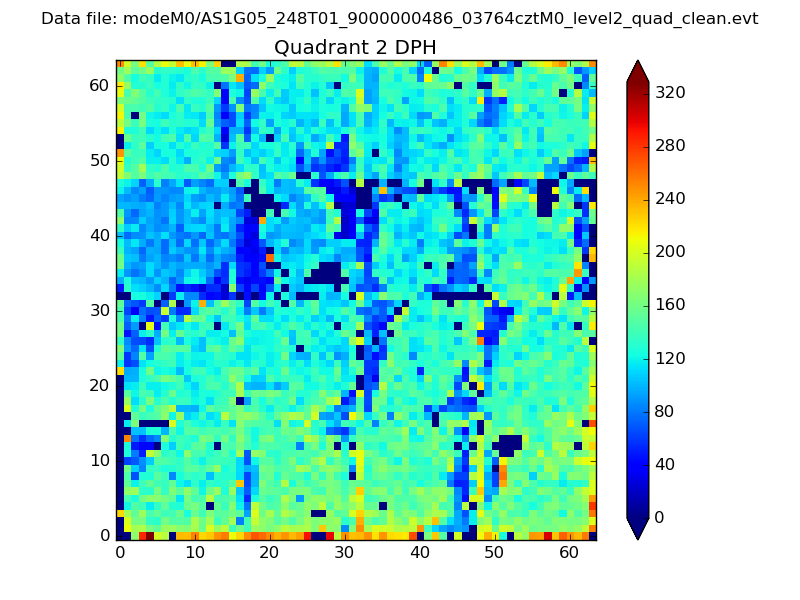 |
Quadrant C |
| Plot type | Count rate plots | Images |
|---|---|---|
| Comparison with Poisson distribution Blue bars denote a histogram of data divided into 1 sec bins. Red curve is a Poisson curve with rate = median count rate of data. |
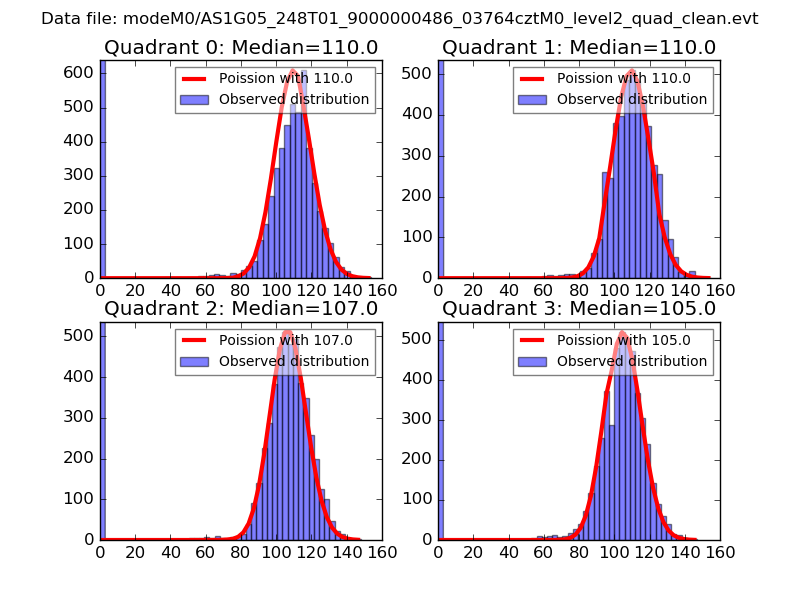 |
 |
| Quadrant-wise count rates Data is divided into 100 sec bins |
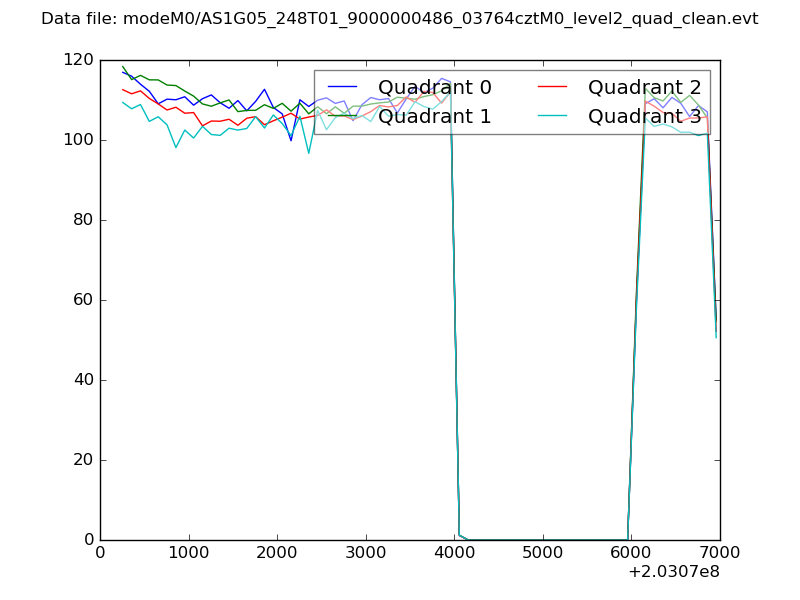 |
|
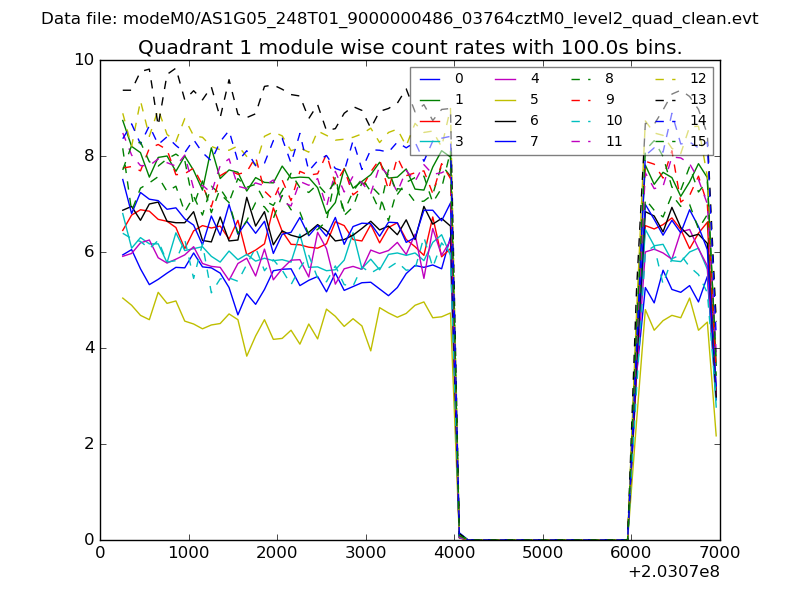
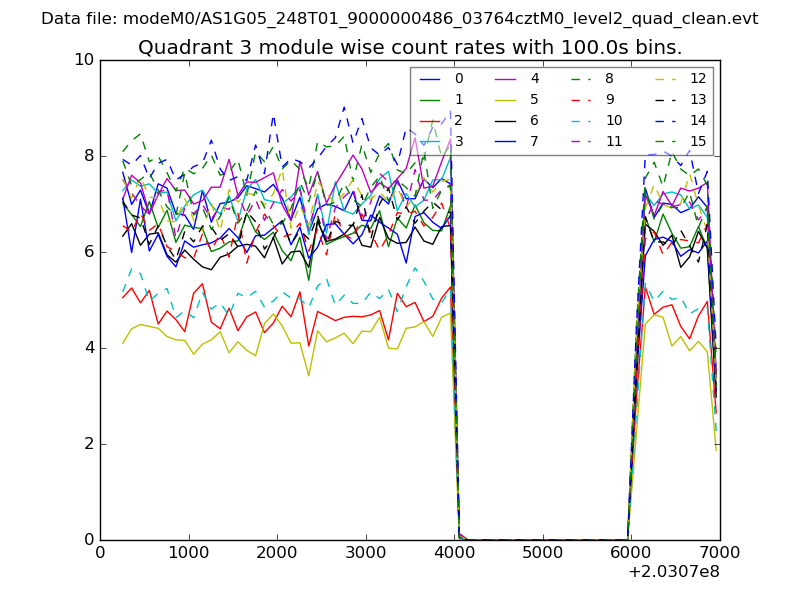
| Module-wise count rates for Quadrant A Data is divided into 100 sec bins |
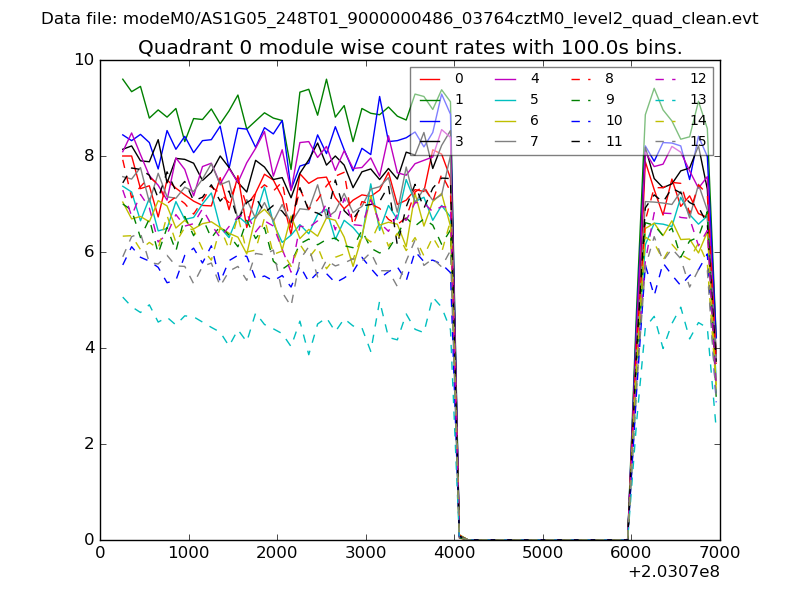 |
 |
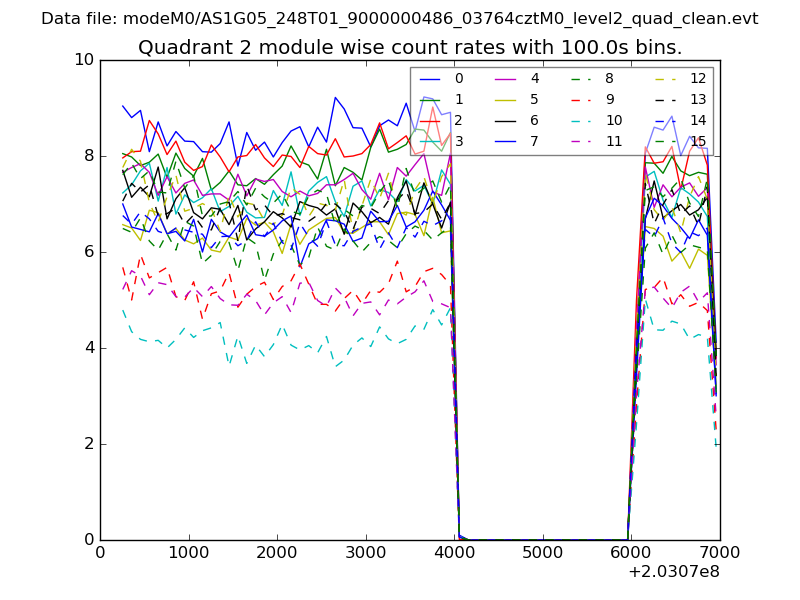
| Module-wise count rates for Quadrant B Data is divided into 100 sec bins |
 |
 |
| Module-wise count rates for Quadrant C Data is divided into 100 sec bins |
 |
 |
| Module-wise count rates for Quadrant D Data is divided into 100 sec bins |
 |
 |
| Parameter | Plot |
|---|---|
| CZT HV Monitor | 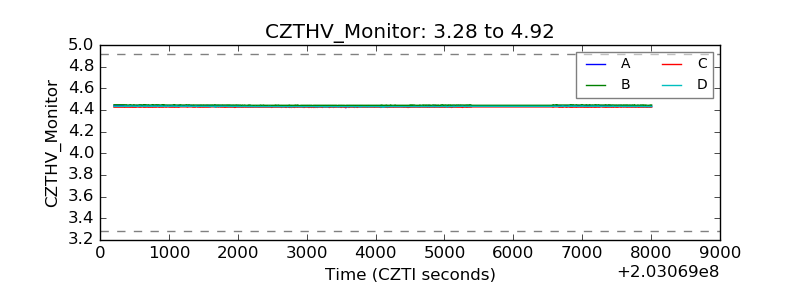 |
| D_VDD |  |
| Temperature 1 | 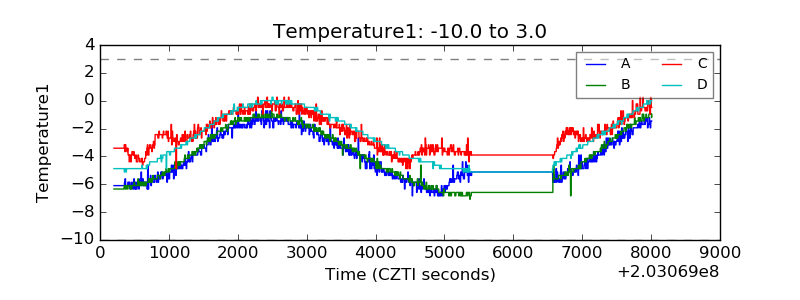 |
| Veto HV Monitor | 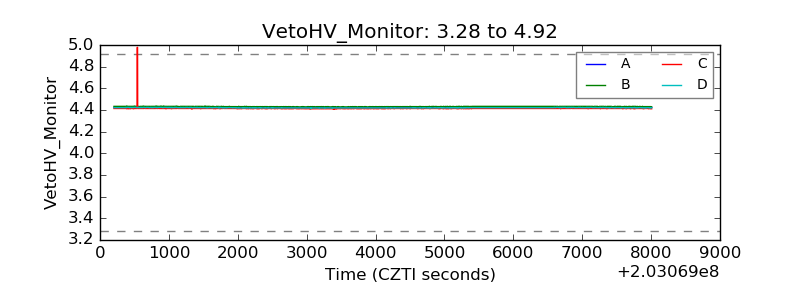 |
| Veto LLD | 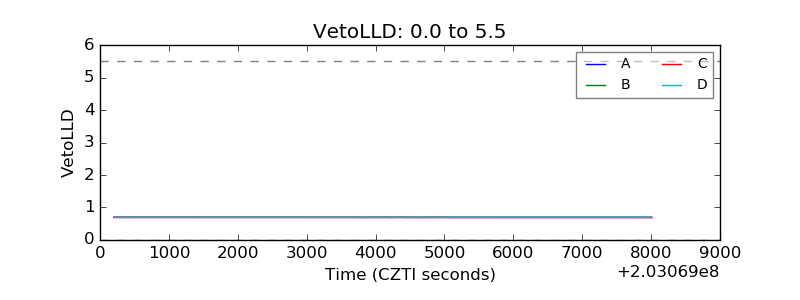 |
| Alpha Counter | 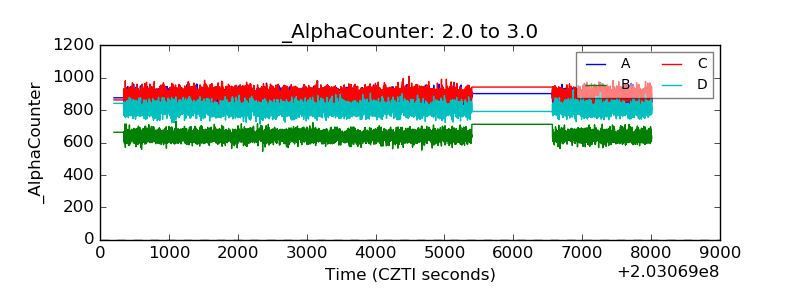 |
| _CPM_Rate | 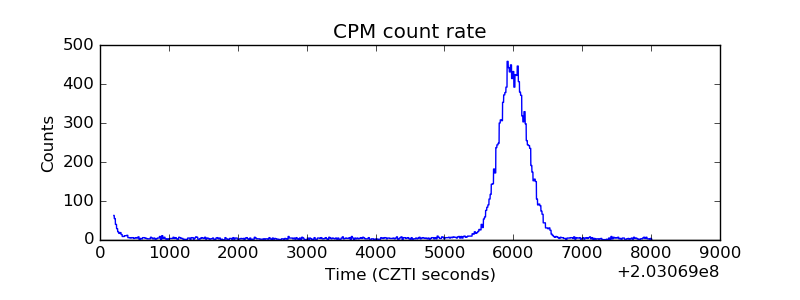 |
| CZT Counter | 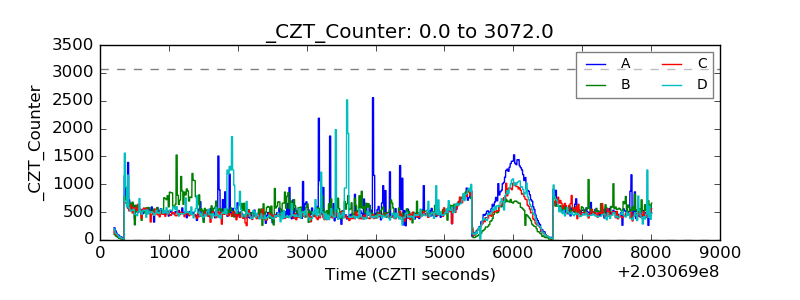 |
| +2.5 Volts monitor |  |
| +5 Volts monitor |  |
| Veto Counter | 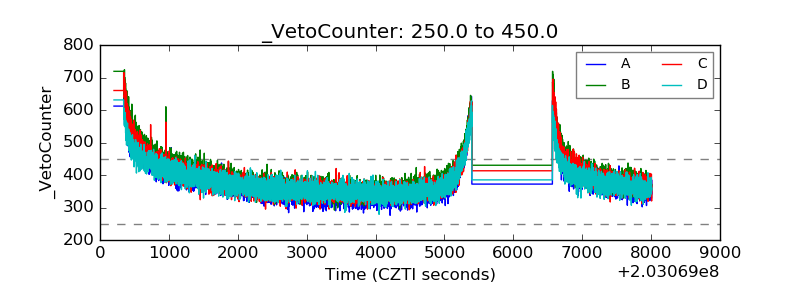 |