| Param | Original file | Final file |
|---|---|---|
| Filename | modeM0/AS1G05_248T01_9000000486_03765cztM0_level2.evt | modeM0/AS1G05_248T01_9000000486_03765cztM0_level2_quad_clean.evt |
| Size (bytes) | 507,104,640 | 89,559,360 |
| Size | 483.6 MB | 85.4 MB |
| Events in quadrant A | 3,908,282 | 563,375 |
| Events in quadrant B | 4,091,586 | 566,375 |
| Events in quadrant C | 3,272,769 | 556,732 |
| Events in quadrant D | 3,610,661 | 538,891 |
| Mode SS | |||
|---|---|---|---|
| Quadrant | BADHDUFLAG | Total packets | Discarded packets |
| A | 0 | 142 | 0 |
| B | 0 | 142 | 0 |
| C | 0 | 142 | 0 |
| D | 0 | 142 | 0 |
| Mode M9 | |||
|---|---|---|---|
| Quadrant | BADHDUFLAG | Total packets | Discarded packets |
| A | 0 | 14 | 0 |
| B | 0 | 14 | 0 |
| C | 0 | 14 | 0 |
| D | 0 | 15 | 0 |
| Mode M0 | |||
|---|---|---|---|
| Quadrant | BADHDUFLAG | Total packets | Discarded packets |
| A | 0 | 16134 | 3 |
| B | 0 | 16614 | 2 |
| C | 0 | 14723 | 2 |
| D | 0 | 15495 | 2 |
| Quadrant | Total seconds | Saturated seconds | Saturation percentage |
|---|---|---|---|
| A | 6987 | 232 | 3.320452% |
| B | 6987 | 101 | 1.445542% |
| C | 6987 | 77 | 1.102047% |
| D | 6987 | 156 | 2.232718% |
Noise dominated data is calculated using 1-second bins in cleaned event files. If a bin has >2000 counts, and if more than 50% of those come from <1% of pixels, then it is considered to be noise-dominated and hence unusable.
| Quadrant | # 1 sec bins | Bins with >0 counts | Bins with >2000 counts | High rate bins dominated by noise | Noise dominated (total time) | Noise dominated (detector-on time) | Marked lightcurve |
|---|---|---|---|---|---|---|---|
| A | 7962 | 6987 | 83 | 83 | 1.04% | 1.19% | 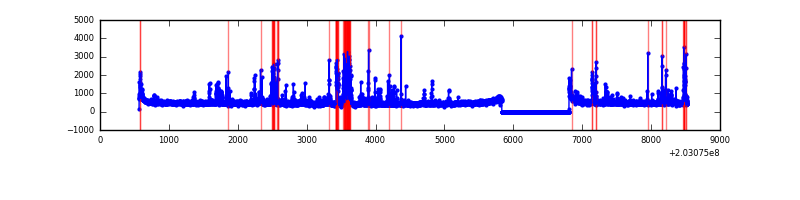 |
| B | 7962 | 6987 | 4 | 4 | 0.05% | 0.06% | 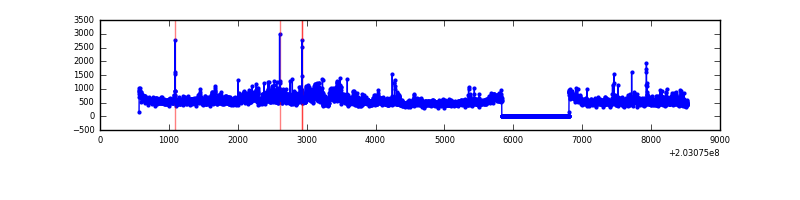 |
| C | 7962 | 6988 | 8 | 8 | 0.10% | 0.11% | 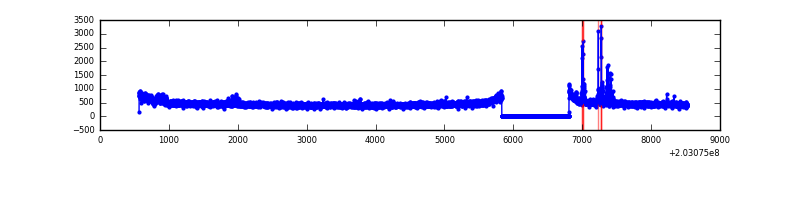 |
| D | 7962 | 6987 | 69 | 69 | 0.87% | 0.99% | 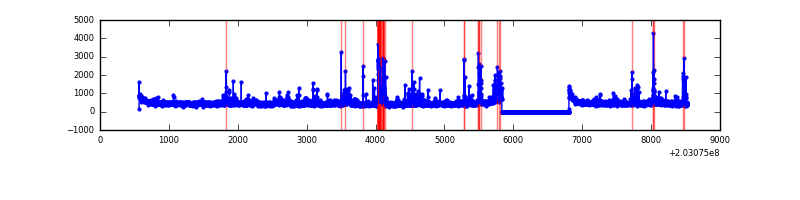 |
Top three noisy pixels from each quadrant. If the there are fewer than three noisy pixels in the level2.evt file, extra rows are filled as -1
| Pixel properties | Quadrant properties | ||||||
|---|---|---|---|---|---|---|---|
| Quadrant | DetID | PixID | Counts | Sigma | Mean | Median | Sigma |
| A | 0 | 118 | 407524 | 2426.02 | 827 | 809 | 167.6 |
| A | 13 | 251 | 148973 | 883.79 | 827 | 809 | 167.6 |
| A | 0 | 50 | 53814 | 316.17 | 827 | 809 | 167.6 |
| B | 15 | 204 | 689225 | 4239.88 | 838 | 818 | 162.4 |
| B | 15 | 54 | 43853 | 265.05 | 838 | 818 | 162.4 |
| B | 0 | 244 | 31789 | 190.75 | 838 | 818 | 162.4 |
| C | 14 | 234 | 64666 | 342.86 | 801 | 804 | 186.3 |
| C | 2 | 53 | 54335 | 287.39 | 801 | 804 | 186.3 |
| C | 14 | 67 | 10283 | 50.89 | 801 | 804 | 186.3 |
| D | 8 | 112 | 149448 | 766.85 | 799 | 775 | 193.9 |
| D | 13 | 25 | 148099 | 759.89 | 799 | 775 | 193.9 |
| D | 13 | 239 | 77006 | 393.2 | 799 | 775 | 193.9 |
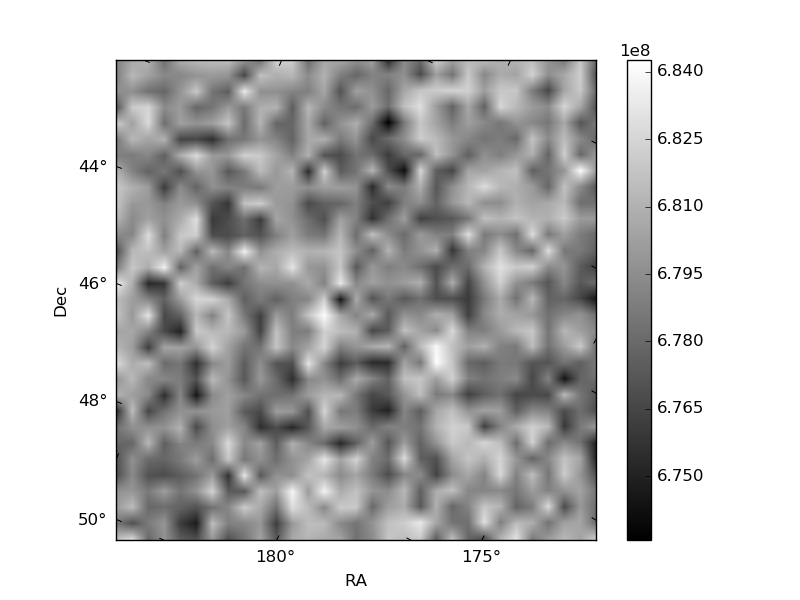
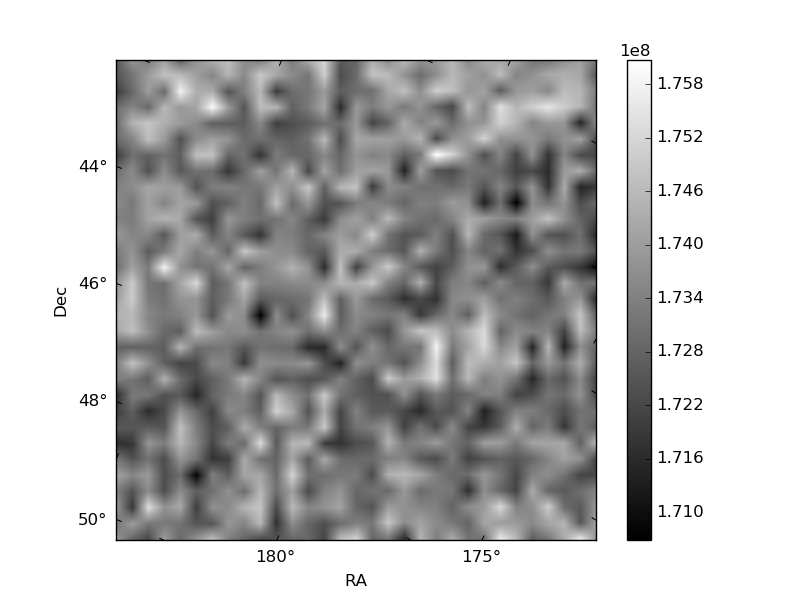
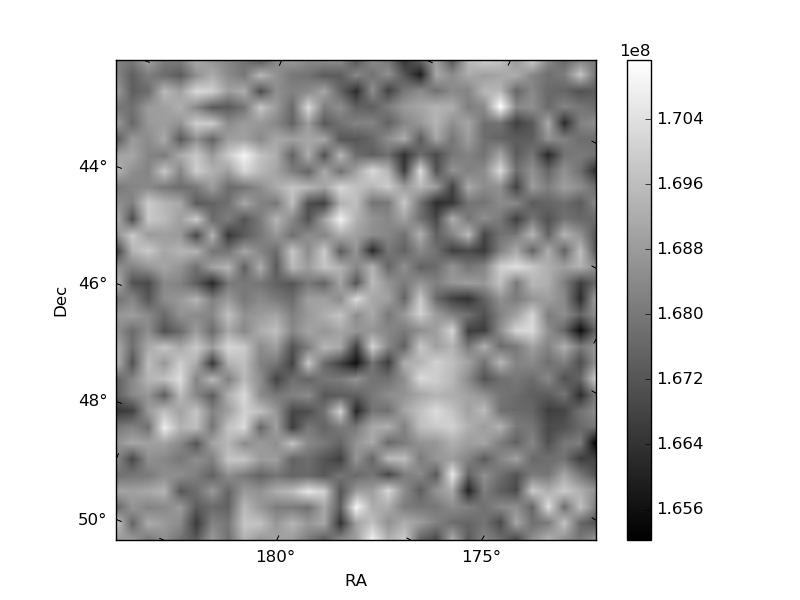
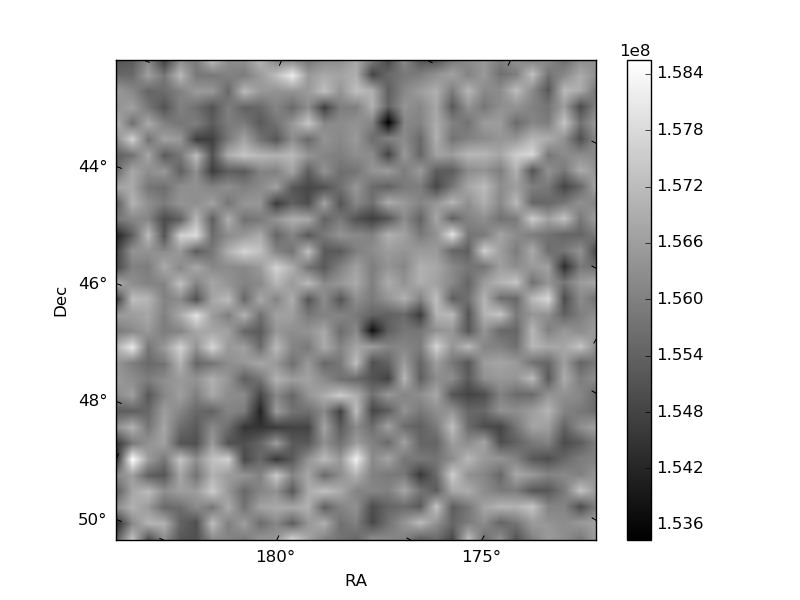
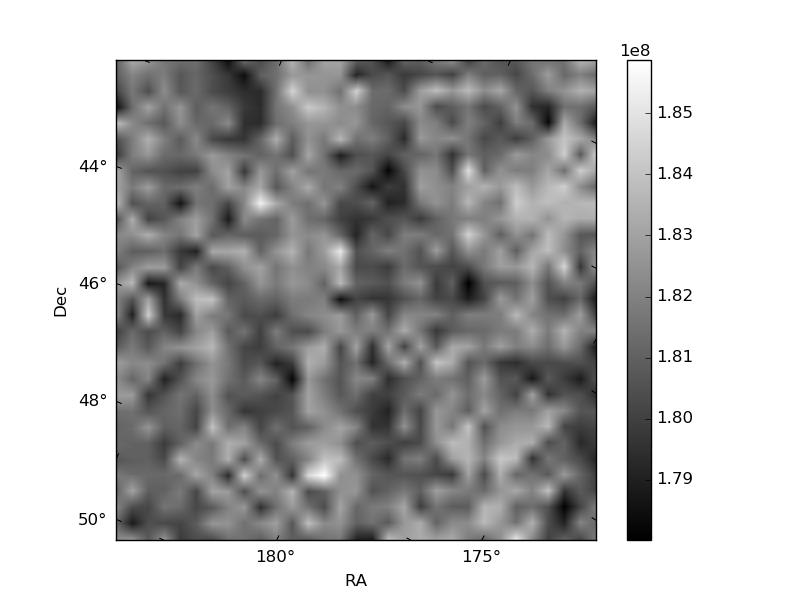
Histogram calculated using DETX and DETY for each event in the final _common_clean file
| Quadrant A | 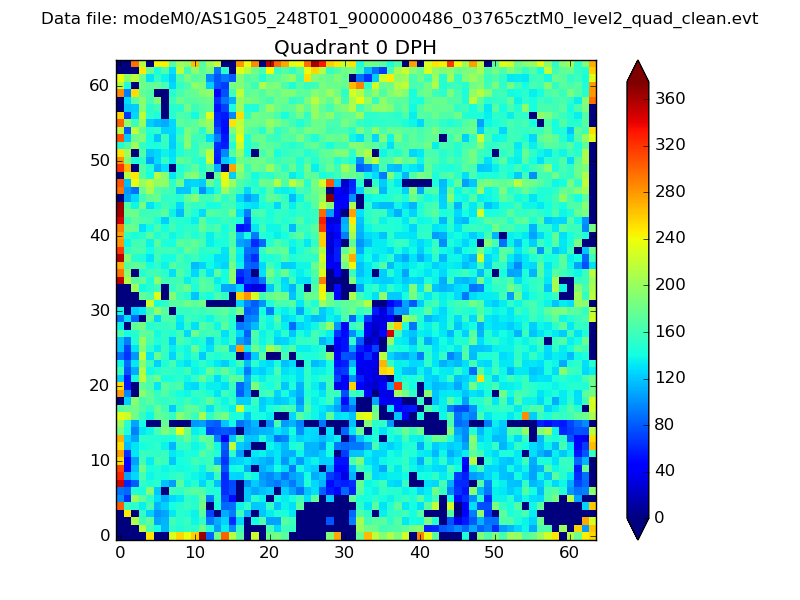 |
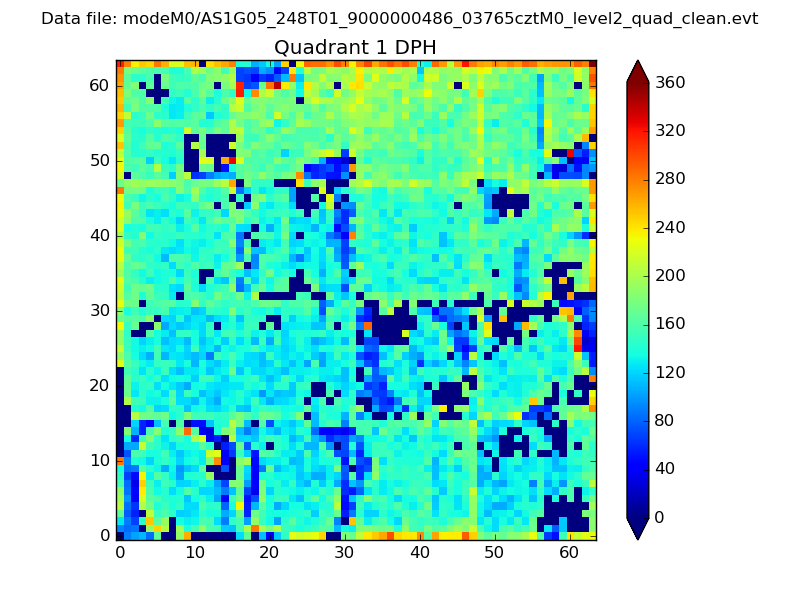 |
Quadrant B |
|---|---|---|---|
| Quadrant D | 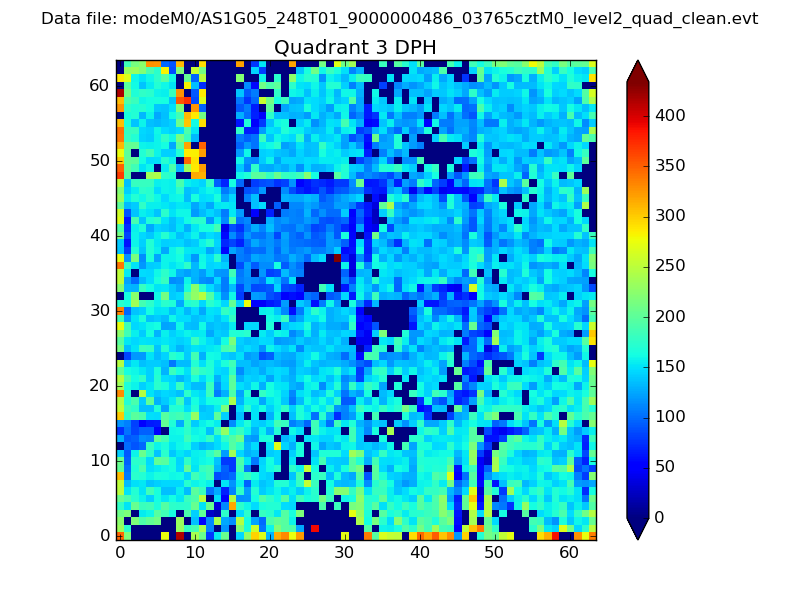 |
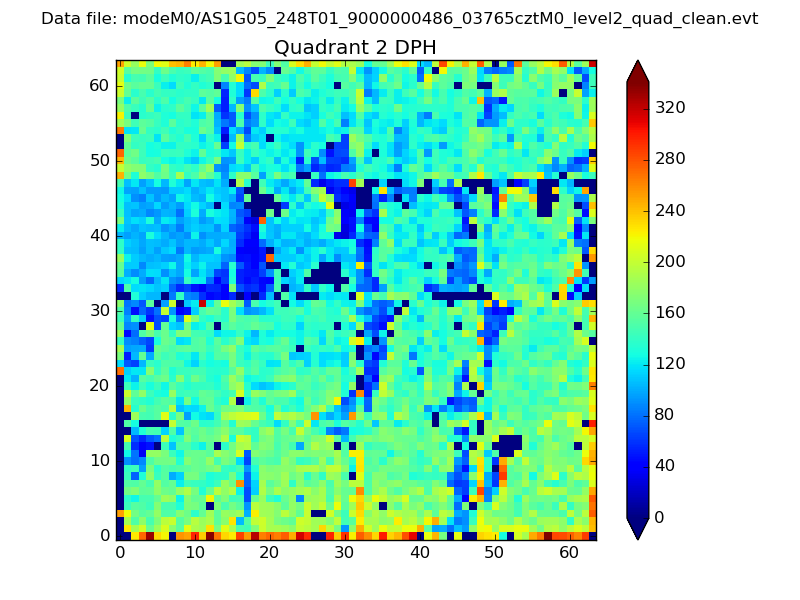 |
Quadrant C |
| Plot type | Count rate plots | Images |
|---|---|---|
| Comparison with Poisson distribution Blue bars denote a histogram of data divided into 1 sec bins. Red curve is a Poisson curve with rate = median count rate of data. |
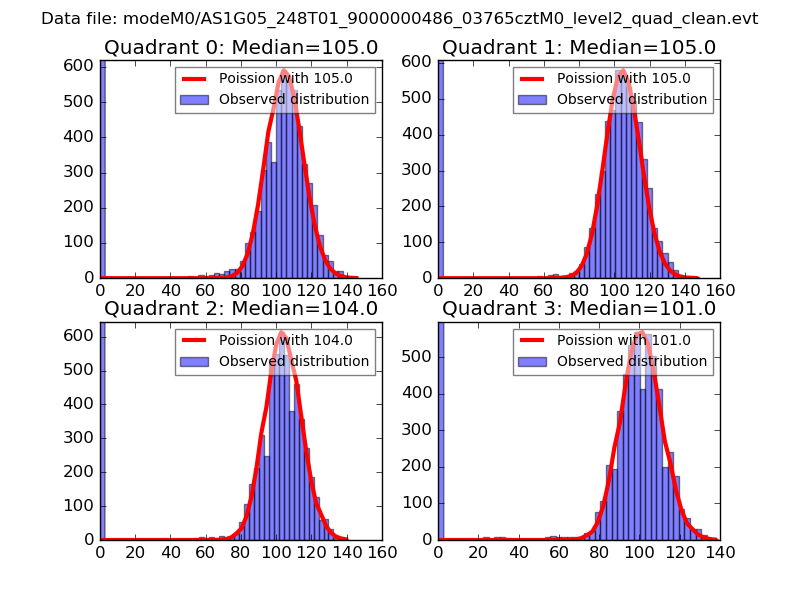 |
 |
| Quadrant-wise count rates Data is divided into 100 sec bins |
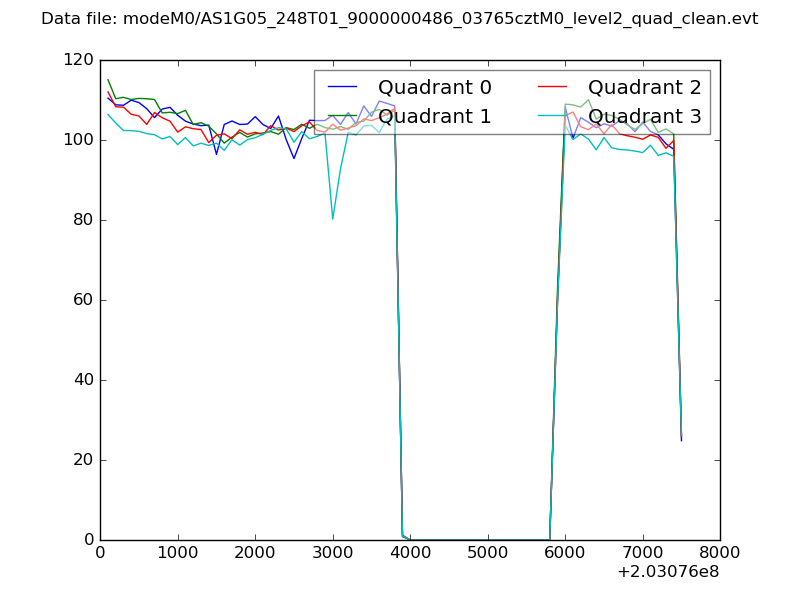 |
|
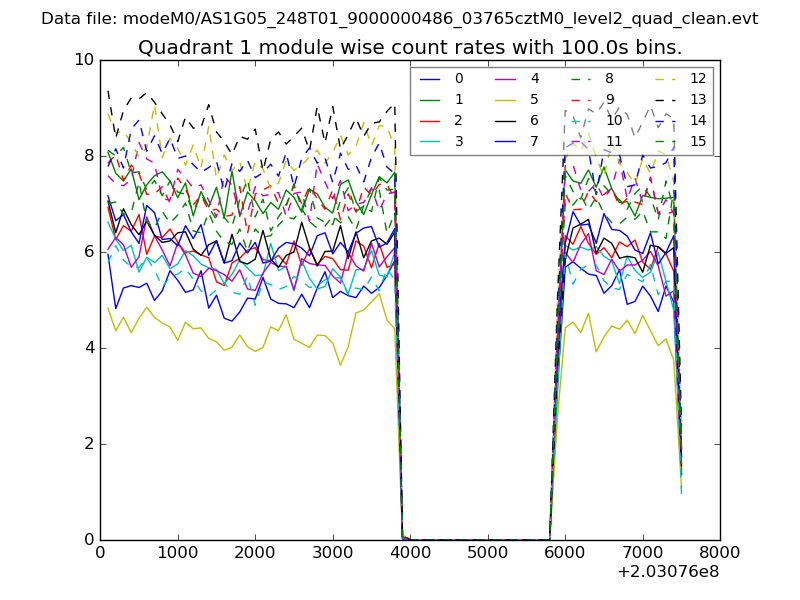
| Module-wise count rates for Quadrant A Data is divided into 100 sec bins |
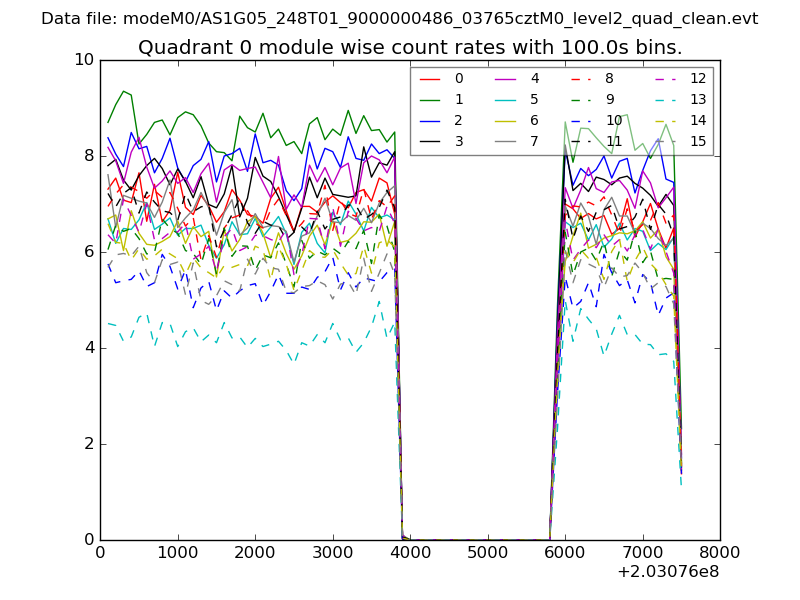 |
 |
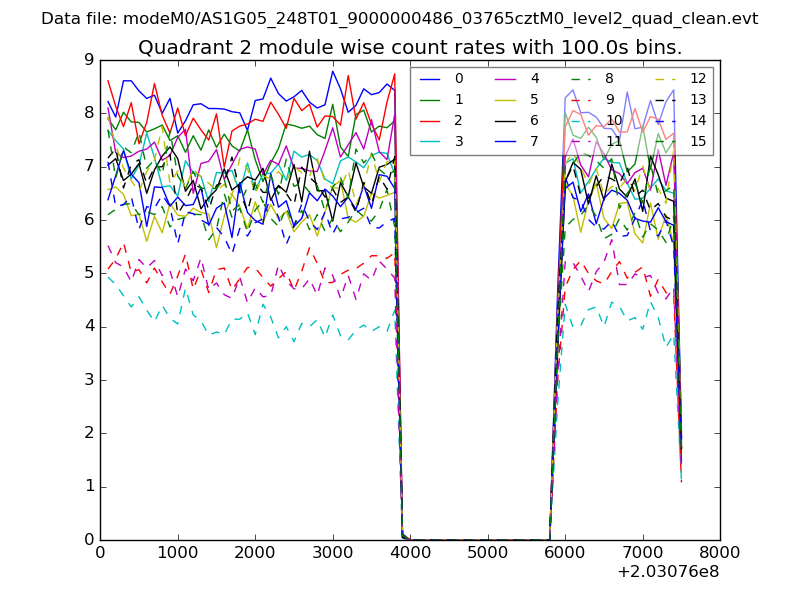
| Module-wise count rates for Quadrant B Data is divided into 100 sec bins |
 |
 |
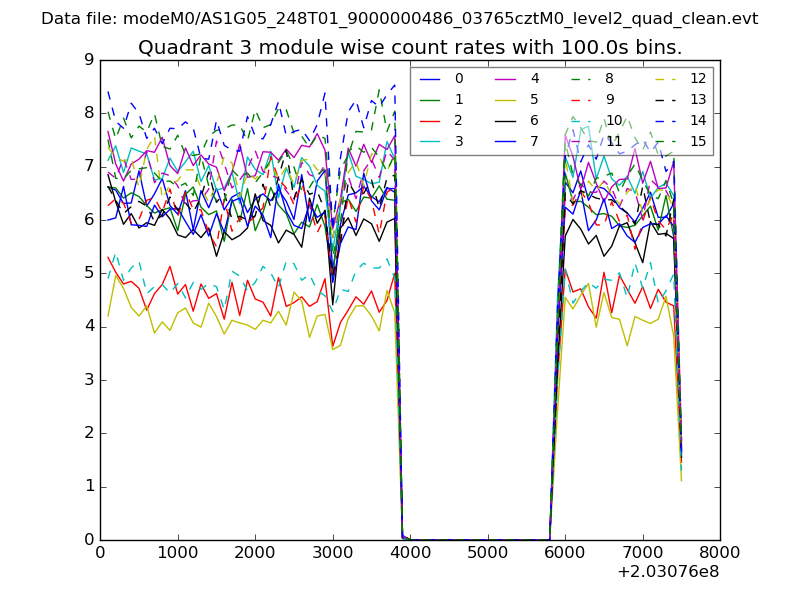
| Module-wise count rates for Quadrant C Data is divided into 100 sec bins |
 |
 |
| Module-wise count rates for Quadrant D Data is divided into 100 sec bins |
 |
 |
| Parameter | Plot |
|---|---|
| CZT HV Monitor | 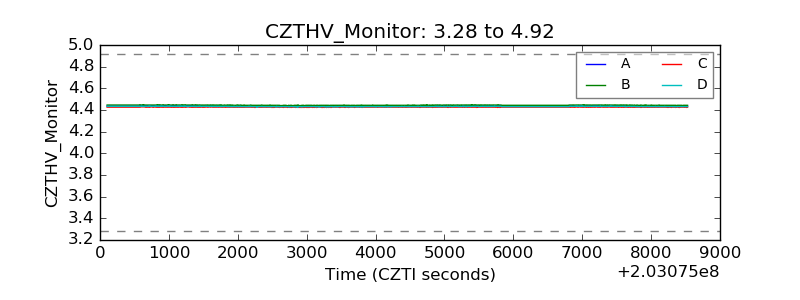 |
| D_VDD | 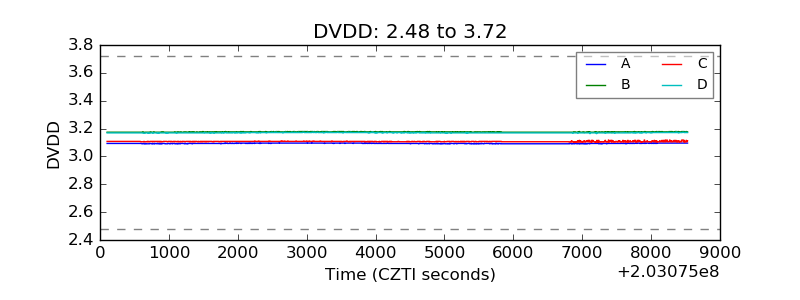 |
| Temperature 1 | 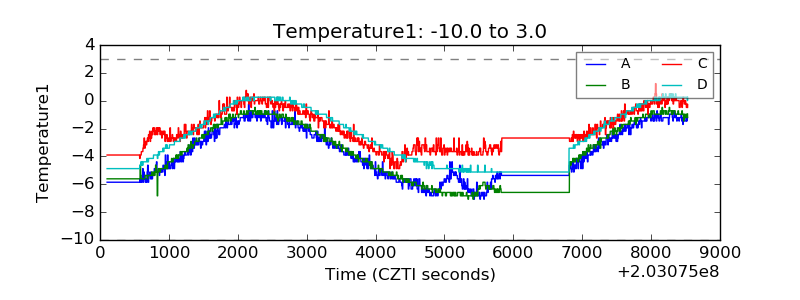 |
| Veto HV Monitor | 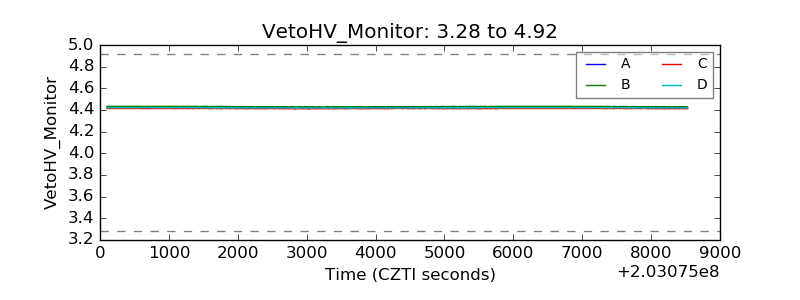 |
| Veto LLD | 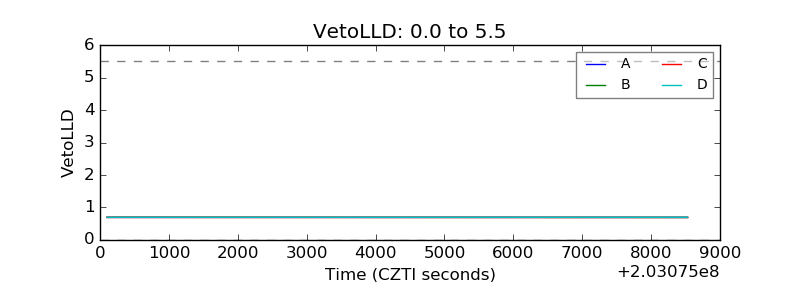 |
| Alpha Counter | 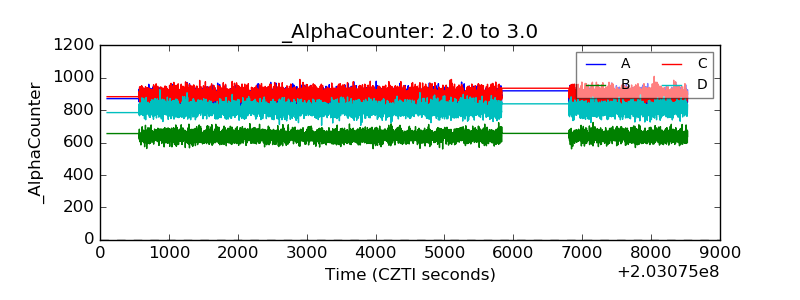 |
| _CPM_Rate | 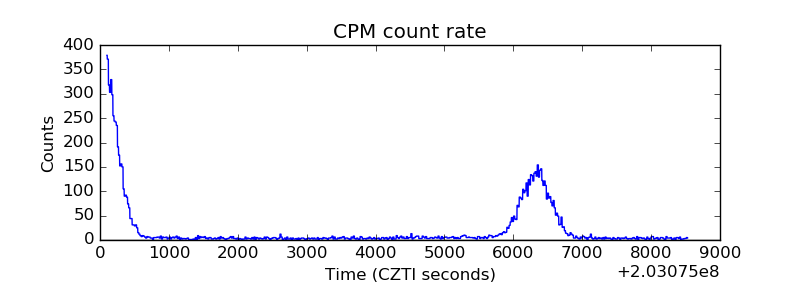 |
| CZT Counter | 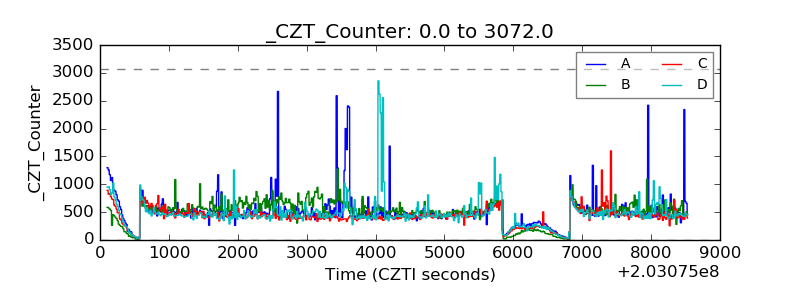 |
| +2.5 Volts monitor |  |
| +5 Volts monitor |  |
| Veto Counter | 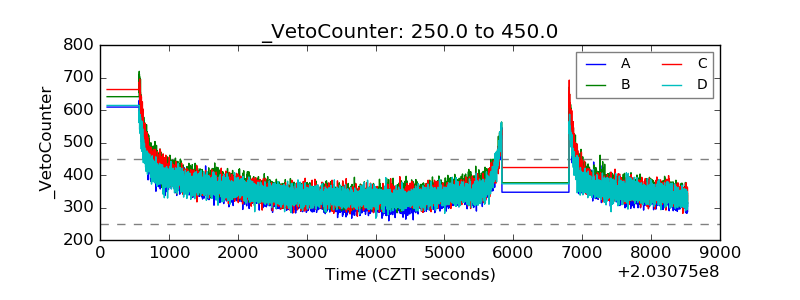 |