| Param | Original file | Final file |
|---|---|---|
| Filename | modeM0/AS1G05_248T01_9000000486_03766cztM0_level2.evt | modeM0/AS1G05_248T01_9000000486_03766cztM0_level2_quad_clean.evt |
| Size (bytes) | 478,169,280 | 81,118,080 |
| Size | 456.0 MB | 77.4 MB |
| Events in quadrant A | 4,156,843 | 500,824 |
| Events in quadrant B | 3,354,969 | 508,565 |
| Events in quadrant C | 2,990,598 | 499,514 |
| Events in quadrant D | 3,526,395 | 483,044 |
| Mode SS | |||
|---|---|---|---|
| Quadrant | BADHDUFLAG | Total packets | Discarded packets |
| A | 0 | 136 | 0 |
| B | 0 | 136 | 0 |
| C | 0 | 136 | 0 |
| D | 0 | 136 | 0 |
| Mode M9 | |||
|---|---|---|---|
| Quadrant | BADHDUFLAG | Total packets | Discarded packets |
| A | 0 | 6 | 0 |
| B | 0 | 6 | 0 |
| C | 0 | 6 | 0 |
| D | 0 | 6 | 0 |
| Mode M0 | |||
|---|---|---|---|
| Quadrant | BADHDUFLAG | Total packets | Discarded packets |
| A | 0 | 16911 | 2 |
| B | 0 | 14335 | 1 |
| C | 0 | 13628 | 1 |
| D | 0 | 15172 | 1 |
| Quadrant | Total seconds | Saturated seconds | Saturation percentage |
|---|---|---|---|
| A | 6657 | 365 | 5.482950% |
| B | 6657 | 73 | 1.096590% |
| C | 6657 | 55 | 0.826198% |
| D | 6657 | 135 | 2.027941% |
Noise dominated data is calculated using 1-second bins in cleaned event files. If a bin has >2000 counts, and if more than 50% of those come from <1% of pixels, then it is considered to be noise-dominated and hence unusable.
| Quadrant | # 1 sec bins | Bins with >0 counts | Bins with >2000 counts | High rate bins dominated by noise | Noise dominated (total time) | Noise dominated (detector-on time) | Marked lightcurve |
|---|---|---|---|---|---|---|---|
| A | 7257 | 6658 | 191 | 191 | 2.63% | 2.87% | 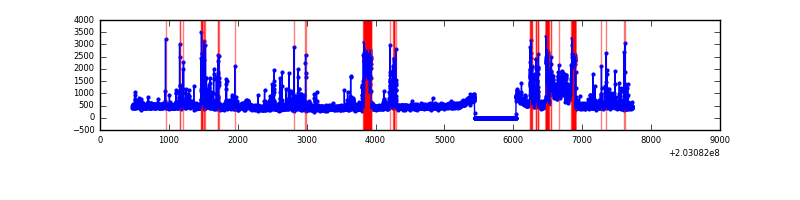 |
| B | 7257 | 6658 | 9 | 9 | 0.12% | 0.14% | 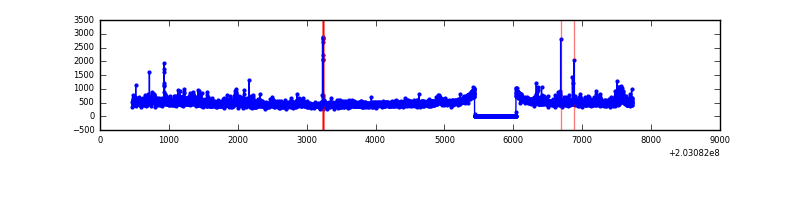 |
| C | 7257 | 6658 | 0 | 0 | 0.00% | 0.00% | 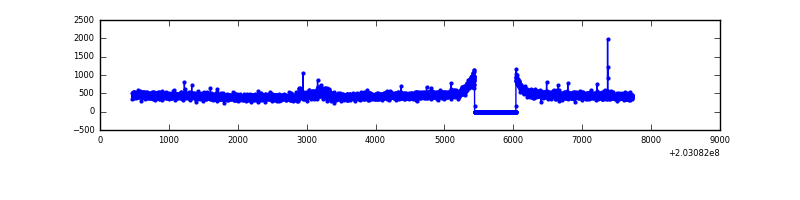 |
| D | 7257 | 6658 | 48 | 48 | 0.66% | 0.72% | 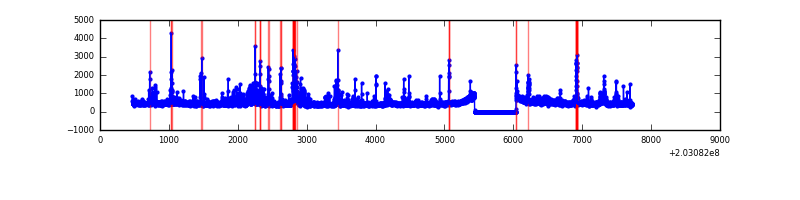 |
Top three noisy pixels from each quadrant. If the there are fewer than three noisy pixels in the level2.evt file, extra rows are filled as -1
| Pixel properties | Quadrant properties | ||||||
|---|---|---|---|---|---|---|---|
| Quadrant | DetID | PixID | Counts | Sigma | Mean | Median | Sigma |
| A | 0 | 118 | 638456 | 4090.89 | 754 | 736 | 155.9 |
| A | 13 | 251 | 481211 | 3082.18 | 754 | 736 | 155.9 |
| A | 0 | 226 | 63821 | 404.68 | 754 | 736 | 155.9 |
| B | 15 | 204 | 214621 | 1421.54 | 774 | 755 | 150.4 |
| B | 15 | 54 | 51686 | 338.53 | 774 | 755 | 150.4 |
| B | 5 | 172 | 24169 | 155.63 | 774 | 755 | 150.4 |
| C | 2 | 53 | 40115 | 224.51 | 746 | 749 | 175.3 |
| C | 8 | 128 | 12026 | 64.31 | 746 | 749 | 175.3 |
| C | 8 | 112 | 6861 | 34.86 | 746 | 749 | 175.3 |
| D | 8 | 112 | 205152 | 1142.3 | 745 | 724 | 179.0 |
| D | 2 | 37 | 181711 | 1011.32 | 745 | 724 | 179.0 |
| D | 13 | 223 | 83095 | 460.27 | 745 | 724 | 179.0 |
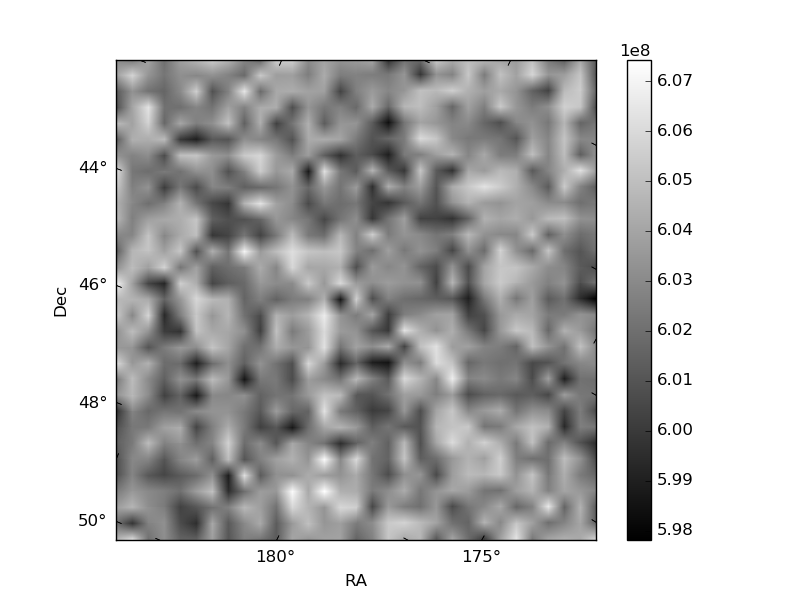
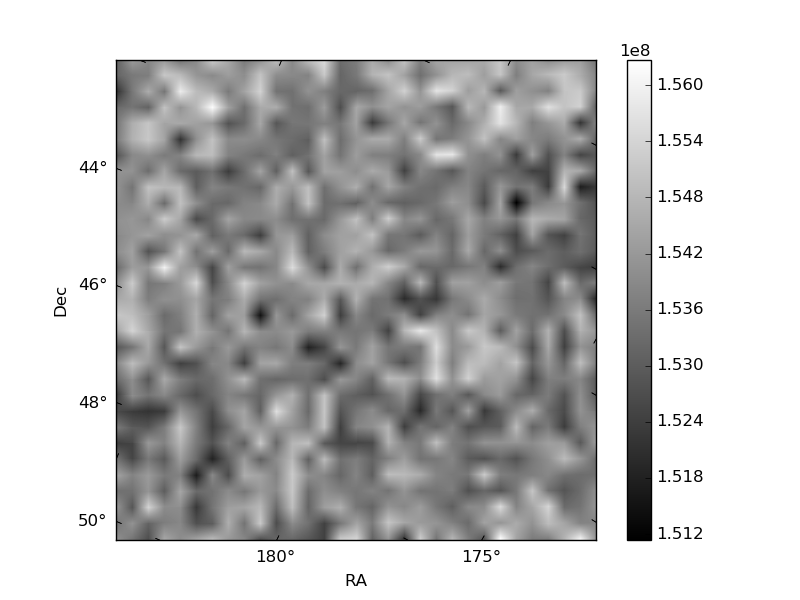
Histogram calculated using DETX and DETY for each event in the final _common_clean file
| Quadrant A | 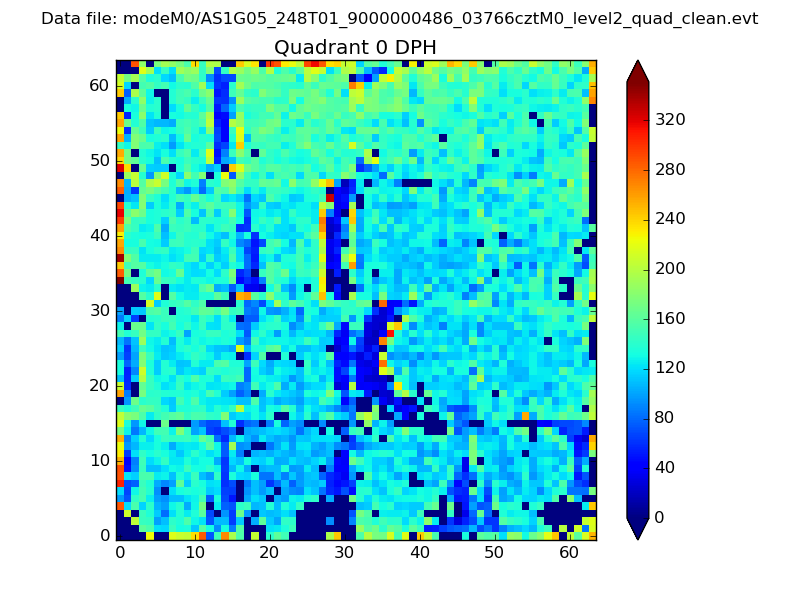 |
 |
Quadrant B |
|---|---|---|---|
| Quadrant D | 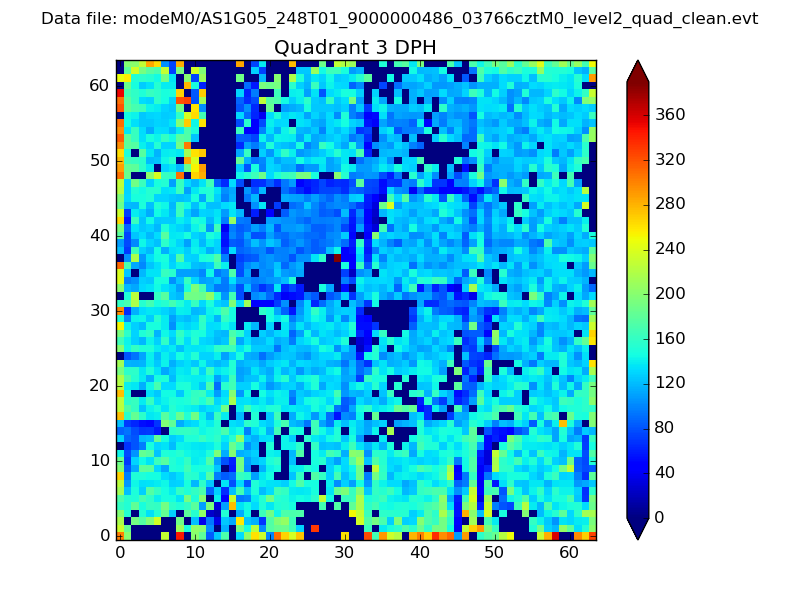 |
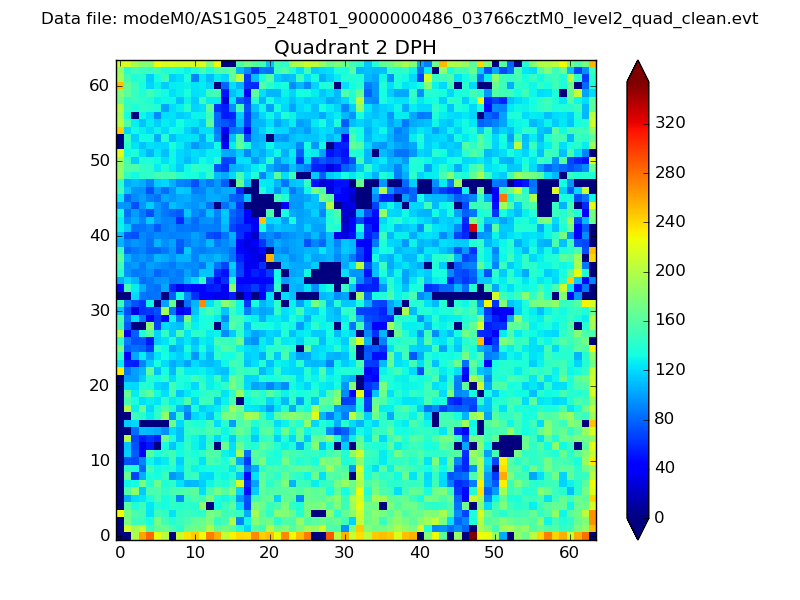 |
Quadrant C |
| Plot type | Count rate plots | Images |
|---|---|---|
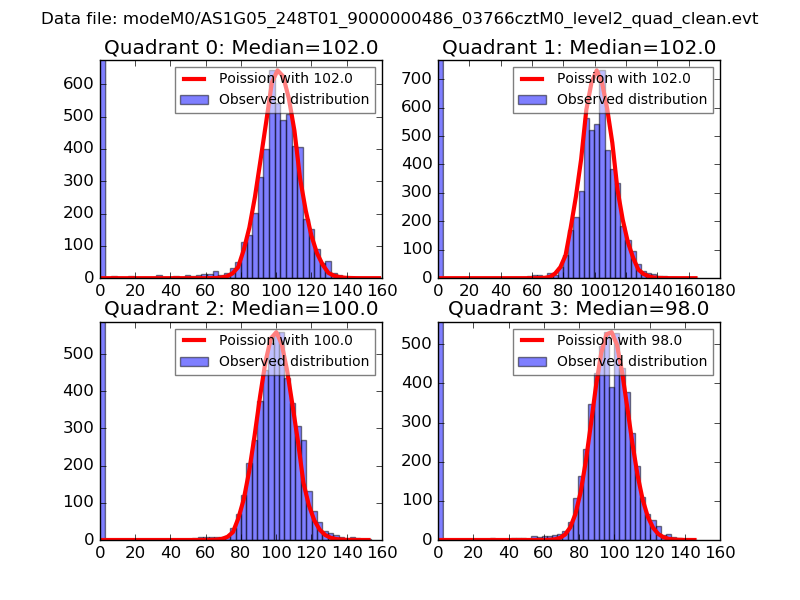
| Comparison with Poisson distribution Blue bars denote a histogram of data divided into 1 sec bins. Red curve is a Poisson curve with rate = median count rate of data. |
 |
 |
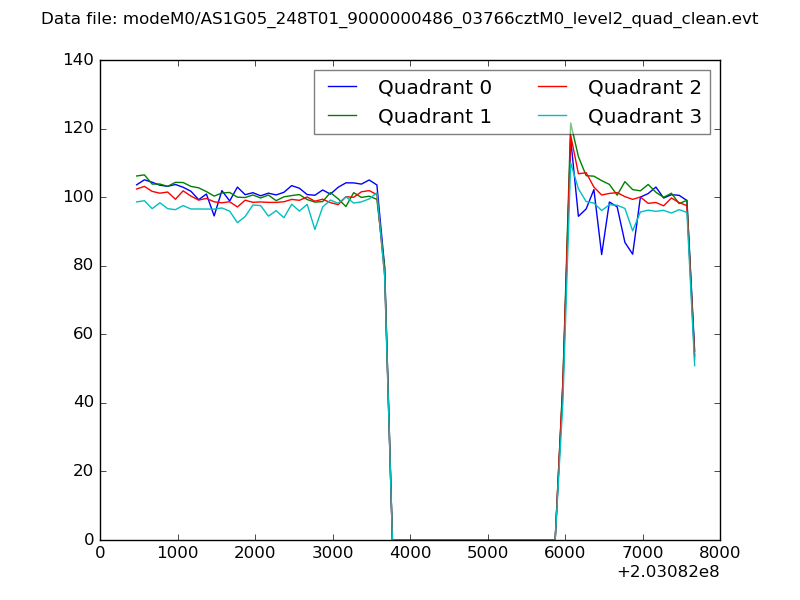
| Quadrant-wise count rates Data is divided into 100 sec bins |
 |
|
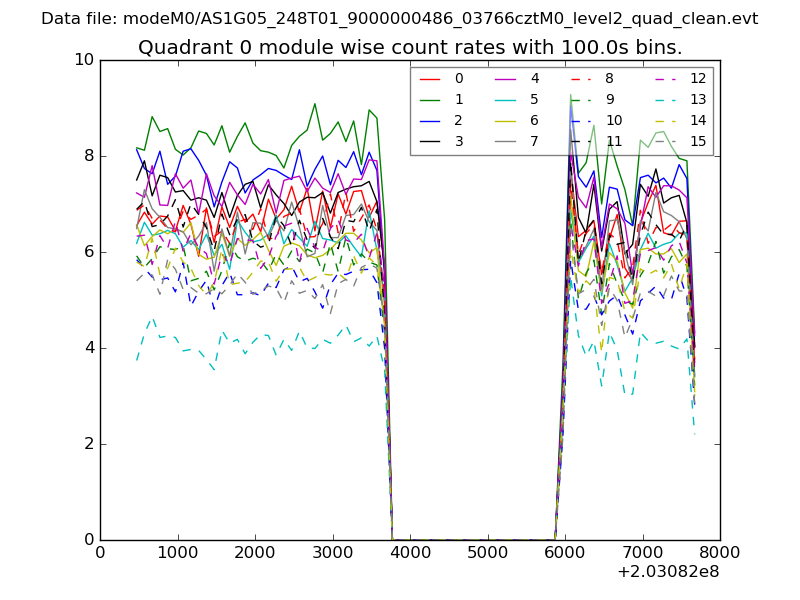
| Module-wise count rates for Quadrant A Data is divided into 100 sec bins |
 |
 |
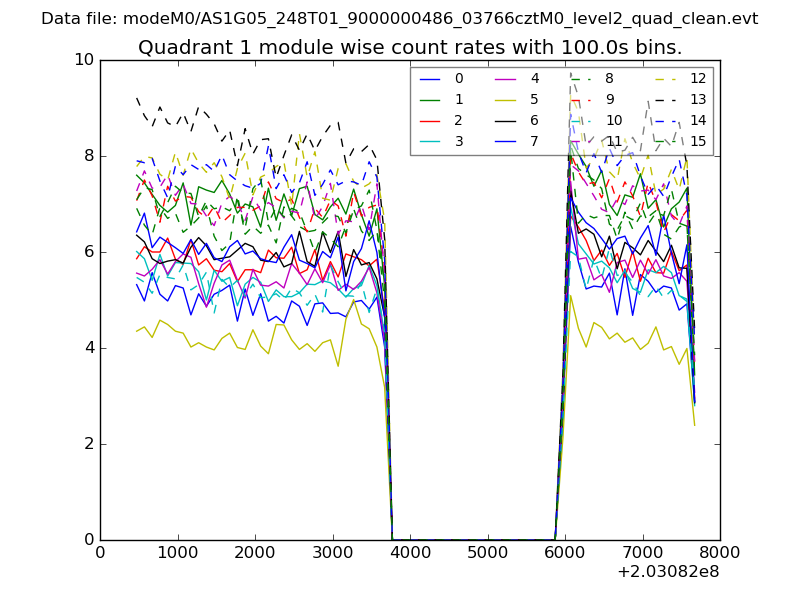
| Module-wise count rates for Quadrant B Data is divided into 100 sec bins |
 |
 |
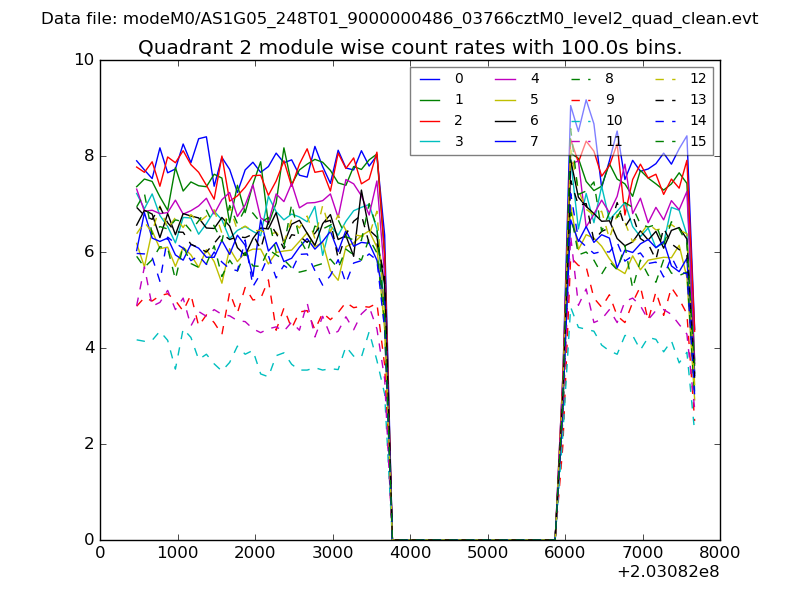
| Module-wise count rates for Quadrant C Data is divided into 100 sec bins |
 |
 |
| Module-wise count rates for Quadrant D Data is divided into 100 sec bins |
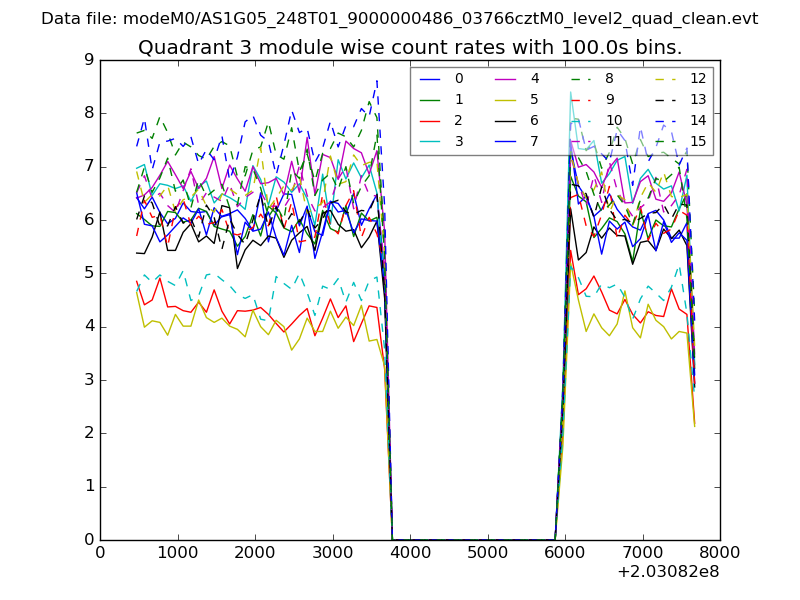 |
 |
| Parameter | Plot |
|---|---|
| CZT HV Monitor | 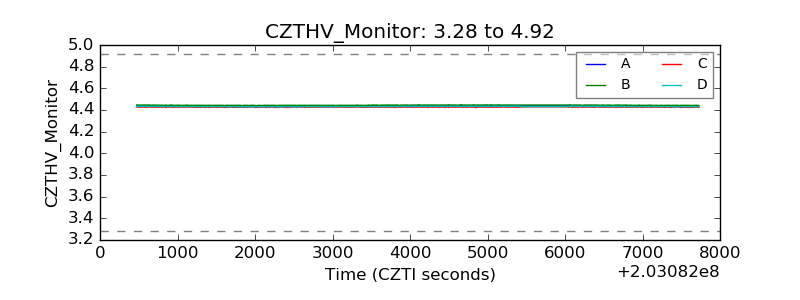 |
| D_VDD | 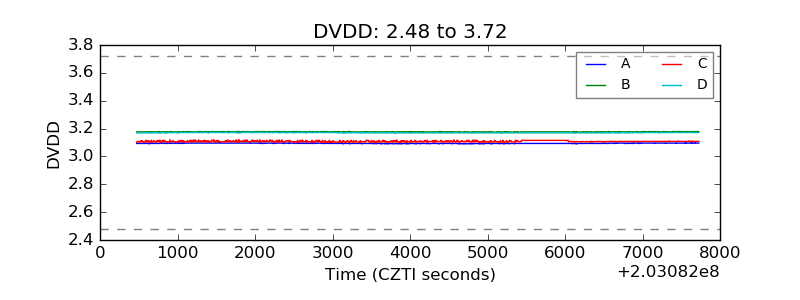 |
| Temperature 1 | 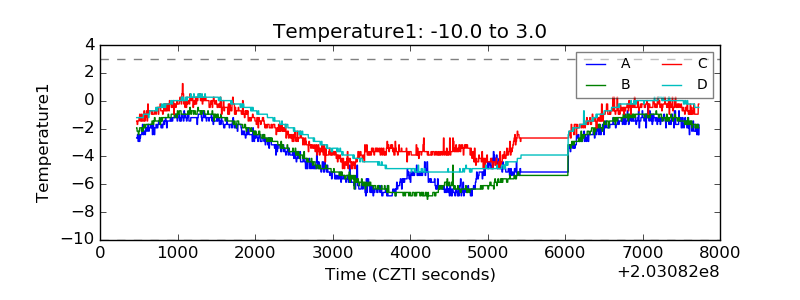 |
| Veto HV Monitor | 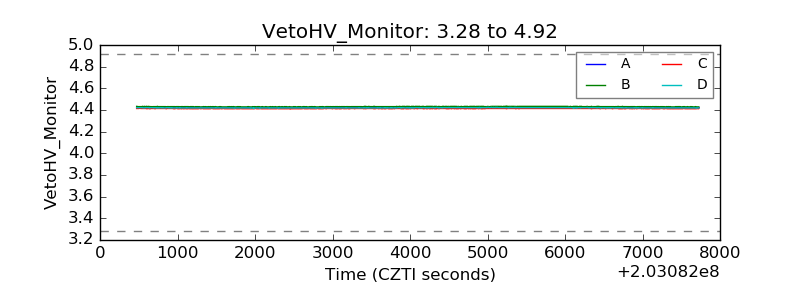 |
| Veto LLD | 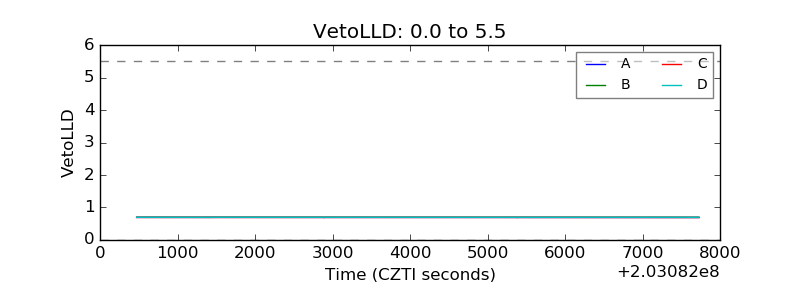 |
| Alpha Counter | 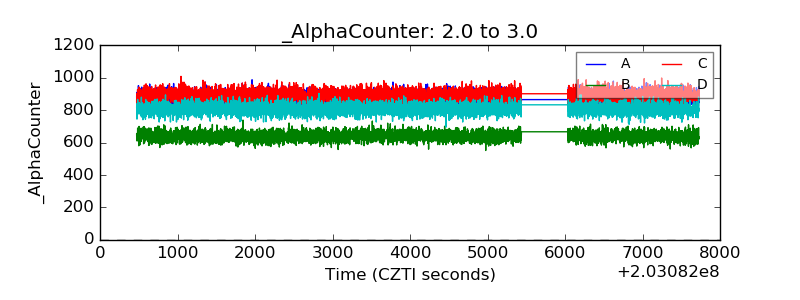 |
| _CPM_Rate | 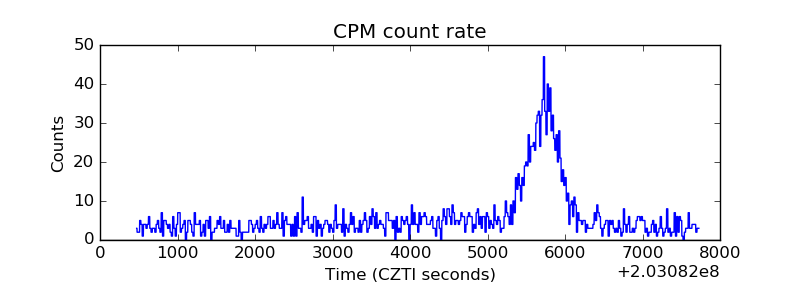 |
| CZT Counter | 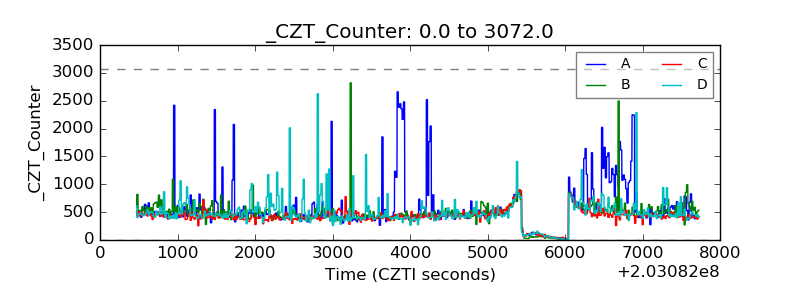 |
| +2.5 Volts monitor | 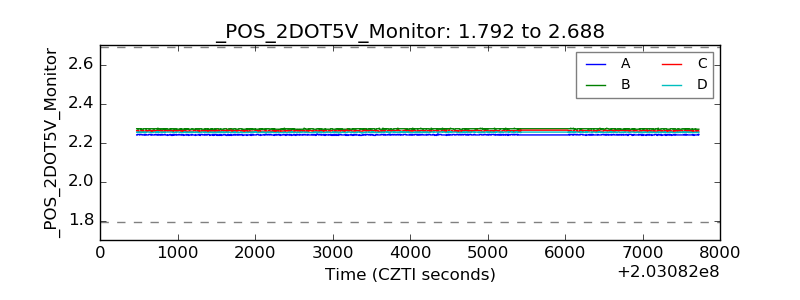 |
| +5 Volts monitor |  |
| Veto Counter | 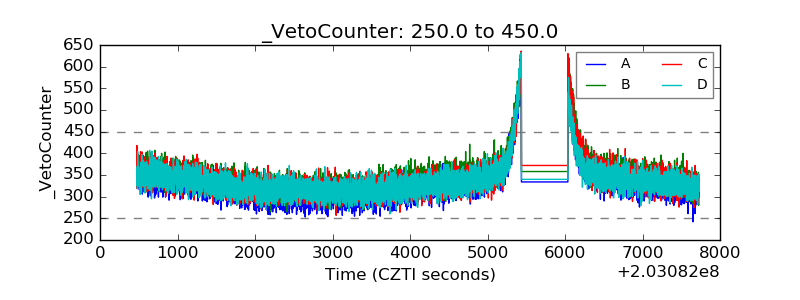 |