| Param | Original file | Final file |
|---|---|---|
| Filename | modeM0/AS1G05_248T01_9000000486_03767cztM0_level2.evt | modeM0/AS1G05_248T01_9000000486_03767cztM0_level2_quad_clean.evt |
| Size (bytes) | 532,748,160 | 87,707,520 |
| Size | 508.1 MB | 83.6 MB |
| Events in quadrant A | 4,420,579 | 536,812 |
| Events in quadrant B | 4,033,711 | 544,461 |
| Events in quadrant C | 3,357,792 | 538,480 |
| Events in quadrant D | 3,820,638 | 521,894 |
| Mode SS | |||
|---|---|---|---|
| Quadrant | BADHDUFLAG | Total packets | Discarded packets |
| A | 0 | 150 | 0 |
| B | 0 | 150 | 0 |
| C | 0 | 150 | 0 |
| D | 0 | 150 | 0 |
| Mode M9 | |||
|---|---|---|---|
| Quadrant | BADHDUFLAG | Total packets | Discarded packets |
| A | 0 | 2 | 0 |
| B | 0 | 2 | 0 |
| C | 0 | 2 | 0 |
| D | 0 | 2 | 0 |
| Mode M0 | |||
|---|---|---|---|
| Quadrant | BADHDUFLAG | Total packets | Discarded packets |
| A | 0 | 18240 | 2 |
| B | 0 | 16887 | 1 |
| C | 0 | 15408 | 1 |
| D | 0 | 16609 | 1 |
| Quadrant | Total seconds | Saturated seconds | Saturation percentage |
|---|---|---|---|
| A | 7386 | 306 | 4.142973% |
| B | 7386 | 135 | 1.827782% |
| C | 7386 | 62 | 0.839426% |
| D | 7386 | 127 | 1.719469% |
Noise dominated data is calculated using 1-second bins in cleaned event files. If a bin has >2000 counts, and if more than 50% of those come from <1% of pixels, then it is considered to be noise-dominated and hence unusable.
| Quadrant | # 1 sec bins | Bins with >0 counts | Bins with >2000 counts | High rate bins dominated by noise | Noise dominated (total time) | Noise dominated (detector-on time) | Marked lightcurve |
|---|---|---|---|---|---|---|---|
| A | 7591 | 7388 | 149 | 149 | 1.96% | 2.02% | 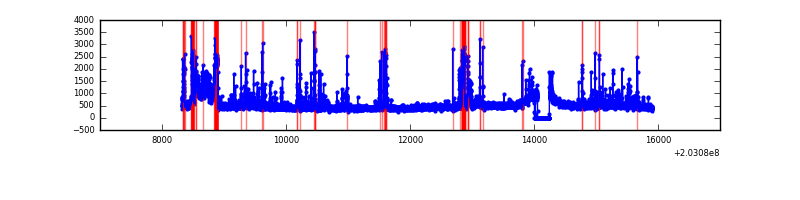 |
| B | 7591 | 7388 | 6 | 6 | 0.08% | 0.08% | 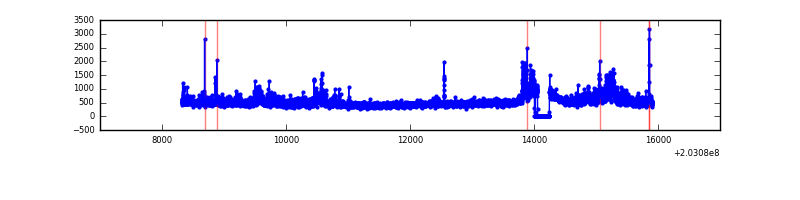 |
| C | 7591 | 7388 | 7 | 7 | 0.09% | 0.09% | 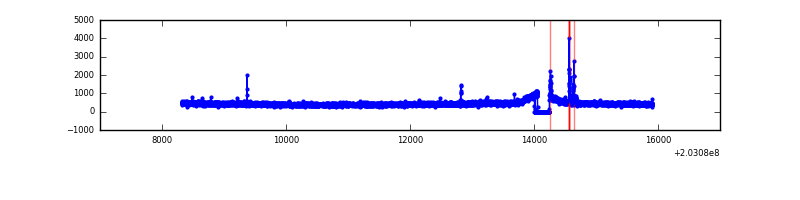 |
| D | 7591 | 7388 | 67 | 67 | 0.88% | 0.91% |  |
Top three noisy pixels from each quadrant. If the there are fewer than three noisy pixels in the level2.evt file, extra rows are filled as -1
| Pixel properties | Quadrant properties | ||||||
|---|---|---|---|---|---|---|---|
| Quadrant | DetID | PixID | Counts | Sigma | Mean | Median | Sigma |
| A | 13 | 251 | 580287 | 3300.2 | 850 | 831 | 175.6 |
| A | 0 | 118 | 389231 | 2212.07 | 850 | 831 | 175.6 |
| A | 0 | 50 | 70206 | 395.11 | 850 | 831 | 175.6 |
| B | 15 | 204 | 462116 | 2727.58 | 866 | 845 | 169.1 |
| B | 7 | 252 | 85028 | 497.79 | 866 | 845 | 169.1 |
| B | 15 | 54 | 42982 | 249.16 | 866 | 845 | 169.1 |
| C | 9 | 247 | 56962 | 284.22 | 837 | 839 | 197.5 |
| C | 10 | 34 | 10501 | 48.93 | 837 | 839 | 197.5 |
| C | 12 | 4 | 9676 | 44.75 | 837 | 839 | 197.5 |
| D | 8 | 112 | 190072 | 928.31 | 837 | 810 | 203.9 |
| D | 3 | 247 | 123528 | 601.92 | 837 | 810 | 203.9 |
| D | 13 | 223 | 88625 | 430.72 | 837 | 810 | 203.9 |
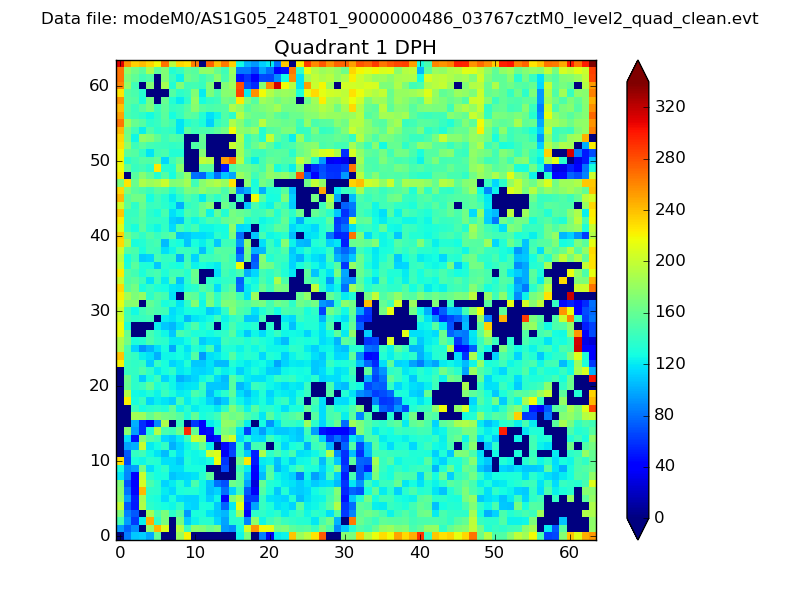
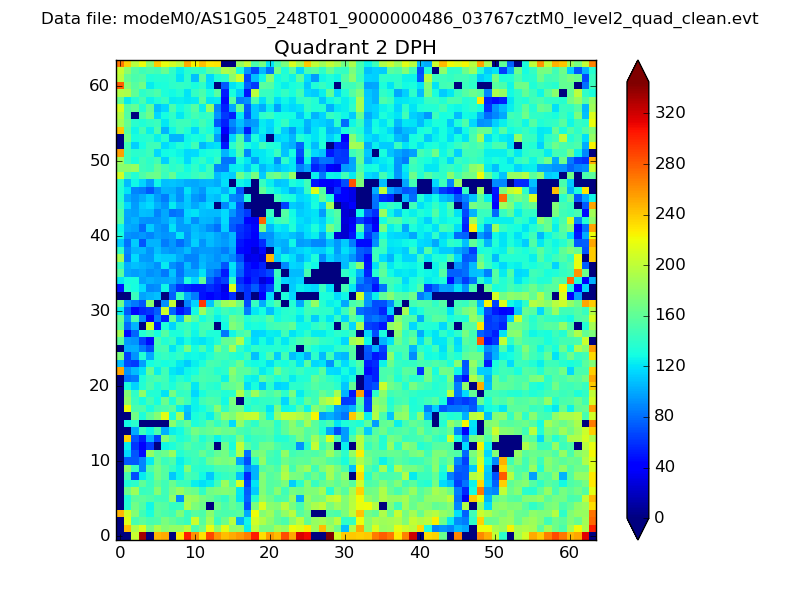
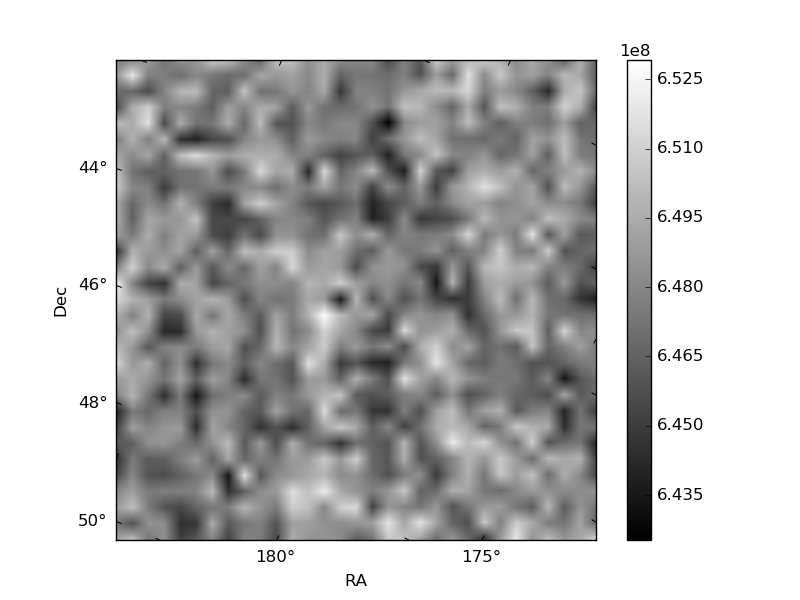
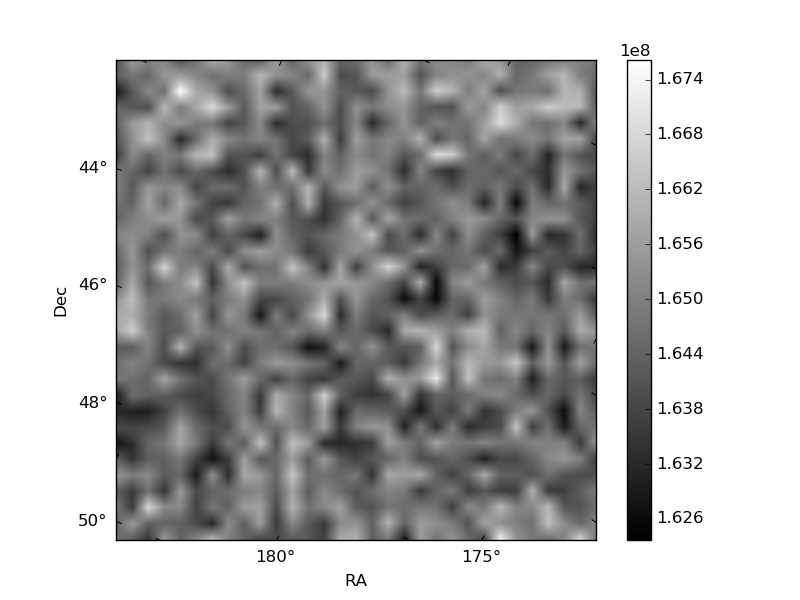
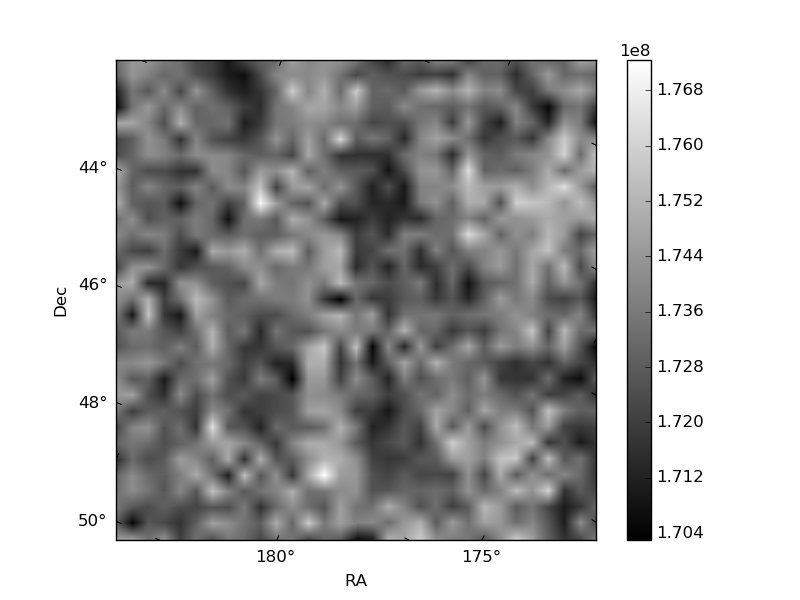
Histogram calculated using DETX and DETY for each event in the final _common_clean file
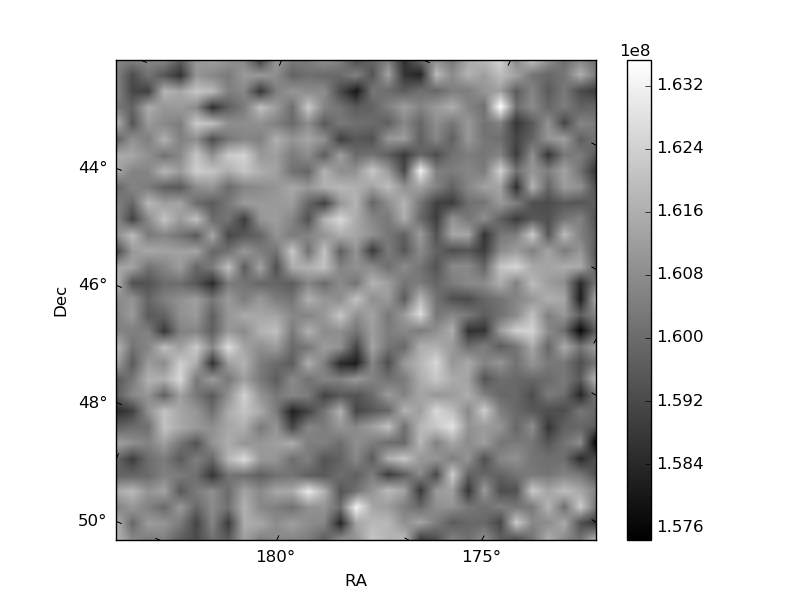
| Quadrant A | 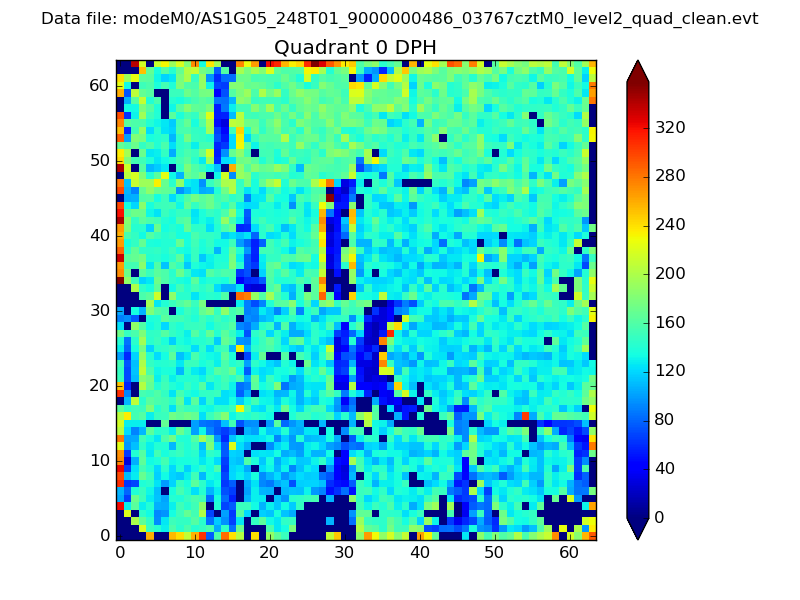 |
 |
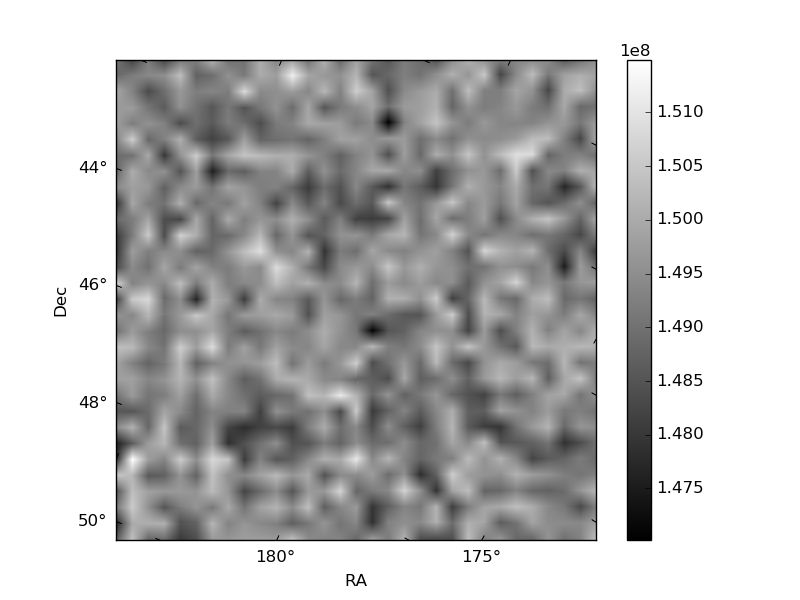
Quadrant B |
|---|---|---|---|
| Quadrant D | 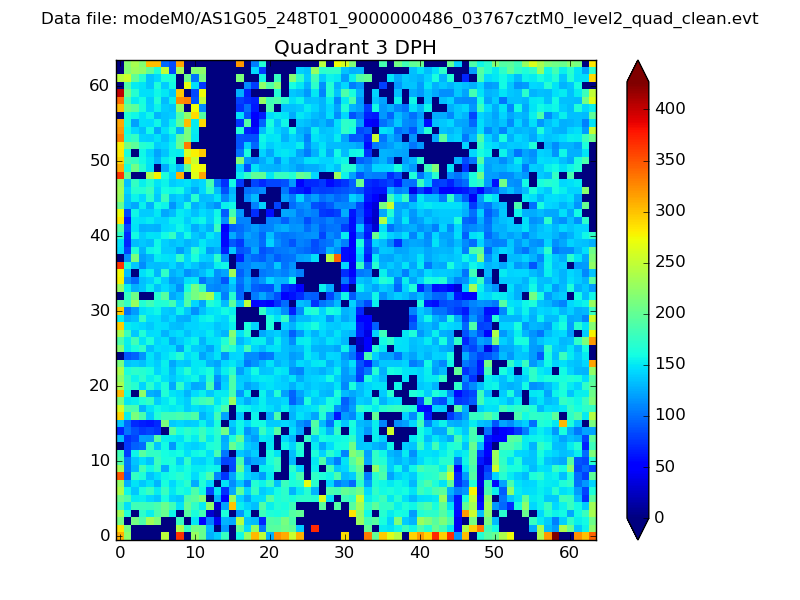 |
 |
Quadrant C |
| Plot type | Count rate plots | Images |
|---|---|---|
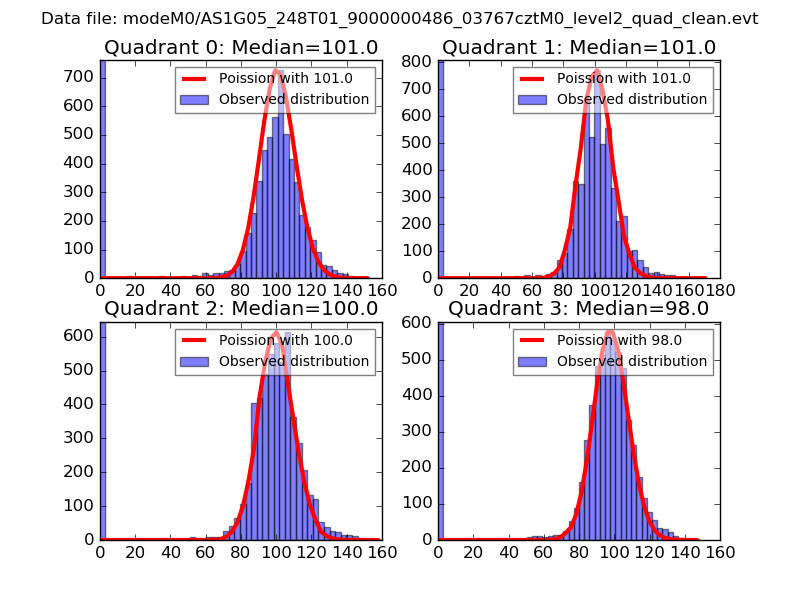
| Comparison with Poisson distribution Blue bars denote a histogram of data divided into 1 sec bins. Red curve is a Poisson curve with rate = median count rate of data. |
 |
 |
| Quadrant-wise count rates Data is divided into 100 sec bins |
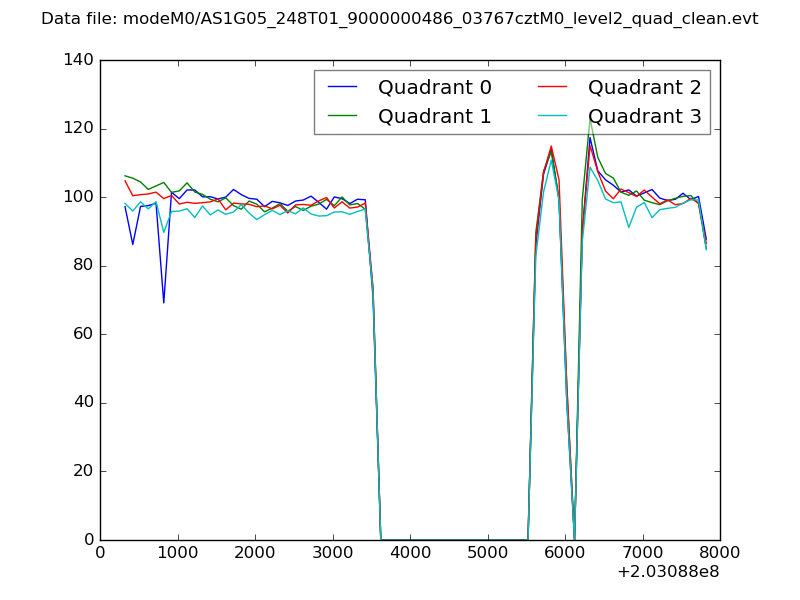 |
|
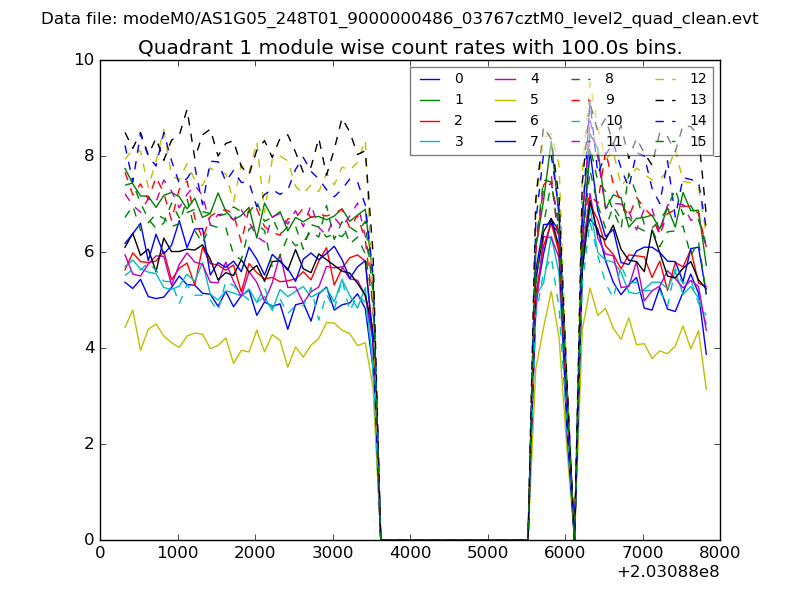
| Module-wise count rates for Quadrant A Data is divided into 100 sec bins |
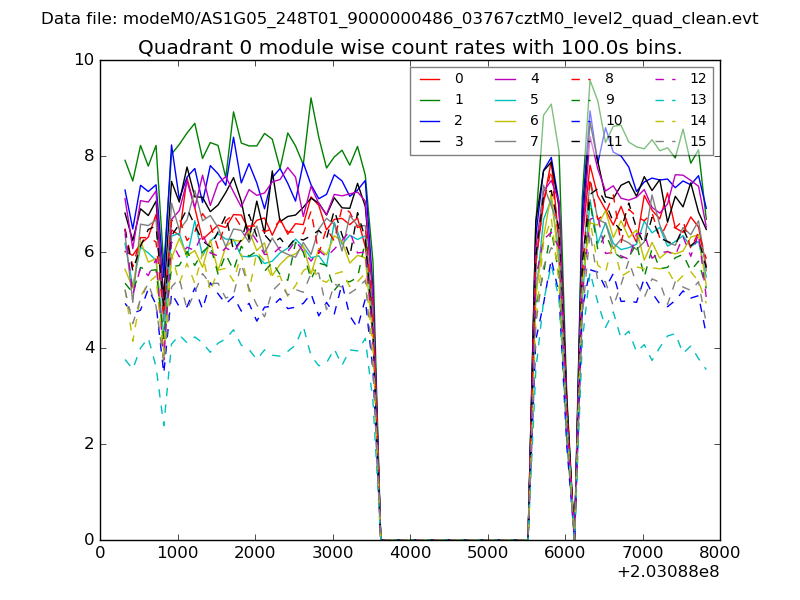 |
 |
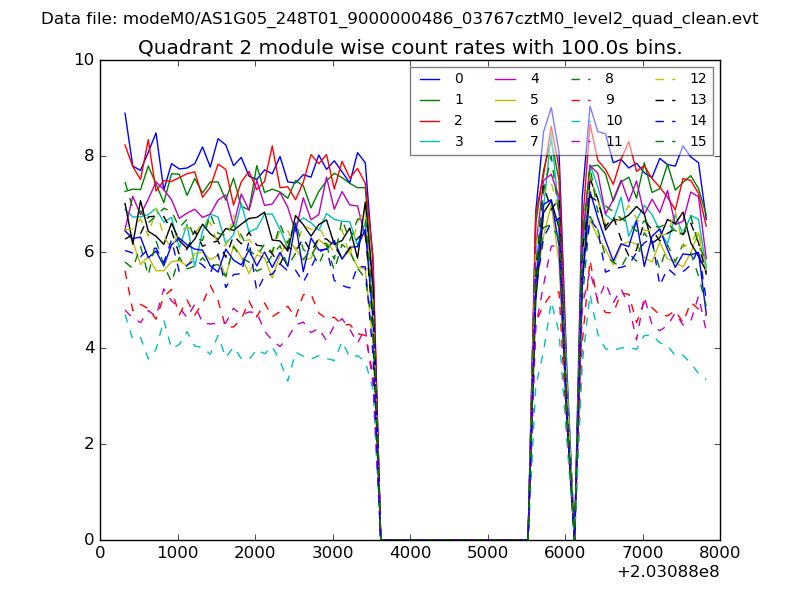
| Module-wise count rates for Quadrant B Data is divided into 100 sec bins |
 |
 |
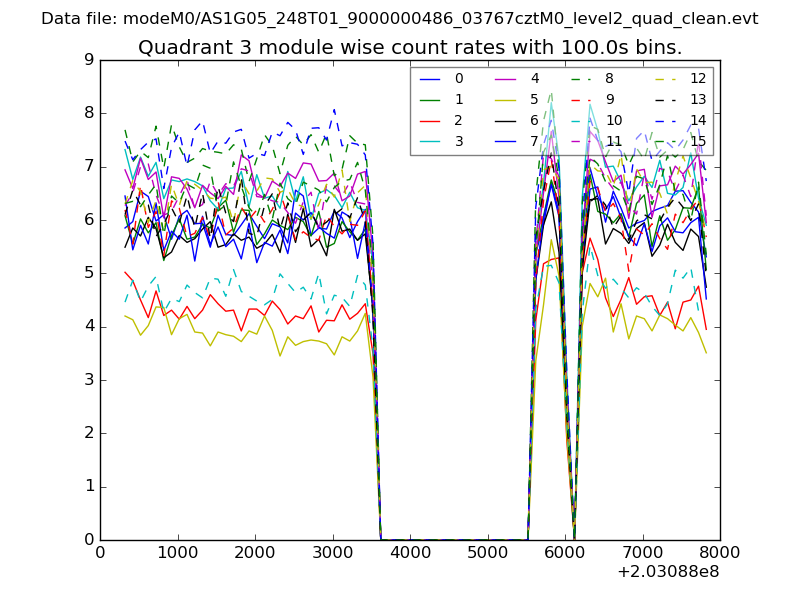
| Module-wise count rates for Quadrant C Data is divided into 100 sec bins |
 |
 |
| Module-wise count rates for Quadrant D Data is divided into 100 sec bins |
 |
 |
| Parameter | Plot |
|---|---|
| CZT HV Monitor | 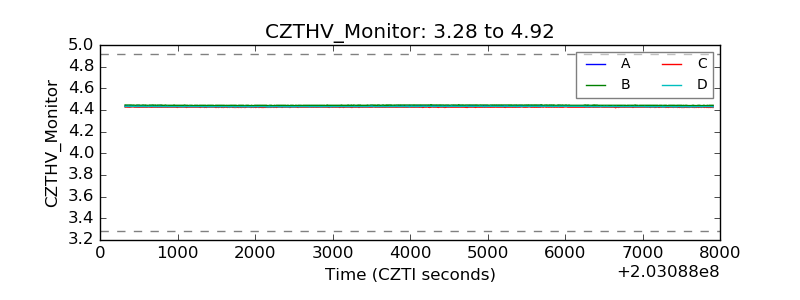 |
| D_VDD | 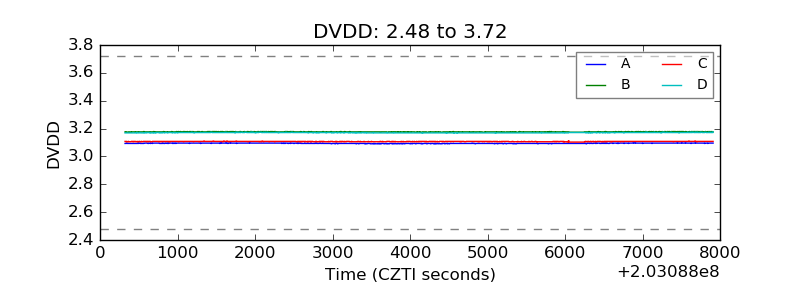 |
| Temperature 1 | 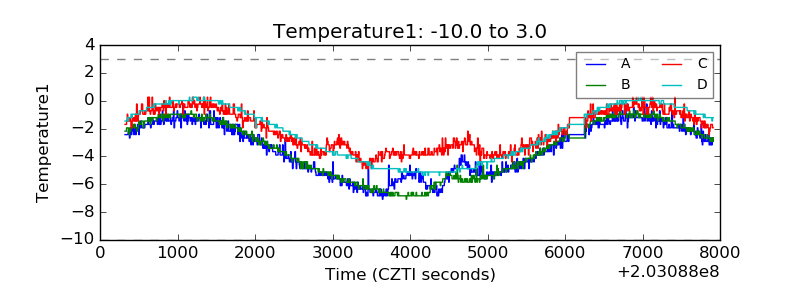 |
| Veto HV Monitor | 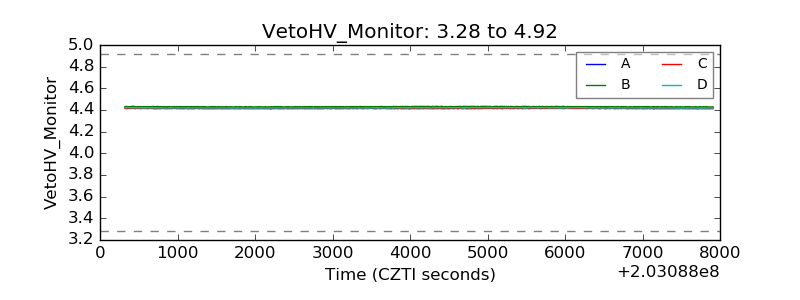 |
| Veto LLD | 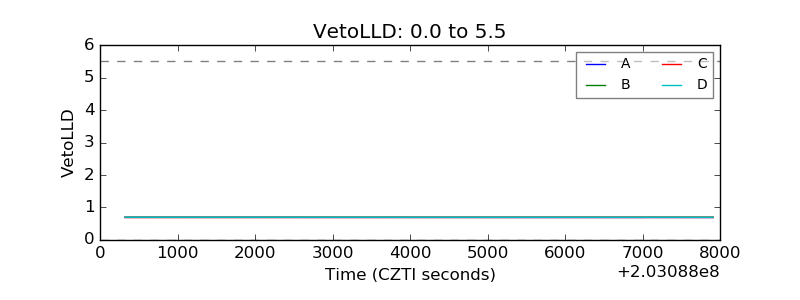 |
| Alpha Counter | 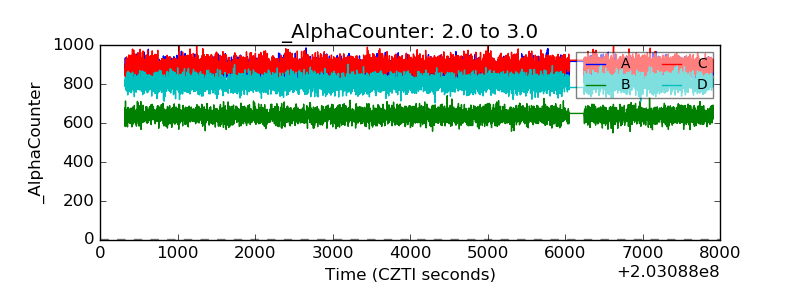 |
| _CPM_Rate | 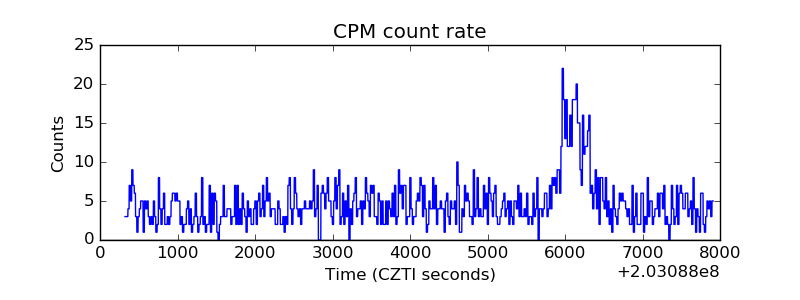 |
| CZT Counter | 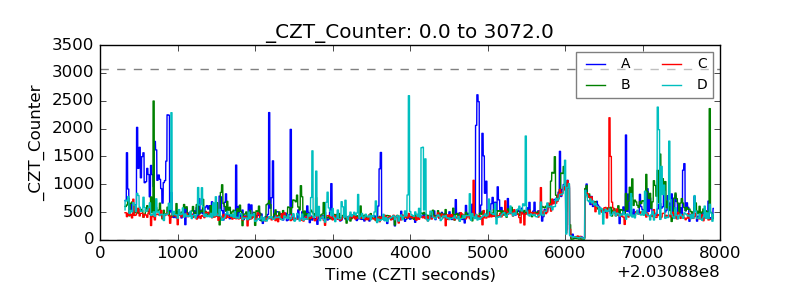 |
| +2.5 Volts monitor |  |
| +5 Volts monitor |  |
| Veto Counter | 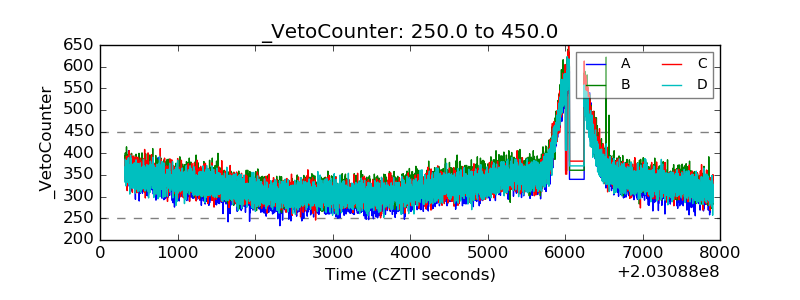 |