| Param | Original file | Final file |
|---|---|---|
| Filename | modeM0/AS1G05_248T01_9000000486_03768cztM0_level2.evt | modeM0/AS1G05_248T01_9000000486_03768cztM0_level2_quad_clean.evt |
| Size (bytes) | 501,442,560 | 83,730,240 |
| Size | 478.2 MB | 79.9 MB |
| Events in quadrant A | 4,278,275 | 509,073 |
| Events in quadrant B | 3,731,356 | 516,974 |
| Events in quadrant C | 3,128,273 | 513,409 |
| Events in quadrant D | 3,564,400 | 499,704 |
| Mode SS | |||
|---|---|---|---|
| Quadrant | BADHDUFLAG | Total packets | Discarded packets |
| A | 0 | 144 | 0 |
| B | 0 | 144 | 0 |
| C | 0 | 144 | 0 |
| D | 0 | 144 | 0 |
| Mode M9 | |||
|---|---|---|---|
| Quadrant | BADHDUFLAG | Total packets | Discarded packets |
| A | 0 | 2 | 0 |
| B | 0 | 2 | 0 |
| C | 0 | 2 | 0 |
| D | 0 | 2 | 0 |
| Mode M0 | |||
|---|---|---|---|
| Quadrant | BADHDUFLAG | Total packets | Discarded packets |
| A | 0 | 17666 | 2 |
| B | 0 | 15836 | 1 |
| C | 0 | 14605 | 1 |
| D | 0 | 15896 | 1 |
| Quadrant | Total seconds | Saturated seconds | Saturation percentage |
|---|---|---|---|
| A | 7129 | 237 | 3.324449% |
| B | 7129 | 77 | 1.080095% |
| C | 7129 | 25 | 0.350680% |
| D | 7129 | 79 | 1.108150% |
Noise dominated data is calculated using 1-second bins in cleaned event files. If a bin has >2000 counts, and if more than 50% of those come from <1% of pixels, then it is considered to be noise-dominated and hence unusable.
| Quadrant | # 1 sec bins | Bins with >0 counts | Bins with >2000 counts | High rate bins dominated by noise | Noise dominated (total time) | Noise dominated (detector-on time) | Marked lightcurve |
|---|---|---|---|---|---|---|---|
| A | 7309 | 7131 | 118 | 118 | 1.61% | 1.65% |  |
| B | 7309 | 7131 | 8 | 8 | 0.11% | 0.11% |  |
| C | 7309 | 7131 | 0 | 0 | 0.00% | 0.00% | 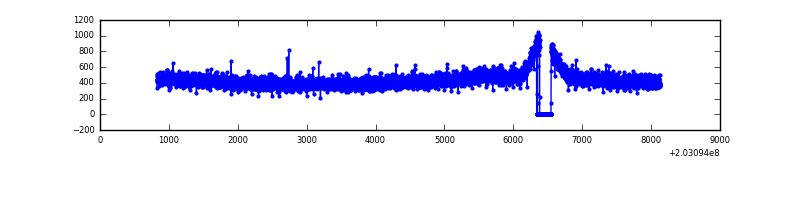 |
| D | 7309 | 7131 | 40 | 40 | 0.55% | 0.56% |  |
Top three noisy pixels from each quadrant. If the there are fewer than three noisy pixels in the level2.evt file, extra rows are filled as -1
| Pixel properties | Quadrant properties | ||||||
|---|---|---|---|---|---|---|---|
| Quadrant | DetID | PixID | Counts | Sigma | Mean | Median | Sigma |
| A | 0 | 118 | 756779 | 4496.32 | 811 | 790 | 168.1 |
| A | 13 | 251 | 260154 | 1542.59 | 811 | 790 | 168.1 |
| A | 0 | 226 | 75515 | 444.43 | 811 | 790 | 168.1 |
| B | 15 | 204 | 404309 | 2512.33 | 828 | 806 | 160.6 |
| B | 4 | 81 | 28264 | 170.96 | 828 | 806 | 160.6 |
| B | 15 | 54 | 15866 | 93.77 | 828 | 806 | 160.6 |
| C | 13 | 61 | 6622 | 30.93 | 798 | 801 | 188.2 |
| C | 12 | 4 | 4347 | 18.84 | 798 | 801 | 188.2 |
| C | 7 | 235 | 2287 | 7.9 | 798 | 801 | 188.2 |
| D | 1 | 84 | 159927 | 818.4 | 796 | 772 | 194.5 |
| D | 13 | 223 | 95063 | 484.86 | 796 | 772 | 194.5 |
| D | 8 | 112 | 75294 | 383.2 | 796 | 772 | 194.5 |
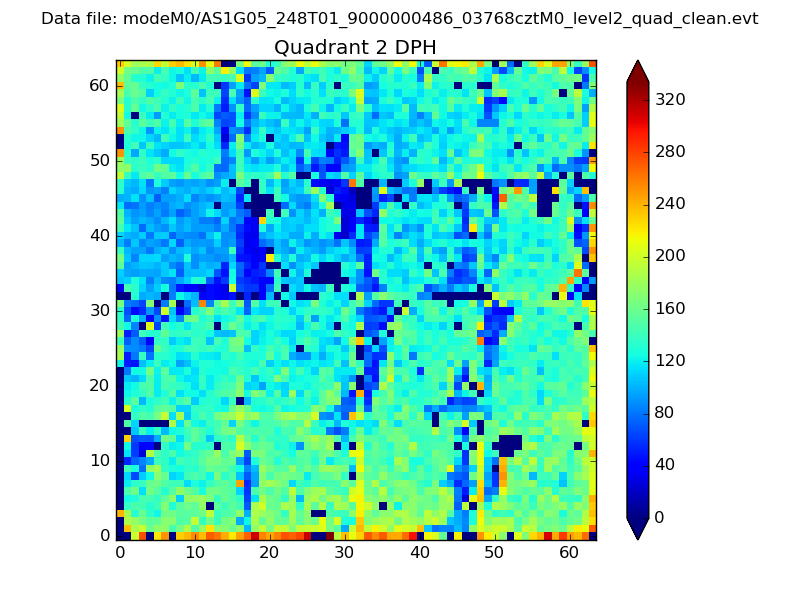
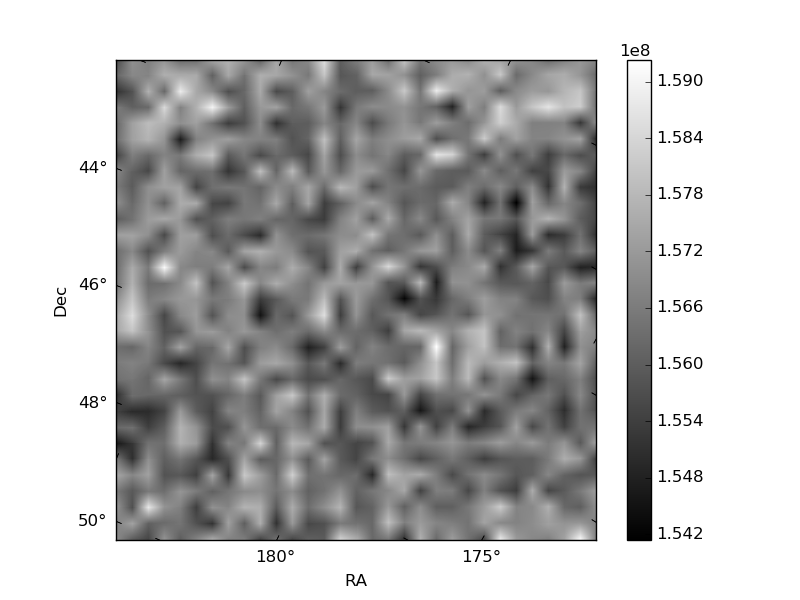
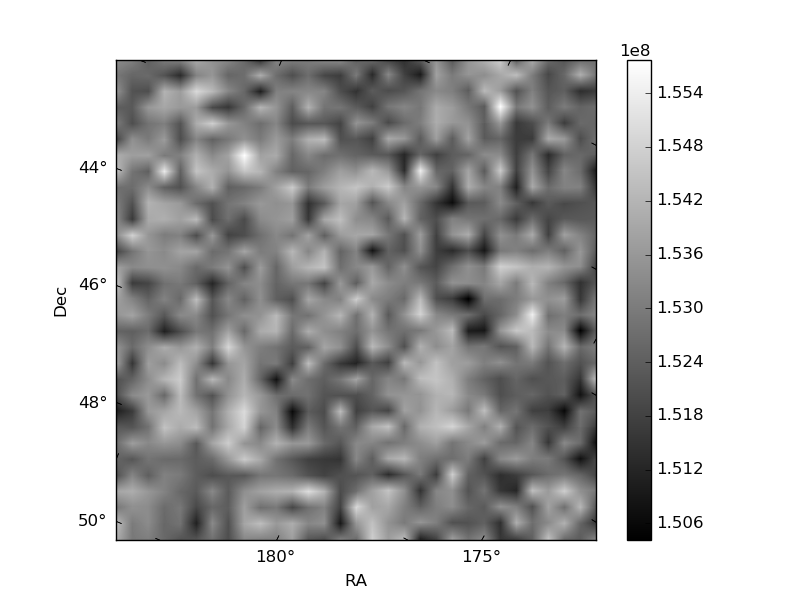
Histogram calculated using DETX and DETY for each event in the final _common_clean file
| Quadrant A | 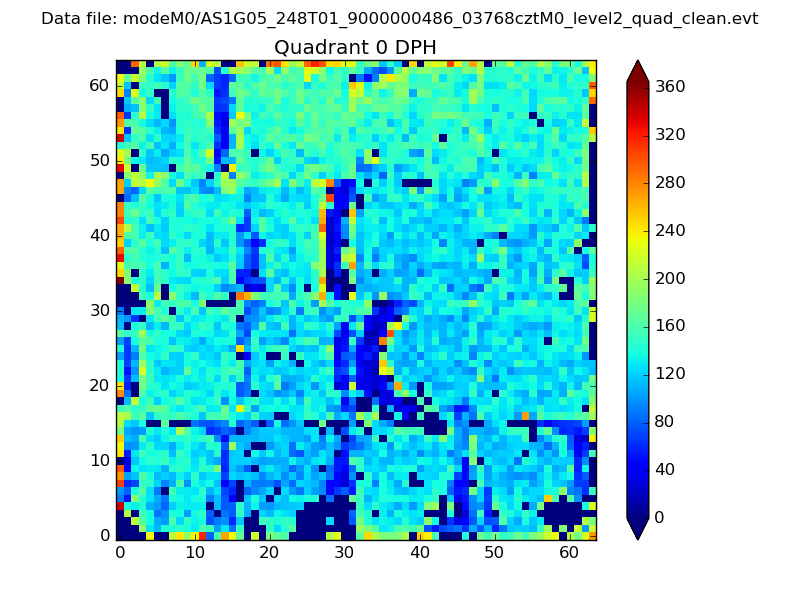 |
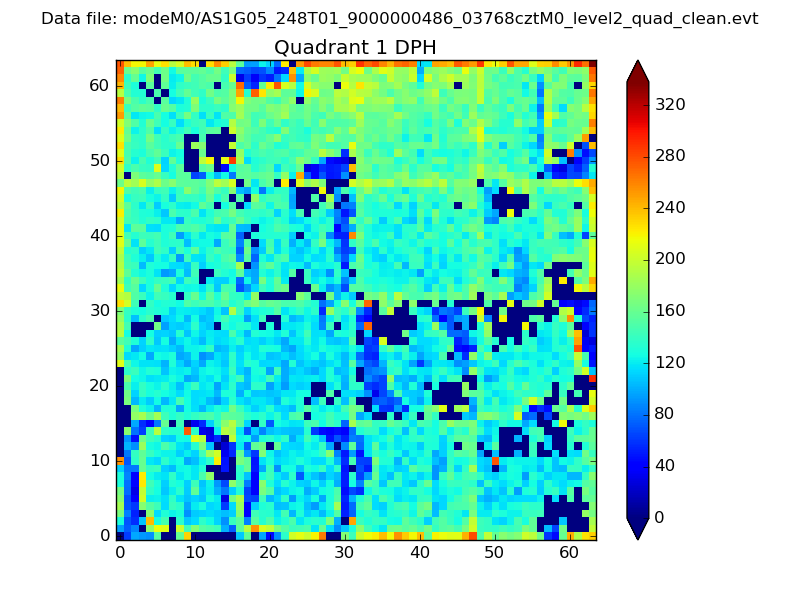 |
Quadrant B |
|---|---|---|---|
| Quadrant D | 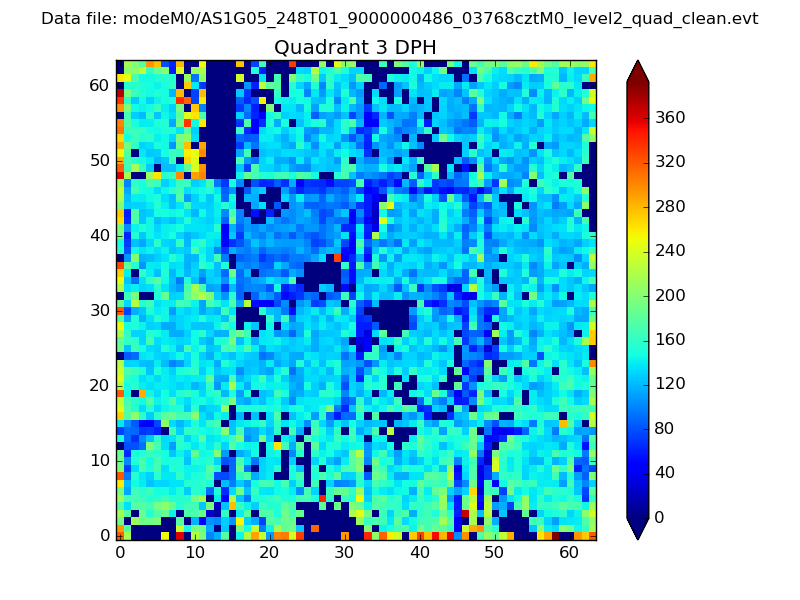 |
 |
Quadrant C |
| Plot type | Count rate plots | Images |
|---|---|---|
| Comparison with Poisson distribution Blue bars denote a histogram of data divided into 1 sec bins. Red curve is a Poisson curve with rate = median count rate of data. |
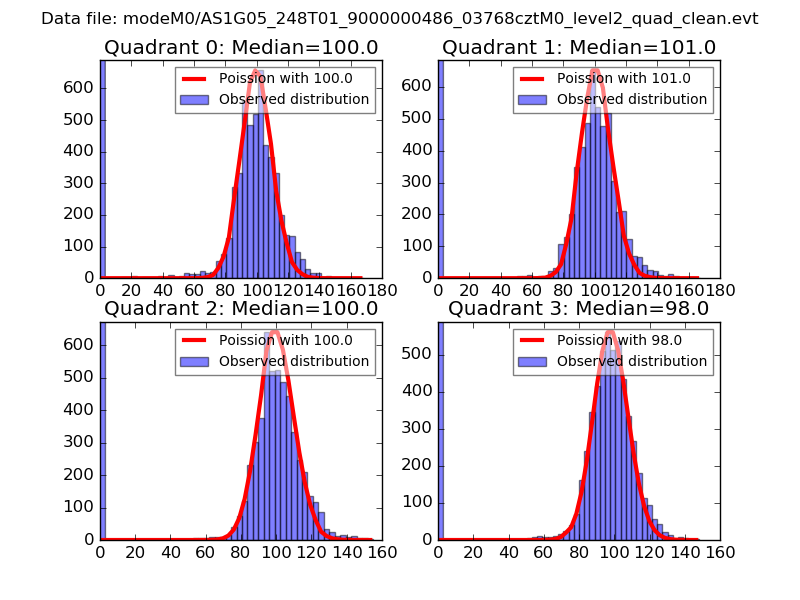 |
 |
| Quadrant-wise count rates Data is divided into 100 sec bins |
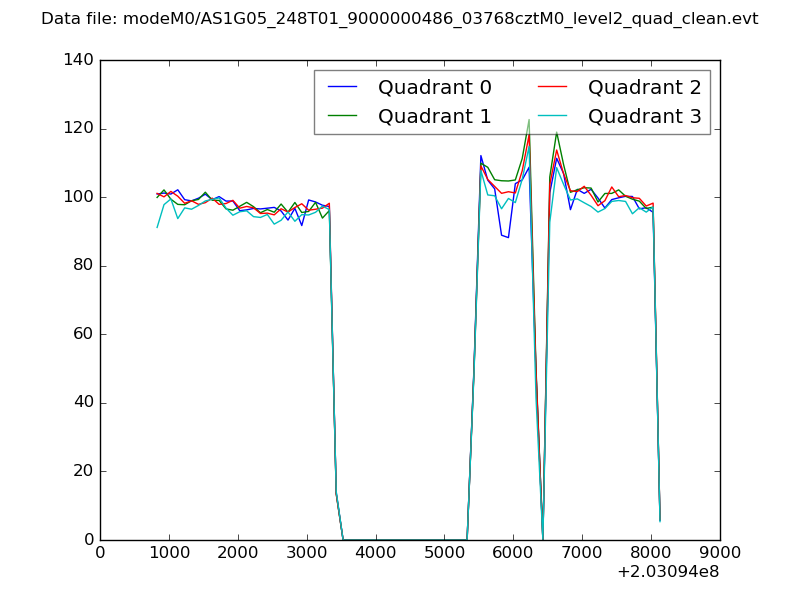 |
|
| Module-wise count rates for Quadrant A Data is divided into 100 sec bins |
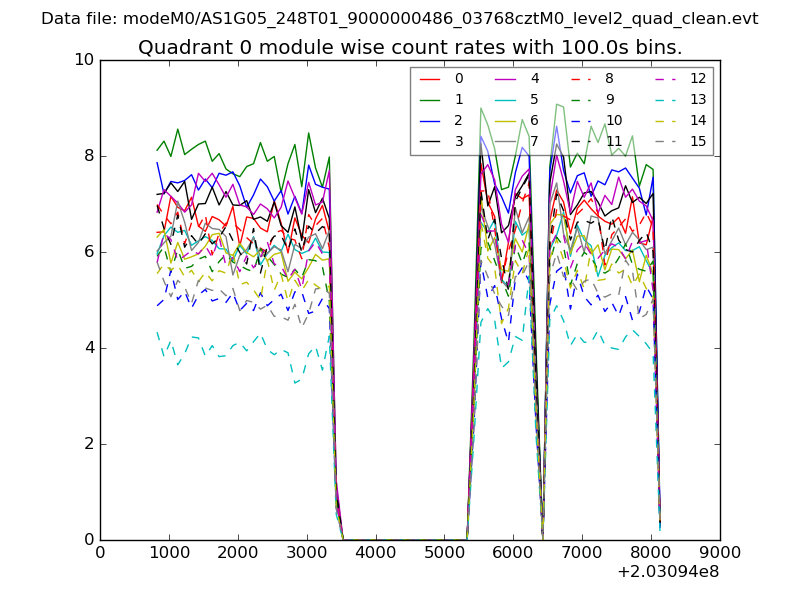 |
 |
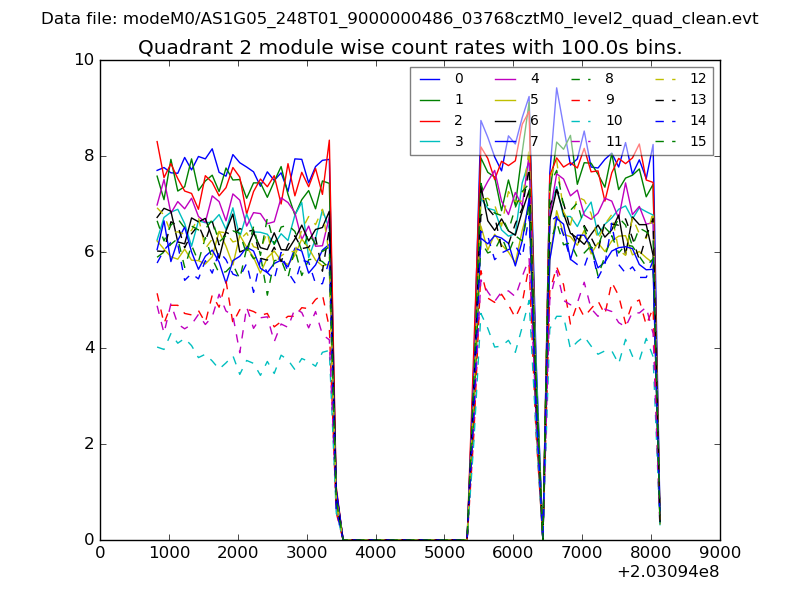
| Module-wise count rates for Quadrant B Data is divided into 100 sec bins |
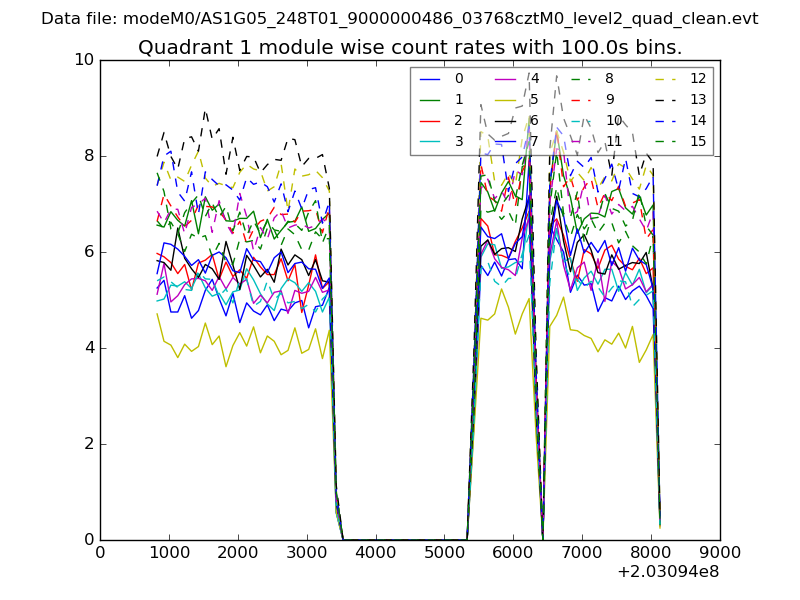 |
 |
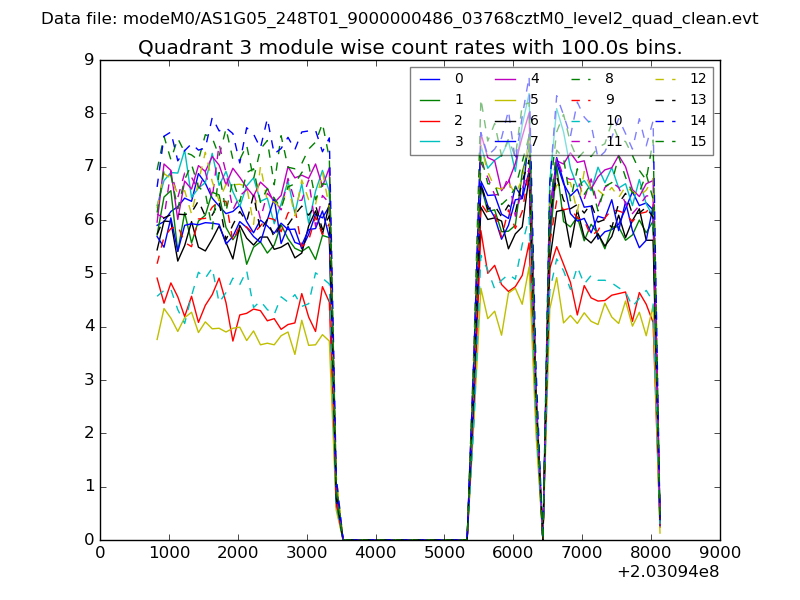
| Module-wise count rates for Quadrant C Data is divided into 100 sec bins |
 |
 |
| Module-wise count rates for Quadrant D Data is divided into 100 sec bins |
 |
 |
| Parameter | Plot |
|---|---|
| CZT HV Monitor | 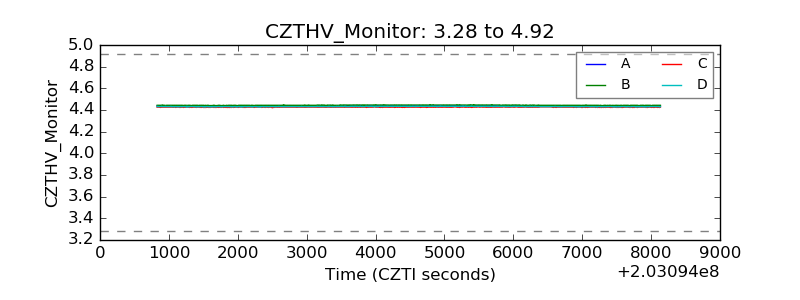 |
| D_VDD | 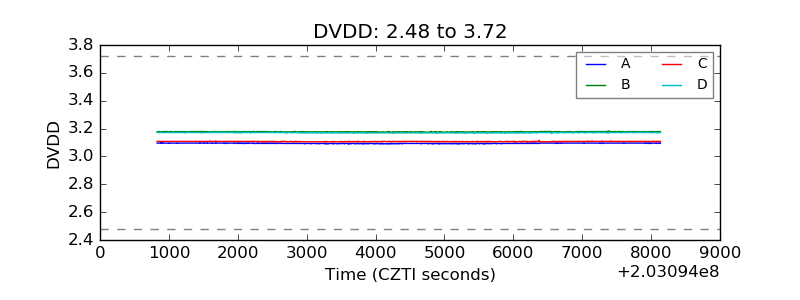 |
| Temperature 1 | 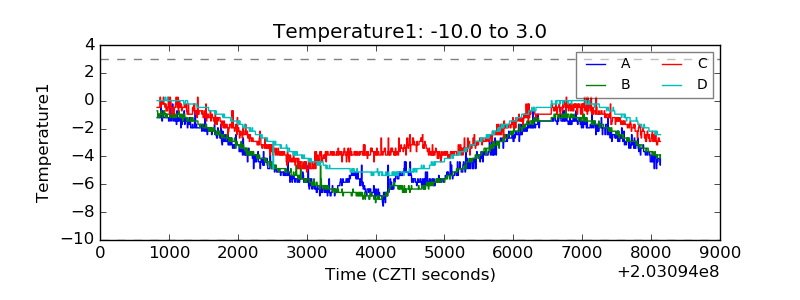 |
| Veto HV Monitor | 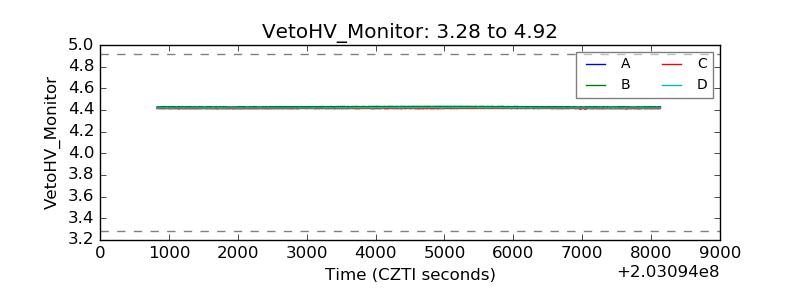 |
| Veto LLD | 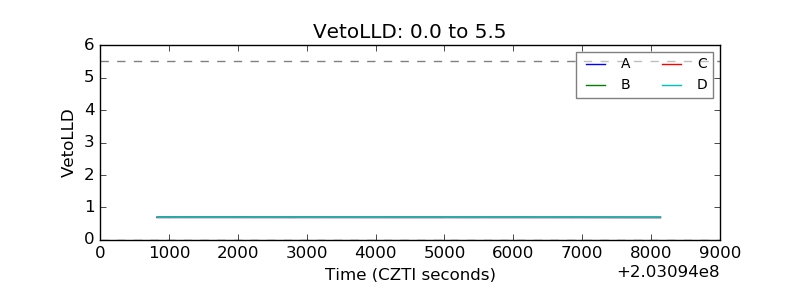 |
| Alpha Counter | 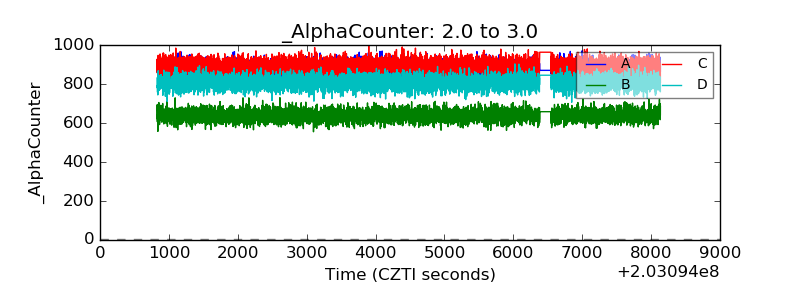 |
| _CPM_Rate | 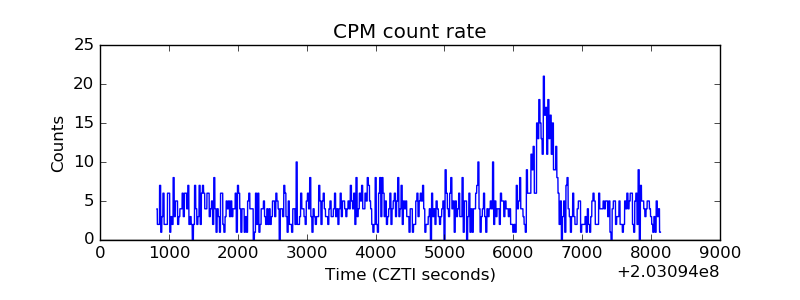 |
| CZT Counter | 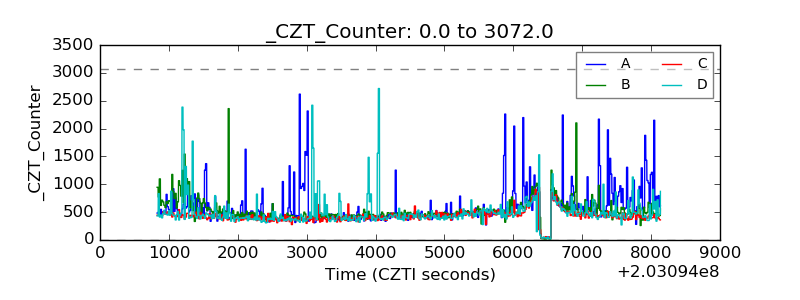 |
| +2.5 Volts monitor |  |
| +5 Volts monitor | 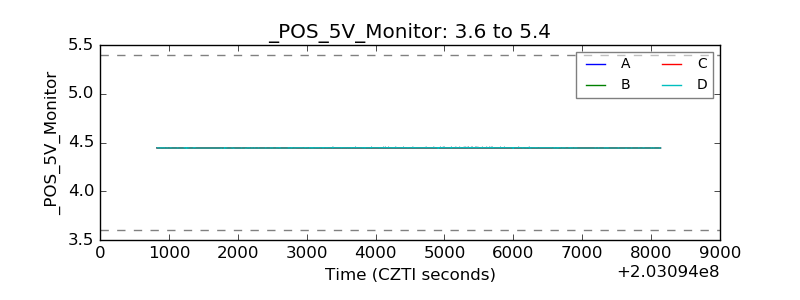 |
| Veto Counter | 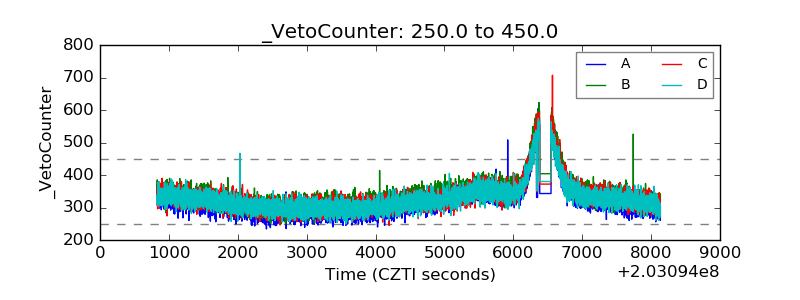 |